- Protocols

- Articles and Issues
- For Authors
- About
- Become a Reviewer

Evaluation of B Cell Proliferation in vivo by EdU Incorporation Assay
Published: Vol 10, Iss 9, May 5, 2020 DOI: 10.21769/BioProtoc.3602 Views: 6694
Reviewed by: Meenal SinhaJason A. NeidlemanAnonymous reviewer(s)
Original research article
The authors used this protocol in:
Apr 2019

Protocol Collections
Comprehensive collections of detailed, peer-reviewed protocols focusing on specific topics


Related protocols

Abstract
Generation of antibodies is crucial for establishing enduring protection from invading pathogens, as well as for maintaining homeostasis with commensal bacteria at mucosal surfaces. Chronic exposure to microbiota- and dietary- derived antigens results in continuous production of antibody producing cells within the Peyer’s patch germinal center structures. Recently, we have shown that B cells responding to gut-derived antigens colonize the subepithelial dome (SED) in Peyer’s patches and rapidly proliferate independently of their relative BCR affinity. To evaluate B cell proliferation within different niches in Peyer’s patches, we applied in vivo EdU incorporation assay as described in this protocol.
Background
Long-lived antibody producing cells, also known as plasmablasts or plasma cells (PCs) primarily originate from germinal centers (GCs), microanatomical sites that form within lymphoid organs following infection or immunization. Entry into the GC reaction involves affinity-based competition of B cells, each expressing an antigen-specific B cell receptor (BCR) with a given affinity and specificity towards the antigen. Upon antigen encounter, B cell activation takes place, which is accompanied by extensive clonal expansion through rapid proliferation. Peyer’s patches (PPs) are lymphoid organs located along the small intestine and are the main site where B cells class switch their immunoglobulins to IgA. The subepithelial dome (SED) is a small niche within the PP wherein immune cells, including B cells, interact with gut-derived antigens. During pre-GC events in PPs, B cells bearing high affinity BCRs do not show preferential advantage in colonization of the SED and formation of PCs, indicating that affinity-based competition does not take place at this site (Biram et al., 2019). Nonetheless, only high affinity clones progress into the GC structures and enter the germinal center reaction. Massive proliferation is a major aspect of the GC reaction in peripheral lymph nodes, spleen and PPs (Victora and Nussenzweig, 2012). During the GC response, B cells undergo iterative cycles of migration between the dark zone (DZ), where they proliferate and mutate their antibody-encoding genes and the light zone (LZ), where the high affinity varaiants are selected by T follicular helper (Tfh) cells for preferential expansion and differentiation into plasma cells. B cells in the GC rapidly divide, and the magnitude of this proliferation is proportional to the strength of T cell help (Gitlin, Shulman and Nussenzweig, 2014). Although B cell proliferation can be induced in vitro by LPS and anti-IgM stimulation, analysis of GC B cell proliferation in culture is currently not possible. In particular, analysis of B cell proliferation in specialized immunological niches such as the SED, can be only examined in vivo.
There are various techniques to measure cell proliferation, which are based on the detection of DNA synthesis, cellular metabolism or proliferation-associated proteins. Cellular metabolism markers such as MTT, XTT and WST-1 assays provide an indirect measurement of cell proliferation and can be inaccurate or in some cases toxic to cells (Liu et al., 1997; Huang et al., 2004). The use of proliferation proteins is a more common and widely used technique and includes staining for Ki67, PCNA and MCM-2 proteins (Bologna-Molina et al., 2013; Carreón-Burciaga et al., 2015). DNA synthesis-based techniques including BrdU, EdU, IdU and CIdU rely on the incorporation of these nucleoside analogs into newly formed DNA strands. As for EdU, the nucleoside incorporation is detected by a click reaction that involves a copper-catalyzed azide-alkyne cycloaddition. DNA replication occurs during S-phase and at this stage, nucleosides are being integrated into the newly formed DNA. Cell cycle progression towards G2/M-phase involves an increase in DNA content. The combination of EdU administration with DNA content staining, which discriminates G1, S and G2/M cells, allows the analysis of proliferation in the different cell-cycle stages. Unlike proliferation-associated protein measurement, DNA synthesis-based measurement, which involves injection of nucleosides into mice, can capture the dynamics of proliferation according to the time allowed for the nucleoside to incorporate into the DNA (Ouadah et al., 2019). In addition, combination of more than one analog, followed by analog-specific detection may provide information on cell populations at different cell cycle stages and on the rate of transition between the stages. Such a method was implemented to study how the magnitude of T cell help affects the speed of the cell cycle within the GC response (Gitlin et al., 2014). Therefore, EdU and other analogs are the preferred method for quantification of proliferating cells within the germinal center. Here, we provide details for EdU incorporation measurement by flow cytometry of B cells in different compartments within the gut associated lymphoid organs. This protocol can be easily adapted to analyze cell proliferation in other experimental systems.
Materials and Reagents
- BD Micro-FineTM Plus 0.5 ml 30 G insulin syringe (BD, catalog number: 230-45094 )
- Sterile Syringe 3 ml, luer lock (MedHarmony, catalog number: 181110 )
- MonojectTM 18 G blunted cannula (Covidien, catalog number: 8881202348 )
- Cell strainer with a 70 µm pore size (SPL, catalog number: 93070 )
- 5 ml polystyrene round-bottom tube with a cell strainer cap (Falcon, catalog number: 352235 )
- 8-week old C57BL/6 wild-type mice (Envigo)
- 5-ethynyl-2’-deoxyuridine (EdU) (Thermo Fisher Scientific, Invitrogen, catalog number: E10187 )
- Bovine serum albumin (BSA), fraction V (MP, catalog number: 160069 )
- Click-iTTM Plus EdU Alexa FluorTM 647 Flow Cytometry Assay Kit (Thermo Fisher Scientific, Invitrogen, catalog number: C10634 )
- TruStain FcXTM (anti-mouse CD16/32) Antibody (Biolegend, clone: 93, catalog number: 101319 )
- V500 anti-mouse B220 (CD45R) antibody (BD, clone: RA3-6B2, catalog number: 561226 )
- Brilliant violet 605 anti-mouse CD138 (Syndecan-1) antibody (Biolegend, clone: 281-2, catalog number: 142515 )
- PE-Cy7 anti-mouse CD95 (FAS) antibody (BD, clone: Jo2, catalog number: 557653 )
- Alexa Fluor 700 anti-mouse CD38 antibody (eBioscience by Thermo Fisher Scientific, clone: 90, catalog number: 56-0381-82 )
- Biotin anti-mouse IgA antibody (Biolegend, clone: RMA-1, catalog number: 407003 ). Detected with Streptavidin APC-Alexa Flour 780 (eBioscience by Thermo Fisher Scientific, catalog number: 47-4317-82 )
- Brilliant violet 421 anti-mouse CD196 (CCR6) antibody (BD, clone: 140706, catalog number: 564736 )
- Phosphate buffered saline (PBS) (Biological Industries, catalog number: 02-023-1A )
- 1% BSA PBS (see Recipes)
- EdU solution (see Recipes)
Equipment
- Dry bath incubator
- Analitical balance
- Rocking shaker
- Curved scissors (FST, catalog number: 14091-09 )
- CytoFlex flow cytometer (Beckman Coulter)
Software
- FlowJo software (LLC)
Procedure
Notes: Buffers should be prepared fresh on the day of the experiment:
- 1x Click-iT® EdU permeabilization and wash reagent is diluted with deionized water.
- Click-iT® EdU buffer additive aliquots should be kept in -20 °C and diluted only prior to the preparation of the reaction cocktail with deionized water.
- Mice used in this protocol were 8-10 weeks old with an average weight of ~25 g.
- All animal experiments should be performed with an adequate ethics approval.
- This protocol was used to measure B cell proliferation within Peyer’s patches but it is also suited for other lymph nodes and spleen.
- Inject 200 µl EdU (2 mg) intravenously via the retro-orbital sinus of C57BL/6 wild-type mice.
- 2.5 h following EdU administration, sacrifice the mice by cervical dislocation.
- Open the abdominal cavity and remove the small intestine from the cecum to stomach.
- Flush the intestine with 40 ml PBS using a 30 ml syringe with an 18 G MonojectTM blunted cannula. Avoid contact of the tissue with the flushed out intestinal contents.
- Using curved scissors facing up, excise the Peyer’s patches and avoid excising adjacent intestinal tissue (about 6-10 Peyer’s patches are expected per mouse with an overall of 3-10 million cells from all Peyer’s patches).
- Place the PPs in a petri dish with a 70 µm cell strainer and 3 ml 1% BSA PBS.
- Using a pistol of a 3 ml syringe mash the PPs to create a single-cell suspension of PP-derived cells.
- Transfer the cell suspension into a FACS tube with a cell-strainer cap.
- Wash the petri dish with additional 1 ml of 1% BSA PBS buffer and collect the solution into the same FACS tube to maximize cell collection.
- Spin down the cells at 300 RCF for 7 min at 4 °C.
- Discard the supernatant and resuspend the cells with the residual buffer (approximately 100 µl).
- Add 1 µl Fc blocker antibody (TruStain FcXTM, CD16/32), vortex and place on ice.
- Incubate 5 min on ice.
- Add 100 µl staining mix prepared in 1% BSA PBS. If proliferation should be analyzed in the B cell compartments, as in the associated study, the following markers can be used: the germinal center (B220+ CD138- FAS+ CD38-); the subepithelial dome (B220+ CD138- IgA+ CD38+ CCR6+) and the plasma cell compartment (CD138+). As negative control, we assessed EdU incorporation in the Naïve B cell compartment (B220+ CD138- CD38+ FAS-). Since the residual volume in the tube following blocking is approximately 100 μl, the antibody mix is prepared as a 2x concentration to achieve final dilution as indicated in Table 1.
Table 1. List of antibodies used for surface staining of GC and SED B cells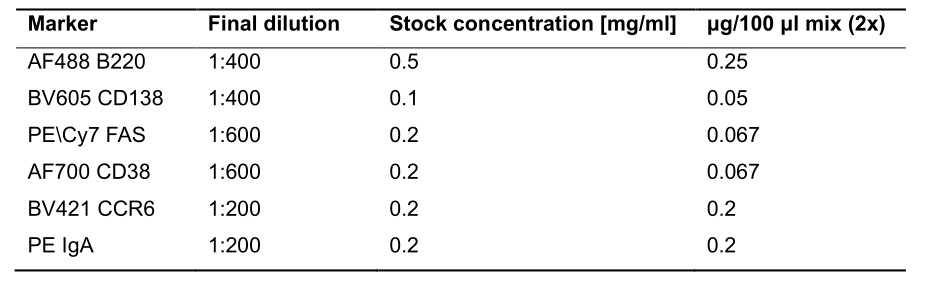
- Vortex and incubate on ice for 30 min in the dark to allow surface marker staining.
- Wash the cells with 2 ml 1% BSA PBS and spin down the cells at 300 RCF for 7 min at 4 °C.
- Resuspend the cells with 100 µl Click-iTTM fixative (4% paraformaldehyde in PBS).
- Incubate for 15 min in the dark at room temperature.
- Add 3 ml 1% BSA PBS and spin down the cells at 300 RCF for 7 min at 4 °C.
- Discard the supernatant and resuspend the cells with 100 µl 1x Click-iT® EdU permeabilization and wash reagent.
- Mix well by pipetting, do not vortex.
- Incubate for 15 min in the dark at room temperature.
- Prepare the Click-iTTM Plus reaction cocktail according to the Table 2.
Table 2. Click-iTTM Plus reaction cocktail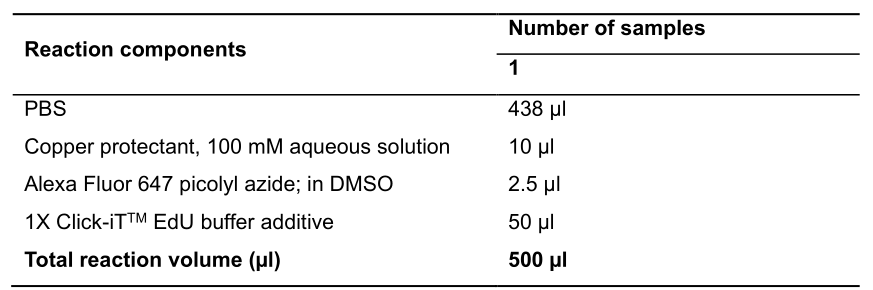
Important notes:- Prepare the cocktail during Step 22.
- Add the reaction components in the order listed in the table.
- Use the cocktail within 15 min of its preparation.
- Keep the cocktail at room temperature until use.
- Extra volume calculation is not necessary.
- Add 500 µl of the Click-iTTM Plus reaction cocktail to each sample. The total volume is 600 µl.
- Incubate for 30 min in the dark at room temperature.
- Add 3 ml 1x Click-iT® EdU permeabilization and wash reagent and spin down the cells at 300 RCF for 7 min at 4 °C.
- Resuspend the cells with 500 µl 1x Click-iT® EdU permeabilization and wash reagent and analyze the cells using CytoFlex flow cytometer (Beckman Coulter).
Data analysis
Cells that incorporated the EdU are detected by flow cytometry with the indicated fluorophore. Gate on your population of interest and from this population gate on the EdU+ cells in a histogram or on a dot plot. EdU+ cells in the germinal center are often a distinct population (see Figure 1 below) but in some cases may appear as a tail of the population, depending on the detection efficiency. Naïve B cells are used as a negative control, where no proliferation takes place. For 2.5 h incubation with EdU, the normal range for GC EdU+ cell population is 20-30%. A total of 1.5 million events were acquired per sample.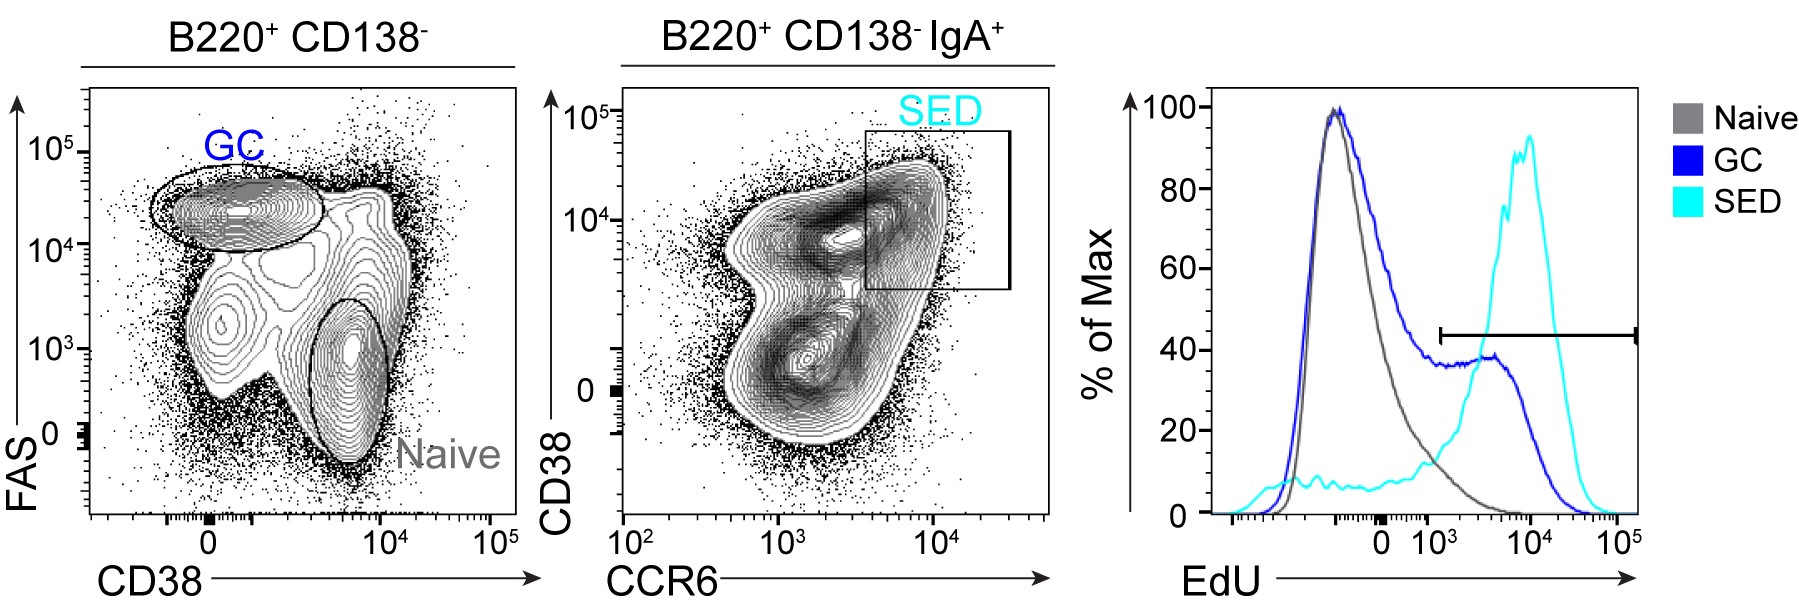
Figure 1. EdU distribution in naïve, GC and SED PP B cells
Notes
This protocol provides details for EdU detection using a commercial kit by Invitrogen, Thermo Fisher Scientific and was therefore adapted from the kit manual and adjusted to our experimental setup. Please note that two flow cytometry kits are available: Click-iTTM EdU Flow Cytometry Assay Kit and Click-iTTM Plus EdU Flow Cytometry Assay Kit. This protocol is reproducible only with the Click-iTTM Plus kit due to its compatibility with the fluorophores used in the study associated with this protocol.
Recipes
- 1% BSA PBS
1 g BSA, fraction V
100 ml PBS
Dissolve on a rocking shaker. Do not vortex
Prepare fresh and keep on ice - EdU solution (10 mg/ml)
- Weigh 10 mg EdU in an Eppendorf tube
- Dissolve in 1 ml PBS and incubate at 37 °C in a dry bath until EdU is mostly dissolved.
Acknowledgments
Z.S. is supported by the European Research Council (grant No. 677713), Human Frontiers of Science Program (grant No. CDA-00023/2016), Israel Science Foundation (grant No. 1090/18), Azrieli Foundation, Rising Tide Foundation and the Morris Kahn Institute for Human Immunology. Z.S. is a member in the European Molecular Biology Organization Young Investigator Program and is supported by grants from The Benoziyo Endowment Fund for the Advancement of Science, The Sir Charles Clore Research Prize, Comisaroff Family Trust, Irma & Jacques Ber-Lehmsdorf Foundation, Gerald O. Mann Charitable Foundation and David M. Polen Charitable Trust.
This protocol provides details regarding EdU in vivo proliferation assay as previously described (Biram et al., 2019).
Competing interests
The author declare no competing interests.
Ethics
All experimental procedures have been approved by the Weizmann Institute Animal Care and Use Committee (IACUC) and followed all relevant ethical regulations, IACUC number 00960118-4.
References
- Biram, A., Strömberg, A., Winter, E., Stoler-Barak, L., Salomon, R., Addadi, Y., Dahan, R., Yaari, G., Bemark, M. and Shulman, Z. (2019). BCR affinity differentially regulates colonization of the subepithelial dome and infiltration into germinal centers within Peyer’s patches. Nature Immunology 20(4): 482-492.
- Bologna-Molina, R., Mosqueda-Taylor, A., Molina-Frechero, N., Mori-Estevez, A. D. and Sánchez-Acuña, G. (2013). Comparison of the value of PCNA and Ki-67 as markers of cell proliferation in ameloblastic tumors. Med Oral Patol Oral Cir 18(2): e174-e179.
- Carreón-Burciaga, R. G., González-González, R., Molina-Frechero, N. and Bologna-Molina, R. (2015). Immunoexpression of Ki-67, MCM2, and MCM3 in Ameloblastoma and Ameloblastic Carcinoma and their correlations with clinical and histopathological patterns. Dis Markers 2015: 683087-683087.
- Gitlin, A. D., Shulman, Z. and Nussenzweig, M. C. (2014). Clonal selection in the germinal centre by regulated proliferation and hypermutation. Nature 509(7502): 637-640.
- Huang, K. T., Chen, Y. H. and Walker, A. M. (2004). Inaccuracies in MTS assays: major distorting effects of medium, serum albumin, and fatty acids. Biotechniques 37(3): 406, 408, 410-402.
- Liu, Y., Peterson, D. A., Kimura, H. and Schubert, D. (1997). Mechanism of cellular 3-(4,5-dimethylthiazol-2-yl)-2,5-diphenyltetrazolium bromide (MTT) reduction. J Neurochem 69(2): 581-593.
- Ouadah, Y., Rojas, E. R., Riordan, D. P., Capostagno, S., Kuo, C. S. and Krasnow, M. A. (2019). Rare pulmonary neuroendocrine cells are stem cells regulated by Rb, p53, and notch. Cell 179(2): 403-416 e423.
- Victora, G. D. and Nussenzweig, M. C. (2012). Germinal centers. Annu Rev Immunol 30: 429-457.
Article Information
Copyright
© 2020 The Authors; exclusive licensee Bio-protocol LLC.
How to cite
Biram, A. and Shulman, Z. (2020). Evaluation of B Cell Proliferation in vivo by EdU Incorporation Assay. Bio-protocol 10(9): e3602. DOI: 10.21769/BioProtoc.3602.
Category
Immunology > Immune cell function > Lymphocyte
Immunology > Animal model > Mouse
Cell Biology > Cell-based analysis > Flow cytometry
Do you have any questions about this protocol?
Post your question to gather feedback from the community. We will also invite the authors of this article to respond.