- Protocols

- Articles and Issues
- For Authors
- About
- Become a Reviewer

Non-radiometric Cell-free Assay to Measure the Effect of Molecular Chaperones on AMP-activated Kinase Activity

Published: Vol 9, Iss 8, Apr 20, 2019 DOI: 10.21769/BioProtoc.3218 Views: 5509
Reviewed by: Shailesh KumarSalim GasmiAnonymous reviewer(s)
Original research article
The authors used this protocol in:

Sep 2018
Advertisement


Protocol Collections
Comprehensive collections of detailed, peer-reviewed protocols focusing on specific topics


Related protocols
Abstract
AMP-activated kinase (AMPK) is a trimeric protein holoenzyme with kinase activity. AMPK plays an important role in cellular metabolism and is thought to function as a fuel sensor within the cell, exerting kinase activity to activate energy-conserving pathways and simultaneously inhibit energy-consuming pathways. Traditional in vitro methods to measure AMPK activity to test potential agonists or antagonists utilize radiolabeled ATP with a peptide substrate. Although radiolabeling provides a high level of sensitivity, this approach is not ideal for medium to high-throughput screening, dose-response curves, or kinetic analyses. Our protocol utilizes Invitrogen’s Z’-LYTETM Kinase Assay Kit (Ser/Thr 23 Peptide) to measure changes in the enzymatic activity of AMPKɑ2β1γ1 in the presence of a molecular chaperone. The Z’-LYTETM platform is based on Fluorescence Resonance Energy Transfer (FRET). The AMPK peptide substrate (S/T 23 peptide: MRPRKRQGSVRRRV) is a self-contained FRET system, using coumarin as the donor and fluorescein as the acceptor. When the peptide is phosphorylated, it is sensitive to cleavage by a site-specific protease. The cleavage of the phospho-peptide eliminates the FRET pair, and the ratiometric analysis of FRET is used as an indirect measure of AMPK kinase activity. This method does not require the use of radiolabeling or antibodies and is used in a multi-well format, with high reproducibility and throughput capabilities.
Keywords: KinaseBackground
AMPK plays an important role in cellular metabolism (Ross et al., 2016). Dysfunction in AMPK signaling is associated with a wide range of pathophysiological conditions such as cardiovascular diseases, diabetes, cancer, neurological diseases, and aging (Ronnebaum et al., 2014). Therefore, identifying activators and inhibitors of AMPK activity are important both in the development of therapeutics and to study off-target effects of other small molecules. We previously determined the chaperone effect of the enzyme CHIP on AMPKα1 and AMPKα2 holoenyzmes by measuring the phosphorylation of the SAMS peptide in the presence of radiolabeled ATP (Schisler et al., 2013). While sensitive, laboratories commonly utilize a spotting technique (each condition must be spotted individually) that is time sensitive (reactions can saturate within minutes), making dose response experiments and the simultaneous screening of multiple compounds difficult (Hastie et al., 2006). In a more recent study, we adapted a commercial FRET-based assay to study the effect of CHIP mutations on AMPK activity (Shi et al., 2018).
Materials and Reagents
- 384 multi-well plates (MWP) with the following characteristics: black, low-volume, round bottom, non-binding
- PCR strip tubes (or 96 MWP)
- Pipette tips
- Z’LYTETM Kinase Assay Kit-Ser/Thr 23 Peptide (Thermo Fisher Scientific, catalog number: PV4644)
- 4-(2-Hydroxyethyl)piperazine-1-ethanesulfonic acid (HEPES) (CAS Number: 7365-45-9, bioreagent grade)
- Ethylene glycol-bis(2-aminoethylether)-N,N,N,N-tetraacetic acid (EGTA) (CAS Number: 67-42-5, molecular biology grade)
- Polyoxyethylene (23) lauryl ether (Brij-35) (CAS Number: 9002-92-0)
- Magnesium chloride (MgCl2) (CAS Number: 7786-30-3, bioreagent grade)
- Sodium chloride (NaCl) (CAS Number: 7647-14-5, certified ACS)
- Purified and phosphorylated AMPKα2β1γ1 or other active isoforms (commercially available from multiple vendors, or to produce in-house, see Neumann et al., 2003 and Schisler et al., 2013)
- Molecule/compound/protein of interest (in this example, recombinant CHIP protein, commercially available from multiple vendors, or to produce in-house, see Shi et al., 2018).
- HEPES storage buffer (10x) (see Recipes)
- Kinase buffer A (10x) (see Recipes)
Equipment
- Repeat pipettor (to aliquot 1-20 µl)
- Low-volume multichannel pipettor (repeat pipettor recommended, 1-20 µl)
- Incubator or thermal mixer
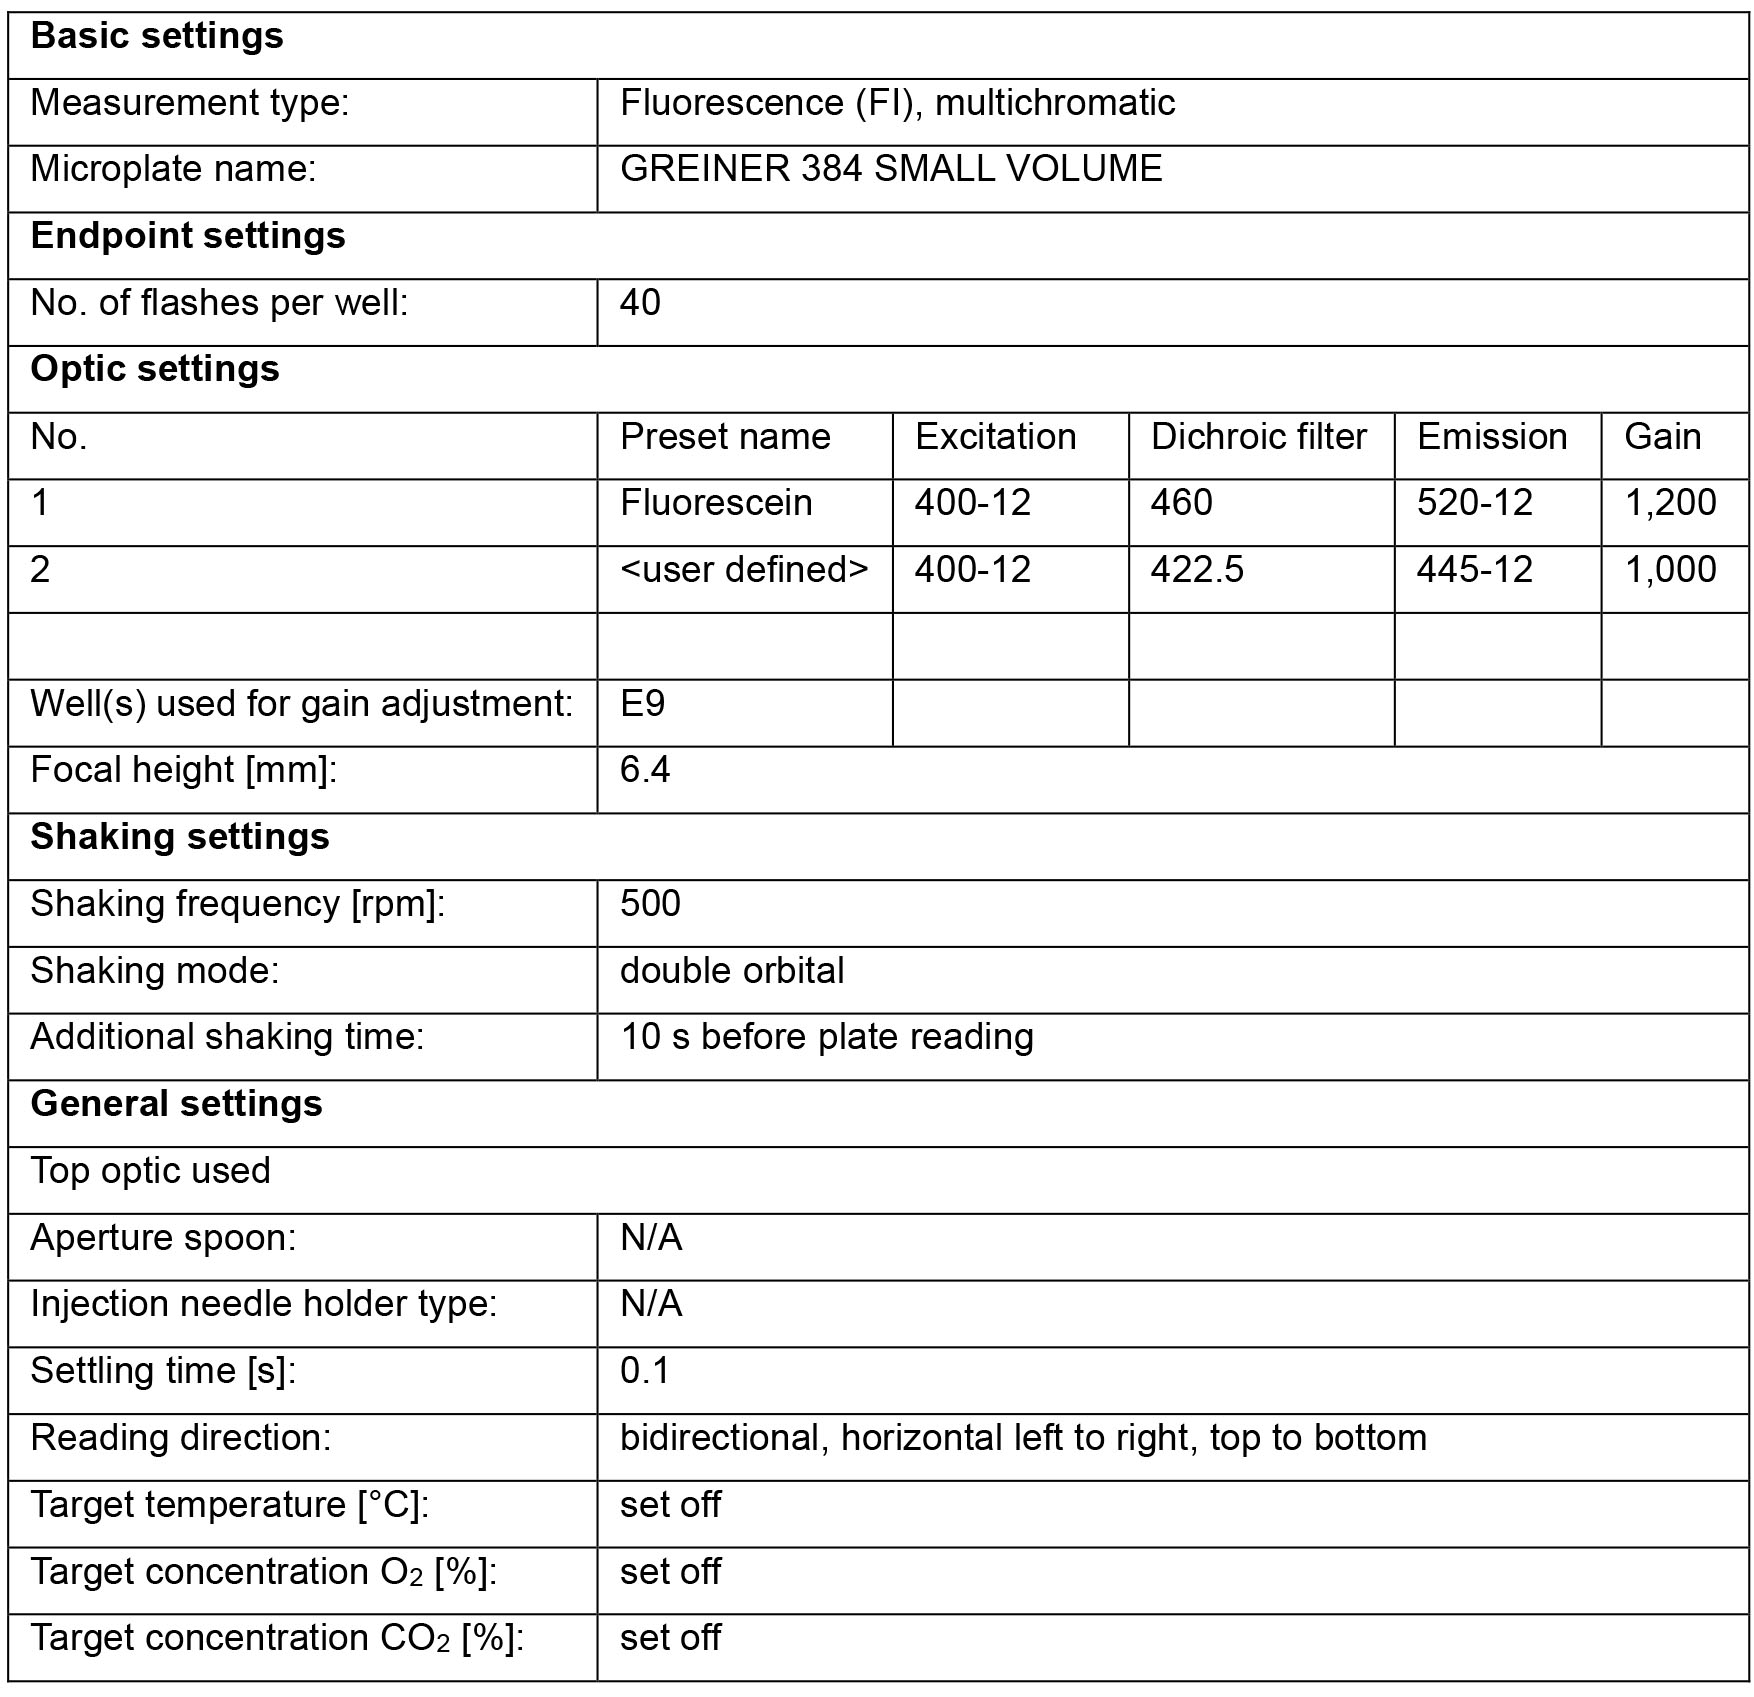
- A fluorescence plate reader with filter sets that detecting the fluorescent emission of coumarin and fluorescein. We use the CLARIOstar (BMG LABTECH) with the following settings:
Software
- MARS Data Analysis Software (v3.31, BMG LABTECH) or equivalent plate reader software.
Procedure
The major steps of this protocol and the different plates used are outlined in Figure 1.
- Prepare screening compound(s)–Plate 1
Note: The compound(s) to be screened can be set up in a 96 MWP or PCR strip tubes.- Prepare the test compound(s). The compound(s) will be diluted 10-fold when added to the wells containing AMPK. Therefore, your need to initially prepare your starting compound(s) solution to be 10-fold higher than your final highest test concentration. In our example, started with CHIP at 140 µM, meaning in the initial reaction with AMPK, the concentration will be 10-fold less (14 µM). Also, in our example, 50 µl of compound per concentration was sufficient, however, make sure enough compound is prepared for your entire experiment.
- Prepare concentrated stock solution of compound. In our example, we started with 140 µM CHIP diluted in 1x HEPES storage buffer. Use the appropriate buffer for your compound and see the manufacturer’s instructions for the effect of buffers and additives.
- Prepare serial dilutions of the compound of interest 1:5, seven times in 1x storage buffer using a 96 MWP or strip tubes. For each dilution, add 8 µl of the previous dilution to 32 µl of 1x storage buffer. In a ninth tube, pipette only storage buffer. You should have eight dilutions of your compound in a format that is ready to use with a multichannel repeat pipettor (Figure 2).
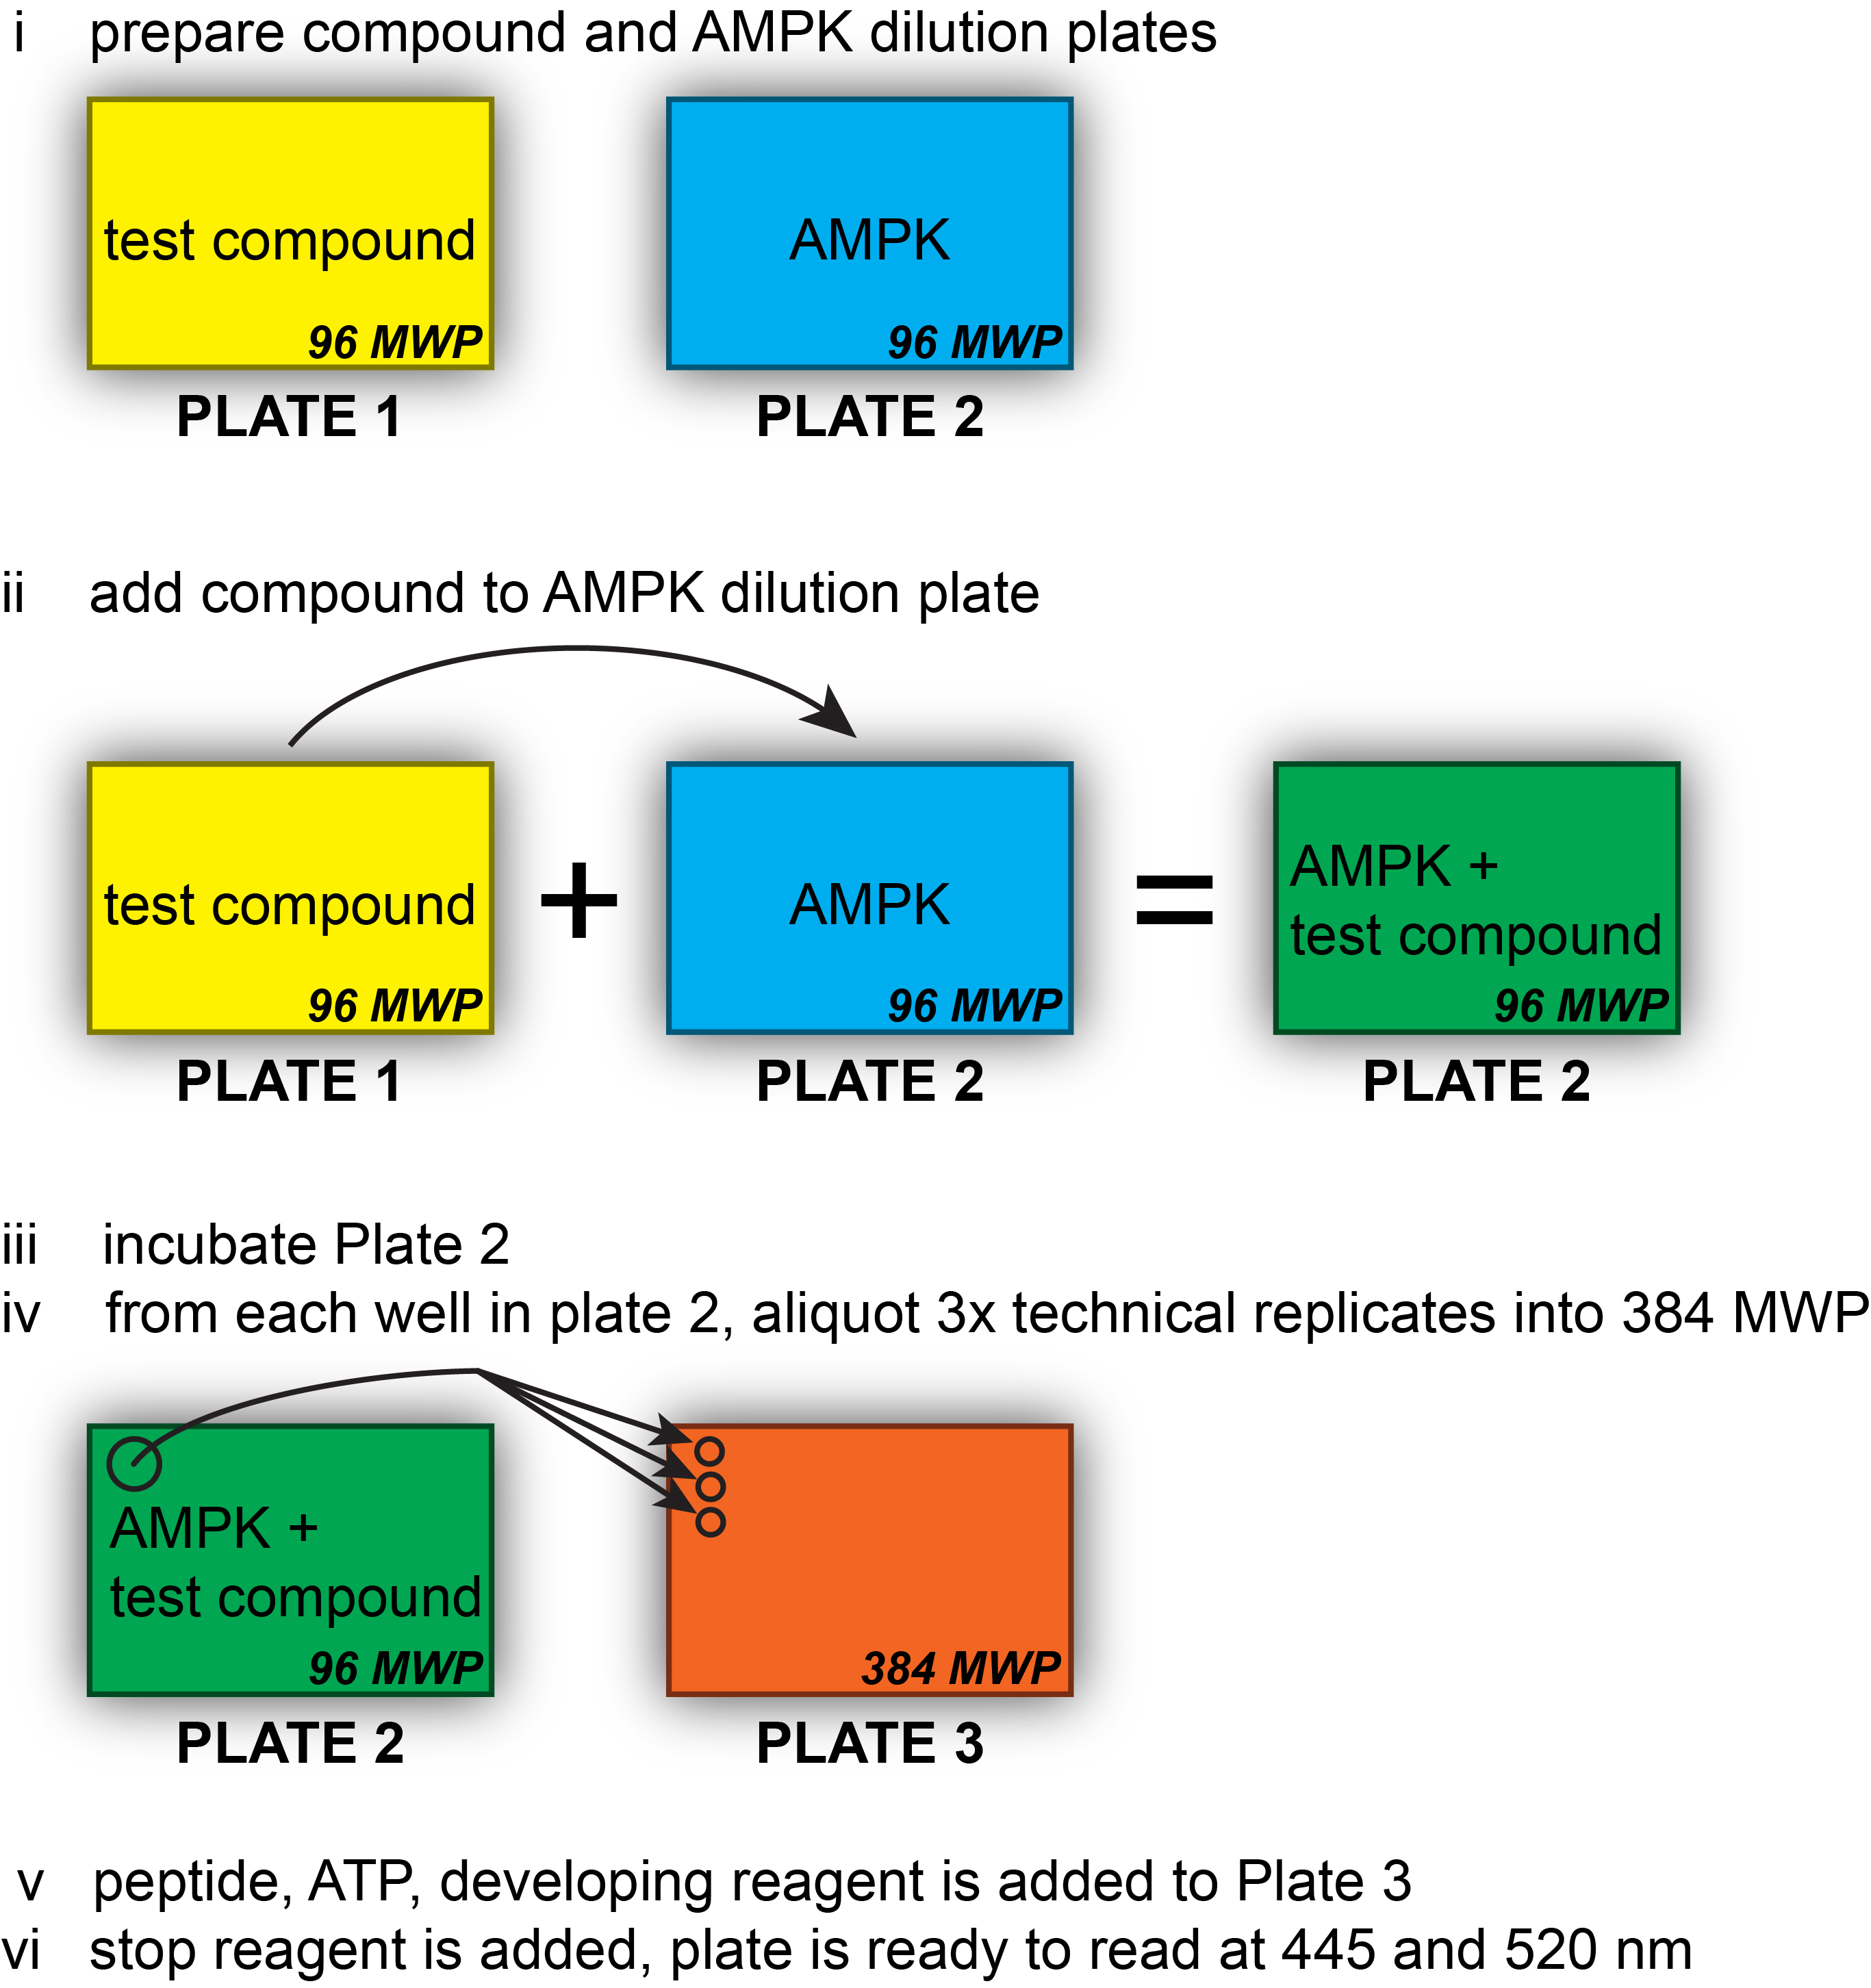
Figure 1. Assay workflow. The major steps of the assay and the different plates used are outlined. PCR strips can be used in place of the 96 MWP for Plate 1 and/or Plate 2.
Figure 2. Plate 1: Test compound to be screened. A total of 8 concentrations as well as a buffer control is used. The buffer should be same composition as the solution used to prepare the test compound. PCR strips can be used in lieu of 96 MWP.
- Prepare AMPK dilutions–Plate 2
Note: The kinase dilutions can be set up in a 96 MWP or PCR strip tubes.- Dilute the AMPK holoenzyme to 730 nM in a final volume of 600 µl in 1x kinase buffer A.
- Prepare two serial dilutions of AMPK, 1:10, in 1x kinase buffer A. For each, add 60 µl of the previous dilution to 540 µl 1x kinase buffer A. You should have three concentrations of AMPK.
- Aliquot 18 µl of each AMPK dilution into either 96 MWP or strip tubes using a repeat pipettor.
- Using a multichannel pipettor, add 2 µl of the compound of interest dilution series (Figure 2) including the blank buffer sample to each strip of AMPK (Figure 3).
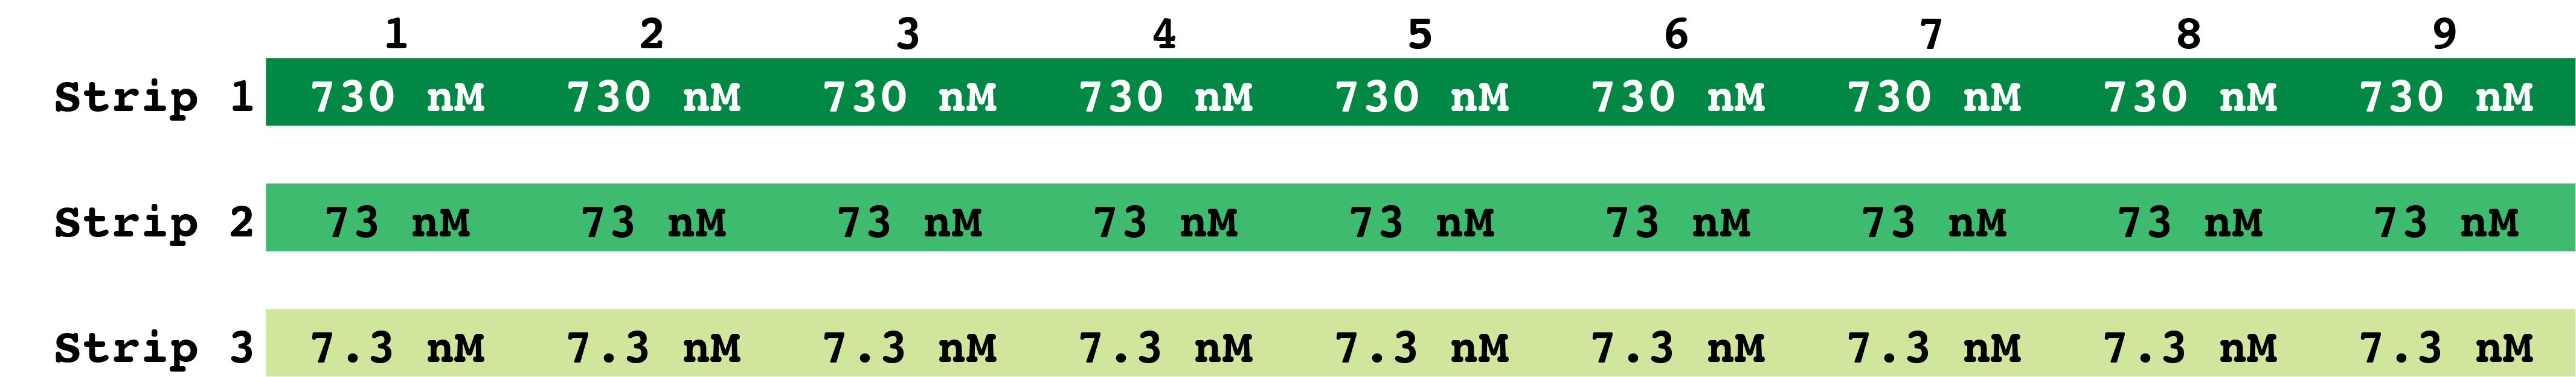
Figure 3. Plate 2: Layout of AMPK dilutions. A total of 9 wells per AMPK concentration are prepared in Plate 2. This plate will be used to prepare the test plate (Plate 3). PCR strips can be used in lieu of 96 MWP. - Incubate at 30 °C for 30 min with shaking.
- Quickly spin plate or strips to ensure the volume of the reaction is at the bottom of the well/tube.
- Prepare reaction plate–Plate 3
Note: You will now be moving reactions from either a 96 MWP or PCR strips into a 384 MWP. This is easily accomplished with a multi-channel repeat pipettor. The spacing difference between wells going from 96 to 384 MWP is halved, meaning in this example, when you use a standard multichannel pipettor, samples 1-9 in Plate 2 will be aligned to the first 9 odd rows in the 384 MWP (Plate 3).- Using a multi-channel repeat pipettor in the horizontal orientation set at 3 x 5 µl, add 5 µl of each reaction into the 384 MWP. This approach uses every-other column in a 384 MWP (in this example, odd columns, 1-17, Figure 4).
- With the repeat pipettor, add 5 µl 1x kinase buffer A to each well in rows J and K (Figure 4).
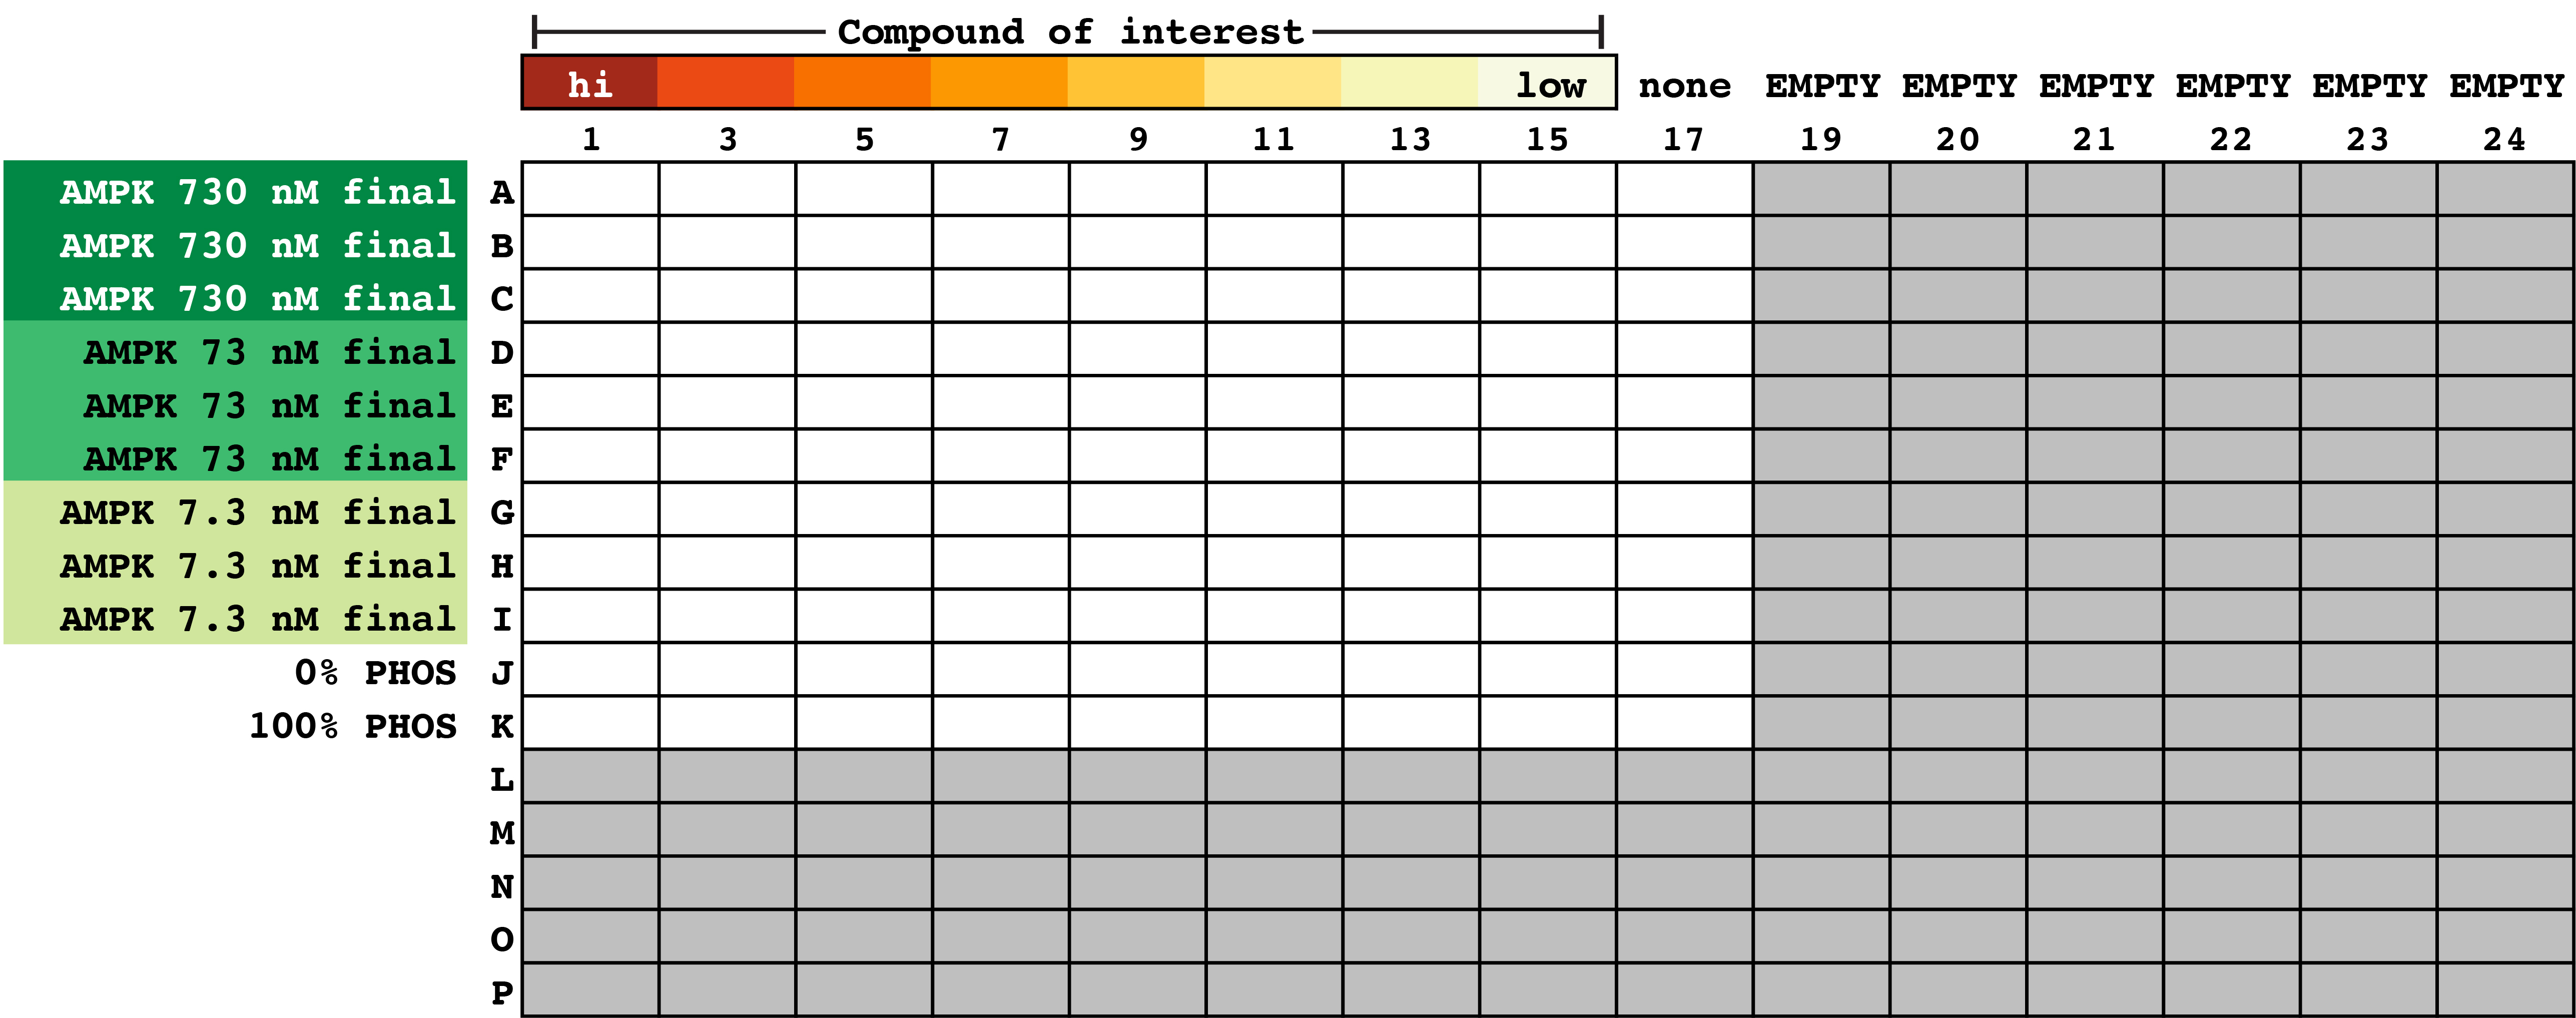
Figure 4. Layout of reaction plate. A total of 9 replicate wells per AMPK concentration are prepared. These replicates are for the eight compound dilutions (and buffer control). - Prepare enough of the 2x ATP/Z’-LYTETM mixture per manufacturer’s instructions to account for the number of wells used in the experiment (5 µl per well is needed for all wells except row K). The optimal concentration of ATP should be optimized per the manufacturer’s directions, however we found using our in-house AMPK preparations, the Km apparent was 50 µM. For this experiment we used 6 µl 10 mM ATP, 2.4 µl of 1 mM Z’-LYTETM peptide, and 591.6 µl 1x kinase buffer A. This yields a final ATP and peptide concentration in the reaction of 50 µM and 4 µM, respectively.
- Prepare the phospho-peptide solution per manufacturer’s instructions (in our example, we added 1 µl phospho-peptide to 249 µl of 1x kinase buffer A).
- Add 5 µl phospho-peptide solution to all wells in row K.
- Add 5 µl ATP/Z’-LYTETM mixture to all wells in rows A-J.
- Shake plate at low speed for 30 s.
- Incubate on benchtop at room temperature for 1 h.
- Prepare development solution per manufacturer’s instructions. Please note, this varies from lot to lot. Refer to the Development Reagent Certificate of Analysis enclosed with the kit. The Certificate indicates the correct dilution for each lot of Development Reagent into Development Buffer.
- Add 5 µl development solution in each well.
- Shake plate at low speed for 30 s.
- Incubate on benchtop at room temperature for 1 h.
- Add 5 µl stop reagent in each well. (You will need about 650 µl total)
- Shake plate at low speed for 30 s.
- Read in plate reader per manufacturer’s instructions.
Data analysis
All data is analyzed using the manufacturer’s instructions. Emission data is collected at 445 nm and 520 nm and used to calculate the emission ratio (445/520, Figure 5A). These data are then used to calculate the percent phosphorylation (Figure 5B):
where, Ratio = emission ratio of signal intensity collected at 445 nm divided by signal intensity collected 520 nm from an individual well;
F100% = mean fluorescein (445 nm) emission signal intensity of the 100% phosphorylation control (row K, Figure 4);
C100% = Average coumarin (520 nm) emission signal intensity of the 100% phosphorylation control (row K, Figure 4);
F0% = Average fluorescein emission signal intensity of the 0% phosphorylation control (row J, Figure 4);
C0% = Average coumarin emission signal intensity of the 0% phosphorylation control (row J, Figure 4).
We first determined the concentration of AMPK to be used in our reactions. Our study focused on agonist activity, however it is ideal to use conditions that can account for either direction of change in AMPK activity. This can be accomplished by first measuring the Z’-factor. The Z’-factor is a measure of statistical effect size (1 being the highest value) and is used to evaluate sensitivity and variability of the performance of a high throughput assay. Each prep of AMPK should be first tested to determine the starting concentration that yields a phosphorylation level suitable for the assay. In this example, AMPK at 730 nM with ATP at 50 µM resulted in 33% phosphorylation (Figure 5), corresponding to a Z’ value of 0.66 using the manufacture’s calculation. The manufacture suggests assays should be done using AMPK and ATP concentrations that result in 20%-50% peptide phosphorylation, with Z’ values > 0.5.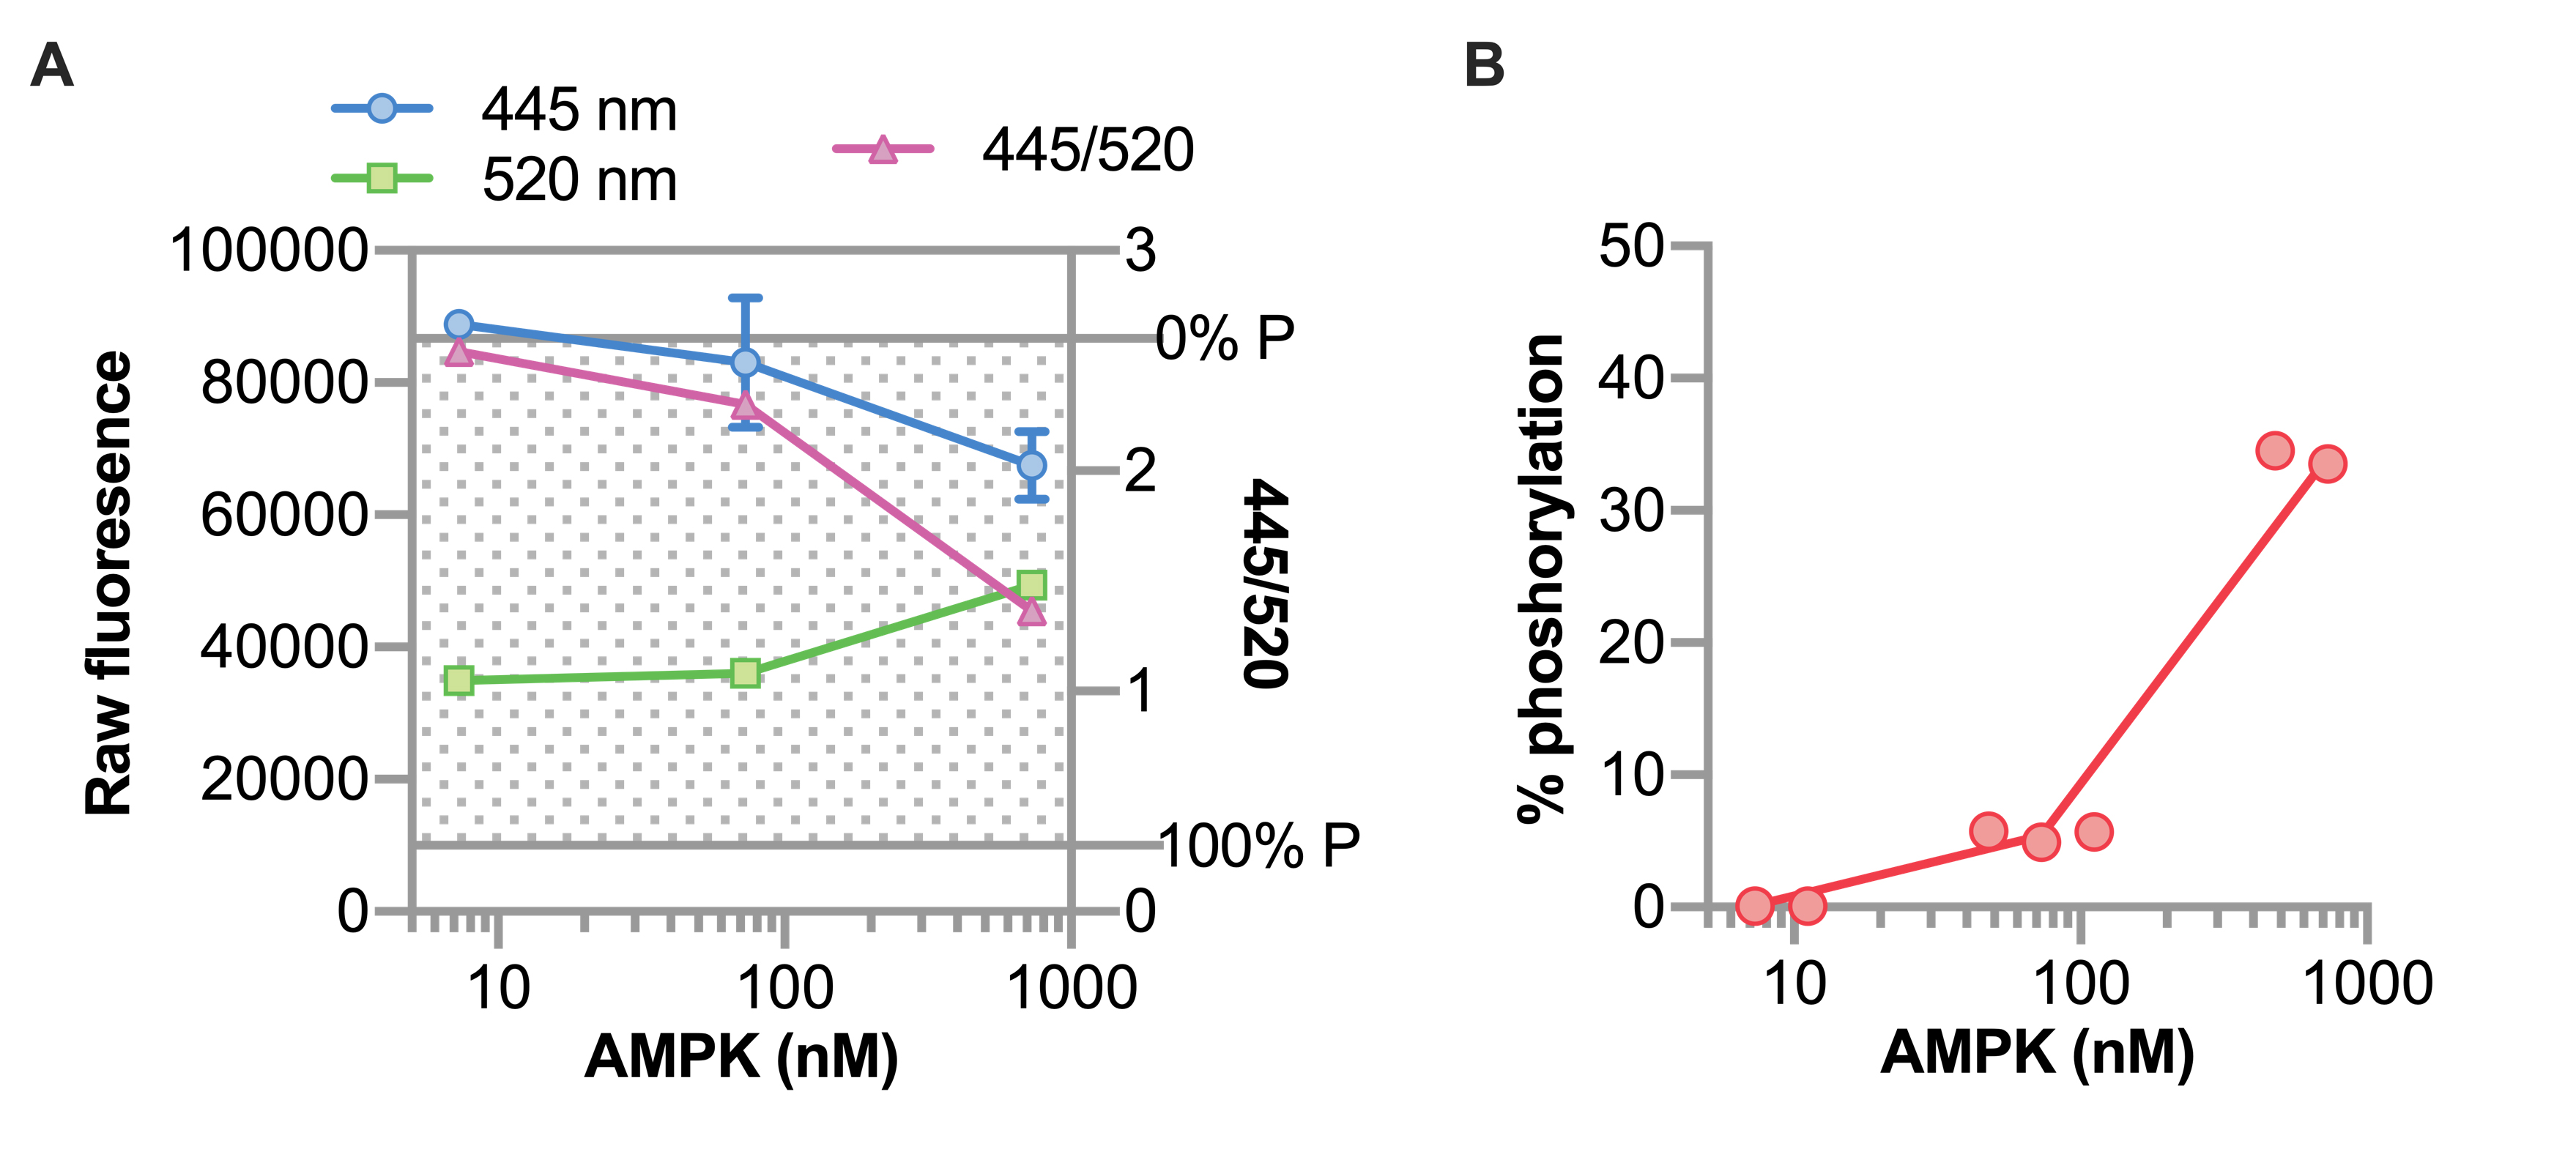
Figure 5. Data analysis of peptide phosphorylation. A. Raw fluorescence (left axis) and ratiometric values (right axis) of three concentrations of AMPK represented by a scatterplot and summarized by the mean ± 95% confidence interval of three replicate wells. The shaded region indicates the range of the assay, bounded by 0% phosphorylation and 100% phosphorylation controls. B. The calculated percent phosphorylation of peptide with increasing concentrations of AMPK represented by a scatterplot.
Next, use the equation to calculate the percent phosphorylation to the remainder of the wells and plot the percent phosphorylation versus the concentration of the compound of interest, per AMPK concentration (Figure 6A). In our example, we repeated the experiment at 730 nM AMPK two additional times, for a total of three independent runs, demonstrating the effect of the molecular chaperone CHIP on AMPK activity (Figure 6B). Four-parameter curve fitting can be used to generate dose-response curves and EC50 values to compare the effect of different compounds on AMPK. The effect of CHIP mutations on AMPK activity were previously described by comparing the EC50 values of each CHIP mutant (Shi et al., 2018).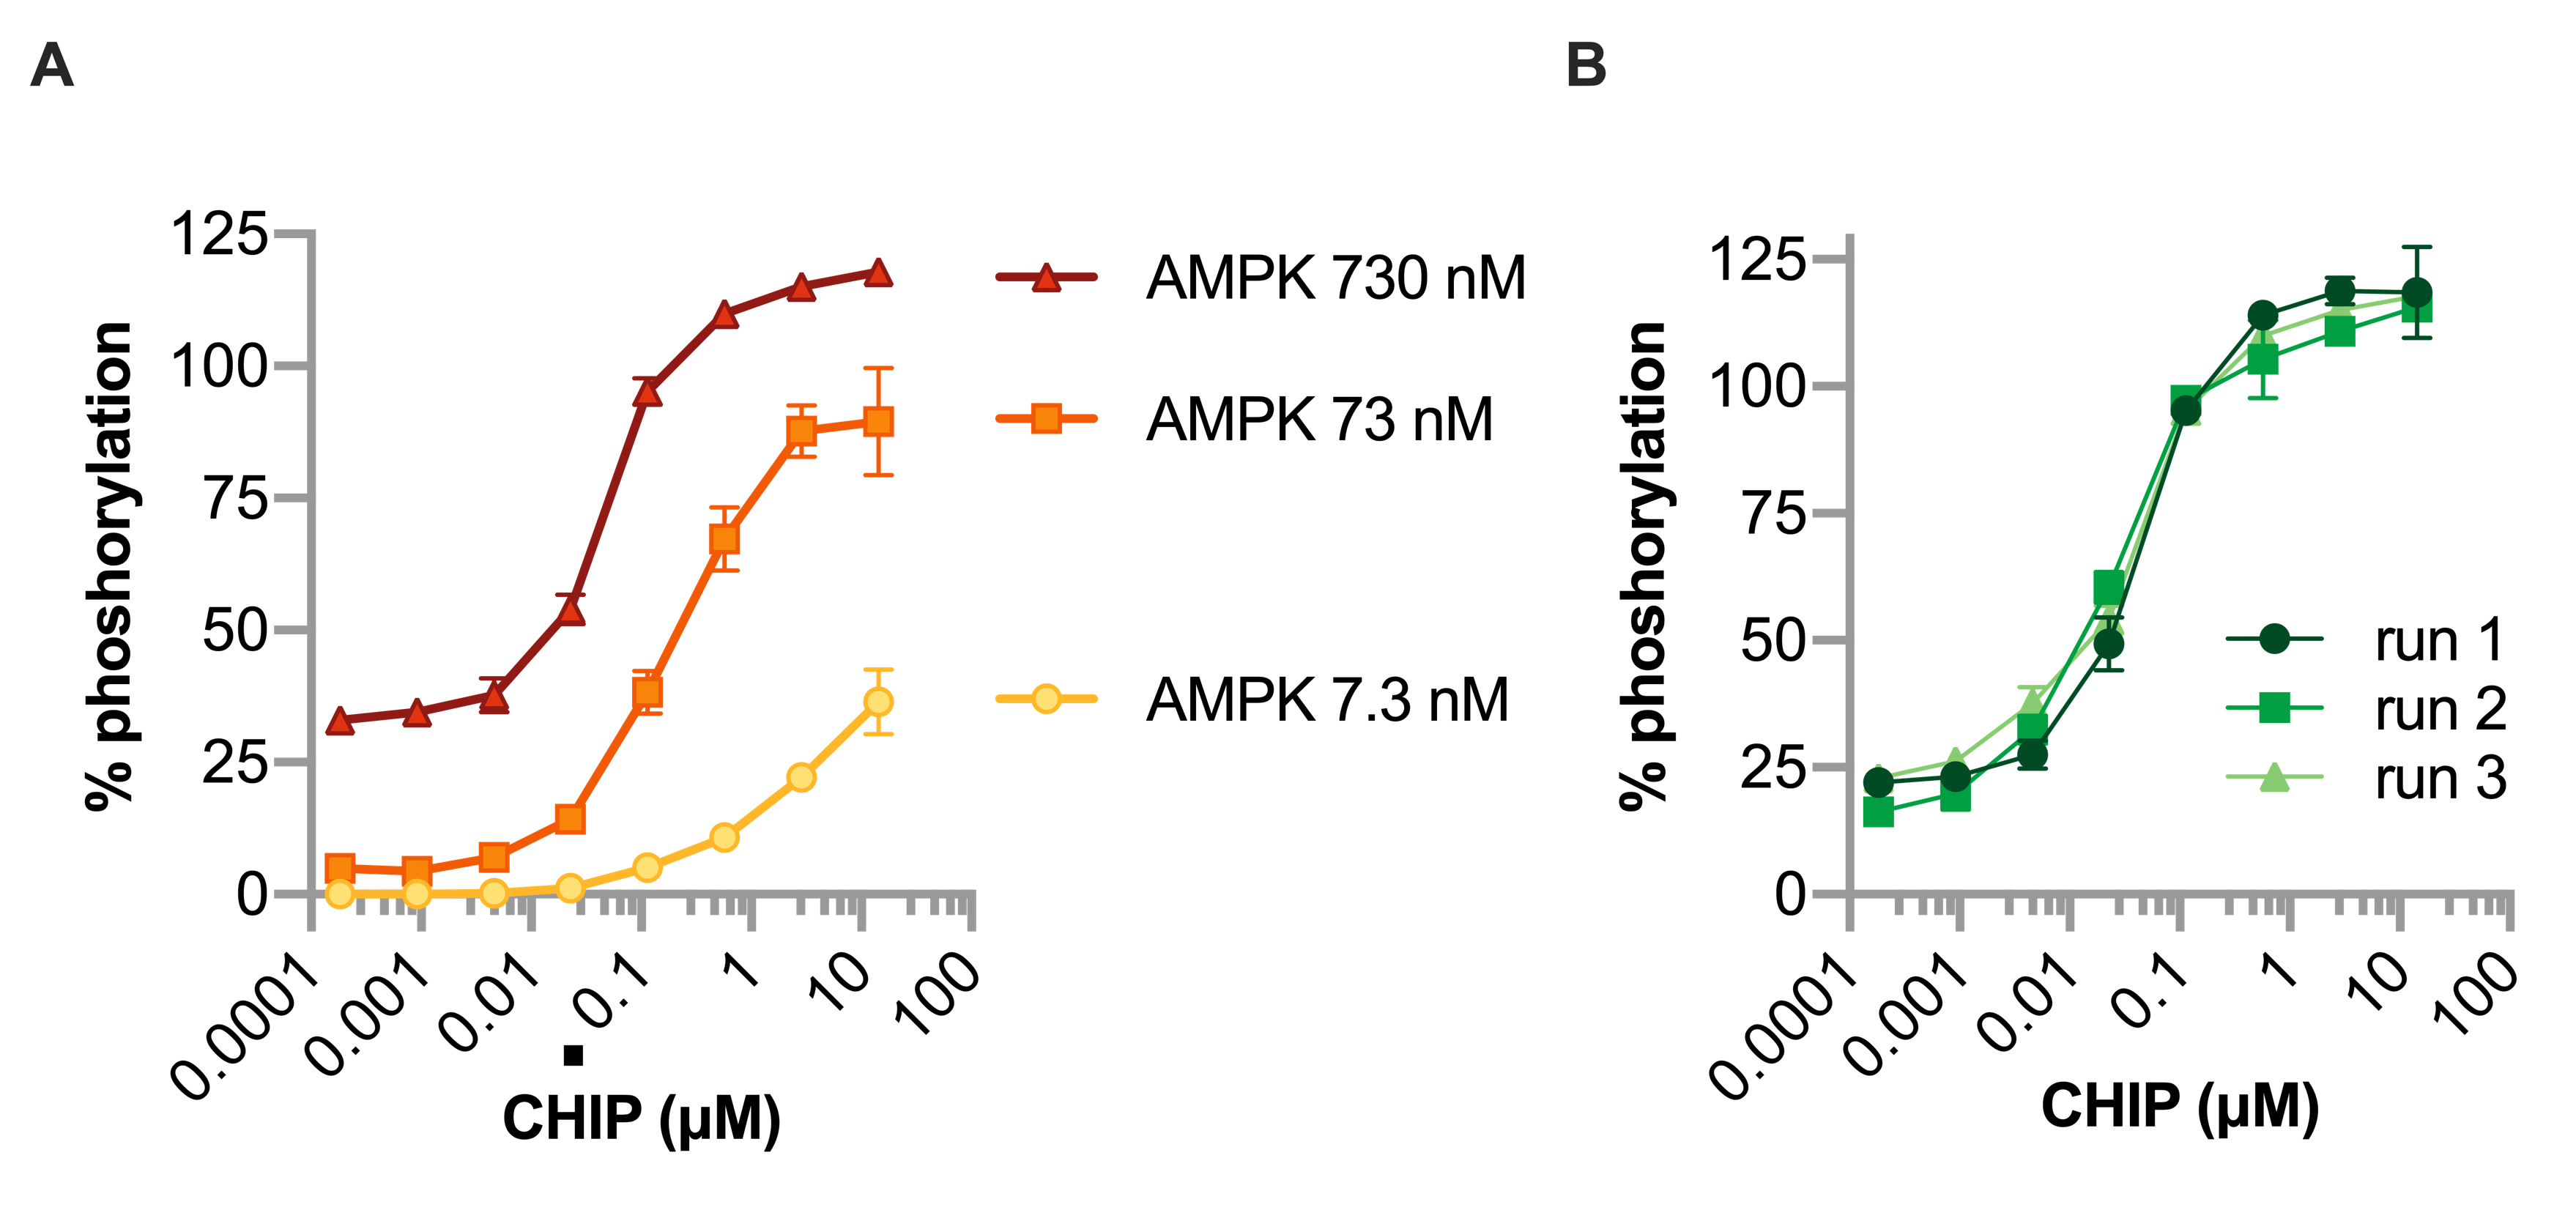
Figure 6. Dose response of AMPK and CHIP on peptide phosphorylation. A. The effect of increasing CHIP concentrations on AMPK activity measured by peptide phosphorylation using three different concentrations of AMPK, represented by a scatterplot and summarized by the mean ± 95% confidence interval of three replicate wells per condition. B. The effect of increasing CHIP concentrations on AMPK activity measured by peptide phosphorylation from three independent experiments, represented by a scatterplot and summarized by the mean ± 95% confidence interval of three replicate wells per condition.
Recipes
Note: All buffers should be filter sterilized (0.2 μm).
- HEPES storage buffer (10x)
200 mM HEPES (pH 7.4)
1.5 M NaCl - Kinase buffer A (10x)
500 mM HEPES (pH 7.4)
10 mM EGTA
0.1% Brij-35
100 mM MgCl2
Acknowledgments
Development of this protocol was supported by NIH grants R01-GM061728 and R37-HL065619. The funder had no role in the design, data collection and analysis, decision to publish, or preparation of the manuscript. We thank members of the Schisler Laboratory for critical review of the protocol and the McAllister Heart Institute administration team for their continued support. Additional data supporting this protocol was previously published (Shi et al., 2018).
Competing interests
There are no conflicts of interest or competing interest.
References
- Hastie, C. J., McLauchlan, H. J. and Cohen, P. (2006). Assay of protein kinases using radiolabeled ATP: a protocol. Nat Protoc 1(2): 968-971.
- Neumann, D., Woods, A., Carling, D., Wallimann, T. and Schlattner, U. (2003). Mammalian AMP-activated protein kinase: functional, heterotrimeric complexes by co-expression of subunits in Escherichia coli. Protein Expr Purif 30(2): 230-237.
- Ronnebaum, S. M., Patterson, C. and Schisler, J. C. (2014). Minireview: hey U(PS): metabolic and proteolytic homeostasis linked via AMPK and the ubiquitin proteasome system. Mol Endocrinol 28(10): 1602-1615.
- Ross, F. A., MacKintosh, C. and Hardie, D. G. (2016). AMP-activated protein kinase: a cellular energy sensor that comes in 12 flavours. FEBS J 283(16): 2987-3001.
- Schisler, J. C., Rubel, C. E., Zhang, C., Lockyer, P., Cyr, D. M. and Patterson, C. (2013). CHIP protects against cardiac pressure overload through regulation of AMPK. J Clin Invest 123(8): 3588-3599.
- Shi, C. H., Rubel, C., Soss, S. E., Sanchez-Hodge, R., Zhang, S., Madrigal, S. C., Ravi, S., McDonough, H., Page, R. C., Chazin, W. J., Patterson, C., Mao, C. Y., Willis, M. S., Luo, H. Y., Li, Y. S., Stevens, D. A., Tang, M. B., Du, P., Wang, Y. H., Hu, Z. W., Xu, Y. M. and Schisler, J. C. (2018). Disrupted structure and aberrant function of CHIP mediates the loss of motor and cognitive function in preclinical models of SCAR16. PLoS Genet 14(9): e1007664.
Article Information
Copyright
© 2019 The Authors; exclusive licensee Bio-protocol LLC.
How to cite
Wilson, E. B., Rubel, C. E. and Schisler, J. C. (2019). Non-radiometric Cell-free Assay to Measure the Effect of Molecular Chaperones on AMP-activated Kinase Activity. Bio-protocol 9(8): e3218. DOI: 10.21769/BioProtoc.3218.
Category
Biochemistry > Protein > Activity
Do you have any questions about this protocol?
Post your question to gather feedback from the community. We will also invite the authors of this article to respond.