- Protocols

- Articles and Issues
- For Authors
- About
- Become a Reviewer

Extracting and Integrating Protein Localization Changes from Multiple Image Screens of Yeast Cells

Published: Vol 8, Iss 18, Sep 20, 2018 DOI: 10.21769/BioProtoc.3022 Views: 5508
Reviewed by: Ajit ShahKalpa MehtaAnonymous reviewer(s)
Original research article
The authors used this protocol in:

Apr 2018
Advertisement


Protocol Collections
Comprehensive collections of detailed, peer-reviewed protocols focusing on specific topics


Related protocols
Abstract
The evaluation of protein localization changes in cells under diverse chemical and genetic perturbations is now possible due to the increasing quantity of screens that systematically image thousands of proteins in an organism. Integrating information from different screens provides valuable contextual information about the protein function. For example, proteins that change localization in response to many different stressful environmental perturbations may have different roles than those that only change in response to a few. We developed, to our knowledge, the first protocol that permits the quantitative comparison and clustering of protein localization changes across multiple screens. Our analysis allows for the exploratory analysis of proteins according to their pattern of localization changes across many different perturbations, potentially discovering new roles by association.
Keywords: ProteomicsBackground
Automated high-throughput microscopy technologies can now generate image datasets showing the expression and localization of the majority of the proteome in yeast cells (Mattiazzi Usaj et al., 2016). A key aim of these datasets is to identify and compare proteins that change localization in a chemical or genetic perturbation compared to an untreated wild-type baseline. Previous work has generally focused on identifying all localization changes for a single screen as accurately as possible (Tkach et al., 2012; Chong et al., 2015; Kraus et al., 2017), but has not provided a way to systematically compare these changes. In Lu et al. (2018), we showed that the pattern in which proteins change localization can be inferred by integrating information from microscopy images for each protein under different perturbations. By grouping together proteins with similar patterns of change across different perturbations, we better understand protein function. Here, we describe our protocol for extracting measurements about protein localization from images, comparing the differences between screens, and integrating data from different screens for cluster analysis. Our method is unsupervised and automatically infers proteomic changes from data (Lu and Moses, 2016), allowing it to scale to new datasets with no retraining of parameters.
Equipment
Hardware:
- Cluster server and screens
The Budding Yeast Morphologist software is compatible any system that has a GNU C++ compiler. We recommend 200 GB of hard drive space per image screen (each image screen contains ~4,000 images). To detect changes, at least two screens are needed. There is no upper limit, but we used 15 screens (60,000 images, 3 TB of disk space).
We used a cluster server with CentOS 7 with 208 CPU cores and 424 GB of RAM in total. - Dell Precision Tower 5810
The Protein Change Profile software is compatible with any computer with a Python 3.6 installation. We recommend at least 4 GB of RAM, and 2.5 GB of hard drive space per image screen.
We used a Dell Precision Tower 5810 with Windows 8.0 with 8 GB of RAM and an Intel Xeon E5-1620 3.50 GHz CPU.
Software
- C++ code and installation instructions
For segmenting yeast microscopy images into single cells and extracting biologically-motivated protein distribution features can be found in the Budding Yeast Morphologist repository: https://github.com/lfhandfield/Budding-Yeast-morphologist. - Python code
For averaging single cell features and unsupervised protein localization change detection can be found in the Protein Change Profile repository: https://github.com/alexxijielu/protein_change_profiles.
This code requires Python 3.6 (we recommend the Anaconda distribution: https://www.anaconda.com/download/). Required packages for the Protein Change Profile repository are listed in the README.md file. - Open source Cluster 3.0 software (de Hoon et al., 2004)
For clustering, we recommend the open source Cluster 3.0 software, available here: http://bonsai.hgc.jp/~mdehoon/software/cluster/software.htm. - Java Treeview (Saldanha, 2004)
For visualization, we recommend Java Treeview, available here: http://jtreeview.sourceforge.net/.
Procedure
- Installing the required software and unpackaging the data
- The Budding Yeast Morphologist code can be downloaded directly from GitHub>lfhandfield>Budding-Yeast-morphologist as a zip file, or cloned from the repository by using the command line:
git clone https://github.com/lfhandfield/Budding-Yeast-morphologist.git
This command will save a directory with the source code to your system. To install, use a make command with the directory’s path:
./make -C ./Budding-Yeast-morphologist/
The software will be installed in the ./Budding-Yeast-morphologist/bin/ folder. - The Protein Change Profile code can be downloaded directly from Github> alexxijielu/protein_change_profiles as a zip file, or cloned from the repository by using the command line:
git clone https://github.com/alexxijielu/protein_change_profiles.git
No installation is needed. The code is in the protein_change_profiles directory, and can be run directly through Python. - Data
Note: The image screens we will use as examples in this protocol are named after their abbreviations in the CYCLoPS database. Information about the strains and experimental conditions used in these screens can be found here.- Raw image data (Koh et al., 2015) are available at http://142.150.215.41/image_screens/.
Note that these screens are ~85 GB each. Each screen is divided into 20 zip files. The images are 8-channel tiff files, with each file named after and corresponding to a GFP-tagged protein. Each file contains 4 fields-of-view of 2 fluorescent channels, one of a cytosolic RFP, and one of the GFP-tagged protein. Image channels 2, 4, 6, 8 are RFP, with channels 1, 3, 5, 7 corresponding to their respective GFP. Images in this screen were acquired using a high-throughput spinning-disk microscope with a water-immersion 60x objective (NA 1.2, image depth 0.6 μm and lateral resolution 0.28 μm). For further information on strain construction, filter sets, and imaging, refer to Chong et al. (2015). - Zip files of pre-extracted single-cell features for all screens are available at: http://142.150.215.41/single_cell_features/.
Each tab-delimited file is named after and corresponds to a GFP-tagged protein, and contains all single cell features for that given protein, extracted by the Budding Yeast Morphologist software. - To unzip the provided data, you can use the following command line:
unzip <zip file> -d <directory to unzip to>
For example:
unzip ./WT2_0.zip -d ./WT2/
- Raw image data (Koh et al., 2015) are available at http://142.150.215.41/image_screens/.
- The Budding Yeast Morphologist code can be downloaded directly from GitHub>lfhandfield>Budding-Yeast-morphologist as a zip file, or cloned from the repository by using the command line:
- Segment and extract single cell features from the raw images
Note: Segmenting and extracting features from raw images is computationally time-consuming. Moreover, the datasets are large. For convenience, we also provide pre-extracted single-cell features that have been calculated using the procedure in this step. If working from these features instead of the raw images, skip to the next step.- We segmented raw images into single cells, and calculated several measures of protein distribution (as described in Handfield et al., 2013) for each cell. To be included for analysis, each set of images for a protein tag must have at least 1 cell in 5 discrete cell cycle stages; we recommend at least 20 cells per set of images to meet this requirement. Images must be provided as .tiff files. An example of a raw image is shown in Figure 1 (i).
- An example of how to segment and extract features from a single image is provided in /example/example.sh in the Budding Yeast Morphologist directory. The time it takes to segment an image will depend on the number of cells in the image and how clumped they are, but in general, an image will take 1-5 min to process.
For convenience, we have provided a Python script to batch this pipeline over every .tif file in a directory, as batch_segmentation.py in the Protein Change Profile repository. Note that this script assumes the 8 channel convention for the images (as described in the Data section) and may need modifications if the user’s images are in a different format. To run this script use:
python batch_segmentation.py <directory of tif files to analyze> <location of the bin folder for the Budding Yeast Morphologist software>
For example:
python batch_segmentation.py ./WT2/ /Budding-Yeast-morphologist/bin/
This script will output two files for each image in the input directory: a tab-delimited .txt file containing the single cell features (used for Procedure B), and a _preview.tiff file that overlays the segmentation results onto the images. Simplified examples of the segmentation preview and tab-delimited text single cell feature files are shown in Figure 1 (ii) and Figure 1 (iii). - An example of a single cell feature file extracted by this step can be found in the Protein Change Profile repository in the examples folder as example_single_cell_features.txt. The columns in this file are extracted features, while the rows each correspond to a single cell. These features will be automatically post-processed in the next step. You should have a single cell feature file for each protein.
Note: It is assumed that each single cell feature file contains all single cells for a protein. The file names of the single cell features will be used to automatically pair proteins in subsequent steps, so ensure that the naming convention for files is consistent from screen to screen, with files that should be paired named identically between screens (we recommend naming the files after the protein name to facilitate interpretation of output).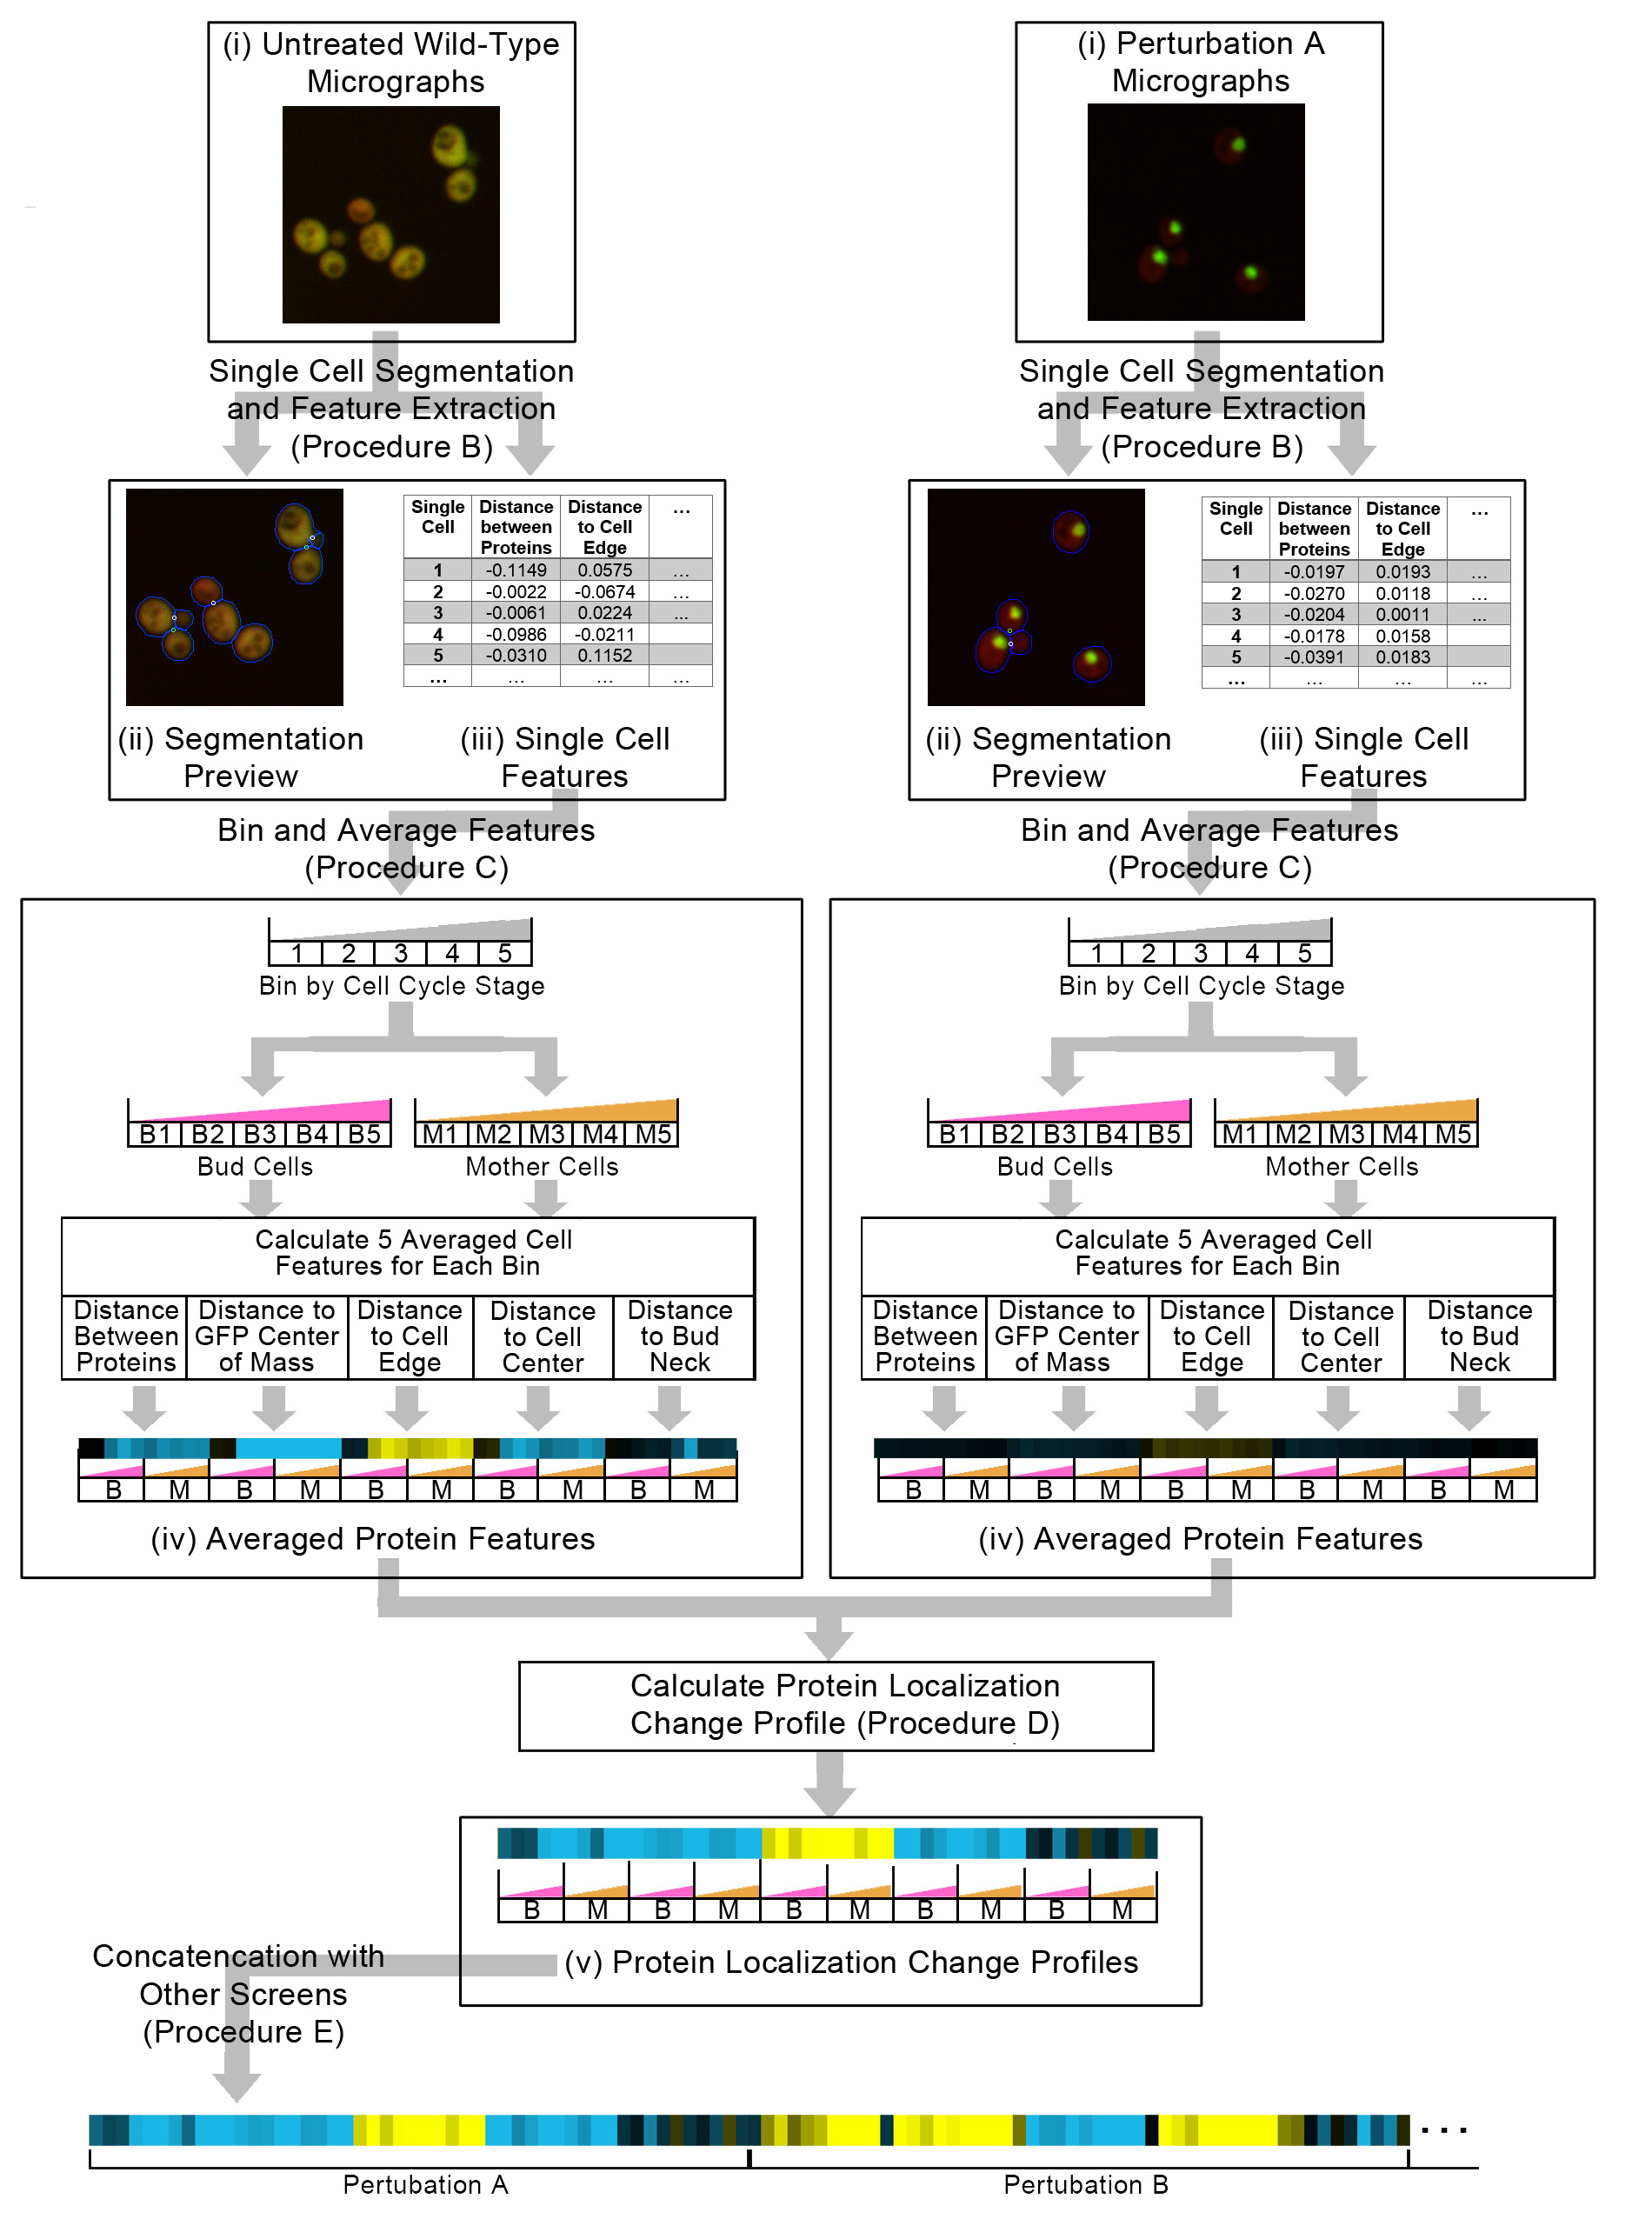
Figure 1. A schematic overview of Procedure B to E in the protocol. We start with raw image files (i), where the GFP channel is shown as green and the RFP channel shown as red. We use our single cell segmentation and feature extraction software to generate segmented micrographs (ii), with single cells segmentations shown as blue lines, and single cell features (iii). The single cell features are binned and averaged into protein features (iv), that are then used to calculate the protein localization change profile (v) between an untreated wild-type and a perturbation. Finally, to integrate protein change profiles from different screens, we concatenate protein change profiles together. We visualize the features of the averaged protein features and the protein localization change profiles as a heat map in this schematic, with positive features being yellow and negative features being blue, and each bar in the heat map corresponding to a feature.
- Bin and average the single cell features for each protein
- Because we are interested in localization changes as properties of proteins, we use single-cell information to construct summary statistics for each protein.
- For each screen, copy the tab-delimited single cell feature files into a separate directory. If you are working from the pre-extracted single-cell features, this has already been done for you. Otherwise, you can use the following command lines:
- Make a directory to hold all the feature files:
mkdir <directory name>
For example:
mkdir ./WT2_features/ - Copy all of the .txt files from the analyzed folder of .tif files to the directory:
cp -r <directory of analyzed tif files>/*.txt <directory to copy .txt files into>
For example:
cp -r ./WT2/*.txt ./WT2_features/
- Make a directory to hold all the feature files:
- Run average_single_cells.py in the Protein Change Profile repository as follows:
python average_single_cells.py <directory of feature files> <output file>
For example:
python
average_single_cells.py ./WT2_features/ ./WT2_averaged_features.txt
average_single_cells.py will bin cells into 10 bins by mother/bud cell type and by cell cycle stage, and then calculate the truncated mean over each bin, trimming 5% of the distribution from both tails. We trim the distributions to make the means more robust to outlier cells. - Examples of averaged feature files can be found in the examples directory of the Protein Change Profile repository. Averaged features for the WT2, ALP3, and RAP3 screens can be found as WT2_averaged_features.txt, ALP3_averaged_features.txt, and RAP3_averaged_features.txt, respectively.
Each row in this file corresponds to a protein. The features (described in Handfield et al., 2013) are the columns, and are abbreviated as such in the headers of the tab-delimited output file:
SEF: Average distance between proteins
MCT: Average distance of proteins to the protein mass center
EDG: Average distance of proteins to the cell periphery
CEN: Average distance of proteins to the cell center
NEC: Average distance of proteins to the bud neck
B: Bud cells
M: Mother cells
0-4: Cell cycle stage, estimated using bud size as a heuristic; 0 is the earliest stage, while 4 is the latest stage.
- Calculate the protein localization change profile between each perturbation and an untreated wild-type screen
- The image features may not be directly comparable due to systematic biases and technical differences between screens. To correct for these effects, we use a locally adaptive k-nearest neighbor unsupervised localization change detection described in Lu and Moses (2016).This step will output protein localization change profiles, which represent the expectation of protein localization change for each protein between the two image screens. The protein localization change profiles consist of a z-score for each feature, describing the direction and magnitude by which each feature deviates from the expectation of there being no localization change.
- Using the averaged features from Procedure C, run calculate_protein_change_profiles.py in the Protein Change Profile repository as follows:
python calculate_protein_change_profiles.py <file for untreated wild-type screen> <file for perturbation screen> <output file>
For example:
python
calculate_protein_change_profiles.py ./WT2_averaged_features.txt ./ALP3_average_features.txt ./ALP3_change.txt
calculate_protein_change_profiles.py will automatically filter the input feature files to include proteins present in both screens, and perform unsupervised localization change detection. By default, the parameter k is set to 50, as set in Lu et al., 2018. This parameter controls the number of neighbors to use in determining if the difference between the features for each protein deviates from expectation or not. In our experiments, we found this number to be robust, so it should not need much fine-tuning.
To adjust k, pass an integer as an additional parameter:
python calculate_protein_change_profiles.py <file for untreated wild-type screen> <file for perturbation screen> --k <k>
For example:
python
calculate_protein_change_profiles.py ./WT2_averaged_features.txt ./ALP3_averaged_features.txt ./ALP3_change.txt --k 100 - Examples of protein localization change profile files for the RAP3 and ALP3 screens relative to the WT2 screen can be found in the examples directory of the Protein Change Profile repository, as RAP3_change.txt and ALP3_change.txt, respectively. Each row in these files is a protein, and each column is a feature, corresponding to the features introduced in Procedure C.
Note: The unsupervised localization change detection algorithm uses the Euclidean distance, and is sensitive to feature scaling. Our features are all scaled similarly, so we did not need to normalize them before applying this step. If you are using a different feature set, you may need to pre-process your data.
- Concatenate the protein change profiles for different perturbations together
- We integrate different screens together, so that we can consider the localization changes for proteins across multiple screens simultaneously. Note that we consider each replicate as a different screen in this protocol; we found that this facilitates clustering and interpretation, because if one replicate does not exhibit a consistent localization change, the effect will be apparent from replicates having different protein localization change profiles.
- Using the protein localization change profiles calculated in Procedure D, and a master list of all proteins studied in all screens (for our screens, this is available as protein_list.txt in the Protein Change Profile repository), protein localization change profiles for different screens can be concatenated using concatenate_profiles.py as follows:
python concatenate_profiles.py -files <list of protein localization change profile files> -output <output file> -reference <master list of all proteins>
For example:
python concatenate_profiles.py -files ./ALP3_change.txt ./RAP3_change.txt -output ./concatencated_changes.txt -reference ./protein_list.txt - An example of a concatenated profile file can be found as ./concatenated_changes.txt in the examples directory of the Protein Change Profile repository. Note that if a protein does not appear in the protein localization change profiles of a screen (which may occur because the protein has been filtered out due to insufficient data), then the values of the features for that screen will be recorded as ‘nan’ (not an integer) in the file.
- Cluster the concatenated protein change profiles
- The clustering step will group proteins with similar protein localization change profiles together. While numerous options exist, we demonstrate how to use the Cluster 3.0 software here, which we chose due to its simple graphical interface.
- Open the concatenated protein change profile file generated by Procedure E in Cluster 3.0 by selecting File > Open Data File.
- Preprocess the data in the “Filter Data” tab (Figure 2A):
- “% Present >=” will filter proteins with too much missing data (i.e., proteins with ‘nan’ values from the previous step), and should be selected as these proteins may adversely affect the clustering results. We suggest a value of 80.
- “At least _ observation with abs(Val) >= _” will filter out proteins with very little signal in their protein localization change profiles. This filter is optional, but can improve the visualization by excluding proteins not predicted to change in any of the screens. The values will depend on how many screens incorporated, but we suggest at least 2 observations and an abs(Val) >= 4.0.
- Clicking “Apply Filter” will show the number of proteins after filtering. To proceed, click “Accept Filter”.
- Perform Hierarchical Clustering (Figure 2B):
- Click on the “Hierarchical” tab.
- In the “Genes” section, check “Cluster”. We suggest using “Correlation (uncentered) under “Similarity Metric”.
- To perform clustering, select a “Clustering Method”. We suggest “Average Linkage”.
- The clustered file will be saved in the same location as your original input, as a cdt file.
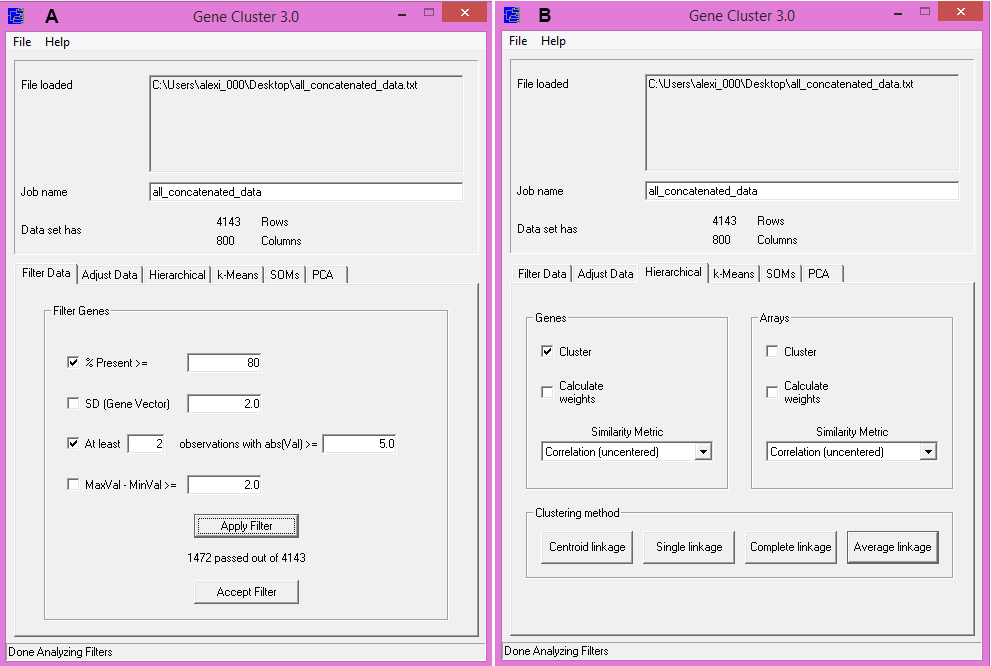
Figure 2. Clustering in Cluster 3.0. A. Options for data preprocessing steps. B. Options for performing hierarchical clustering.
- Visualize the cluster results as a heat map
- We use the Java Treeview software to visualize the clustered heat maps generated by Cluster 3.0.
- Open the cdt file generated in Procedure F by selecting File → Open.
- Display settings can be configured in Settings → Pixel Settings. Here, the color scheme, contrast, and scale of the heat map can be set. We recommend setting the contrast to at least 5.0 to visualize the range of our features.
- Figure 3 shows clustering results for the example concatenated profile file, provided as ./concatenated_changes.txt in the examples directory of the Protein Change Profile repository, and pre-processed following the steps and recommended parameters in Procedure F. Clusters can be selected by clicking on the dendogram in the left-most panel of the Java Treeview window; the proteins involved in these clusters can be seen in the list on the right-most panel.
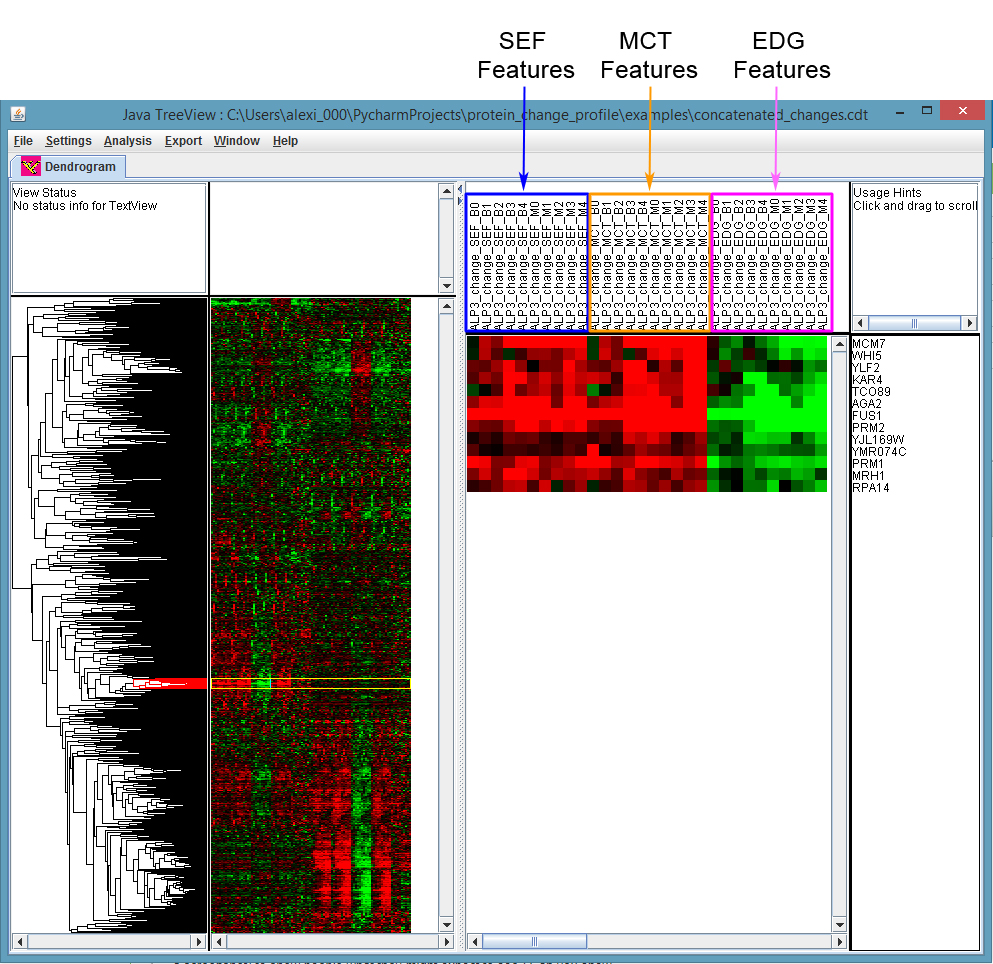
Figure 3. Visualizing the results of clustering with Java Treeview. We have selected a cluster of protein change profiles with strong signal in the ALP3 screen (left-most panel). The proteins inside of this cluster can be seen in the right-most panel. By default, Java Treeview will show negative values in green and positive values in red (these settings can be configured under Settings > Pixel Settings). According to this scheme, this cluster for the ALP3 screen has strongly positive values for the “average distance between proteins” (SEF) and “average distance to protein mass center” (MCT) features, and strongly negative values for the “average distance to cell edge” (EDG) features (feature headers have been highlighted in the middle panel), suggesting that these proteins are moving further away from the cell edge and becoming denser in protein distribution in the ALP3 screen.
Data analysis
We refer to Lu et al. (2018) for details and procedures for the specific downstream analyses that we conducted on the clusters obtained from this data. As a high-throughput method, there are points in the protocol in which false positives and negatives may arise; we refer users to the discussion section of Lu et al. (2018) for an overview of these, as well as best practices on how to interpret our output.
Acknowledgments
This work was funded by the National Science and Engineering Research Council, Canada Research Chairs, Canada Foundation for Innovation, Canadian Institutes of Health Research, and Canadian Institute for Advanced Research.
Competing interests
The authors declare no competing interests.
References
- Chong, Y. T., Koh, J. L., Friesen, H., Duffy, S. K., Cox, M. J., Moses, A., Moffat, J., Boone, C. and Andrews, B. J. (2015). Yeast proteome dynamics from single cell imaging and automated analysis. Cell 161(6): 1413-1424.
- de Hoon, M. J., Imoto, S., Nolan, J. and Miyano, S. (2004). Open source clustering software. Bioinformatics 20(9): 1453-1454.
- Handfield, L. F., Chong, Y. T., Simmons, J., Andrews, B. J. and Moses, A. M. (2013). Unsupervised clustering of subcellular protein expression patterns in high-throughput microscopy images reveals protein complexes and functional relationships between proteins. PLoS Comput Biol 9(6): e1003085.
- Koh, J. L., Chong, Y. T., Friesen, H., Moses, A., Boone, C., Andrews, B. J. and Moffat, J. (2015). CYCLoPs: A comprehensive database constructed from automated analysis of protein abundance and subcellular localization patterns in Saccharomyces cerevisiae. G3 (Bethesda) 5(6): 1223-1232.
- Kraus, O. Z., Grys, B. T., Ba, J., Chong, Y., Frey, B. J., Boone, C. and Andrews, B. J. (2017). Automated analysis of high-content microscopy data with deep learning. Mol Syst Biol 13(4): 924.
- Lu, A. X., Chong, Y. T., Hsu, I. S., Strome, B., Handfield, L. F., Kraus, O., Andrews, B. J. and Moses, A. M. (2018). Integrating images from multiple microscopy screens reveals diverse patterns of change in the subcellular localization of proteins. ELife 7: e31872.
- Lu, A. X. and Moses, A. M. (2016). An unsupervised kNN method to systematically detect changes in protein localization in high-throughput microscopy images. PLoS One 11(7): e0158712.
- Mattiazzi Usaj, M., Styles, E. B., Verster, A. J., Friesen, H., Boone, C. and Andrews, B. J. (2016). High-content screening for quantitative cell biology. Trends Cell Biol 26(8): 598-611.
- Saldanha, A. J. (2004). Java Treeview--extensible visualization of microarray data. Bioinformatics 20(17): 3246-3248.
- Tkach, J. M., Yimit, A., Lee, A. Y., Riffle, M., Costanzo, M., Jaschob, D., Hendry, J. A., Ou, J., Moffat, J., Boone, C., Davis, T. N., Nislow, C. and Brown, G. W. (2012). Dissecting DNA damage response pathways by analysing protein localization and abundance changes during DNA replication stress. Nat Cell Biol 14(9): 966-976.
Article Information
Copyright
![]() Lu et al. This article is distributed under the terms of the Creative Commons Attribution License (CC BY 4.0).
Lu et al. This article is distributed under the terms of the Creative Commons Attribution License (CC BY 4.0).
How to cite
Readers should cite both the Bio-protocol article and the original research article where this protocol was used:
- Lu, A. X., Handfield, L. and Moses, A. M. (2018). Extracting and Integrating Protein Localization Changes from Multiple Image Screens of Yeast Cells. Bio-protocol 8(18): e3022. DOI: 10.21769/BioProtoc.3022.
- Lu, A. X., Chong, Y. T., Hsu, I. S., Strome, B., Handfield, L. F., Kraus, O., Andrews, B. J. and Moses, A. M. (2018). Integrating images from multiple microscopy screens reveals diverse patterns of change in the subcellular localization of proteins. ELife 7: e31872.
Category
Cell Biology > Cell imaging > Fluorescence
Microbiology > Microbial cell biology > Cell imaging
Do you have any questions about this protocol?
Post your question to gather feedback from the community. We will also invite the authors of this article to respond.