- Protocols

- Articles and Issues
- For Authors
- About
- Become a Reviewer

Isolation and Detection of the Chlorophyll Catabolite Hydroxylating Activity from Capsicum annuum Chromoplasts
Published: Vol 7, Iss 18, Sep 20, 2017 DOI: 10.21769/BioProtoc.2561 Views: 8838
Reviewed by: Marisa RosaMohan TCWenrong He
Original research article
The authors used this protocol in:
Oct 2016
Advertisement


Protocol Collections
Comprehensive collections of detailed, peer-reviewed protocols focusing on specific topics


Abstract
Hydroxylation of chlorophyll catabolites at the so-called C32 position (Hauenstein et al., 2016) is commonly found in all plant species analyzed to date. Here we describe an in vitro hydroxylation assay using Capsicum annuum chromoplast membranes as a source of the hydroxylating activity, which converts the substrate epi-pFCC (epi-primary Fluorescent Chlorophyll Catabolite) (Mühlecker et al., 2000) to epi-pFCC-OH.
Keywords: TIC55 (Translocon at the inner chloroplast membrane 55 kDa)Background
During leaf senescence and fruit ripening, light-absorbing chlorophylls are degraded to non-fluorescent catabolites to prevent oxidative damage. The chlorophyll breakdown pathway (PAO/phyllobilin pathway) consists of consecutive steps catalyzed by several enzymes and the final degradation products, called phyllobilins, are ultimately stored in the vacuole (Kräutler, 2016). epi-primary Fluorescent Chlorophyll Catabolite (epi-pFCC) is the first non-phototoxic intermediate. After its formation in the chloroplast, side-chain modifications of epi-pFCC can occur, most of which take place outside the chloroplast. One of these modifications, however, is the hydroxylation of the C32 position (Figure 1) catalyzed by the inner chloroplast envelope enzyme TIC55, a member of the family of ferredoxin (Fd)-dependent non-heme oxygenases. TIC55 contains a Rieske and a mononuclear iron-binding domain and was shown to require a Fd reducing system as well as molecular oxygen for its hydroxylating activity. Here we describe an in vitro enzyme assay for TIC55, which was used to characterize the epi-pFCC hydroxylating enzyme activity from red pepper chromoplasts.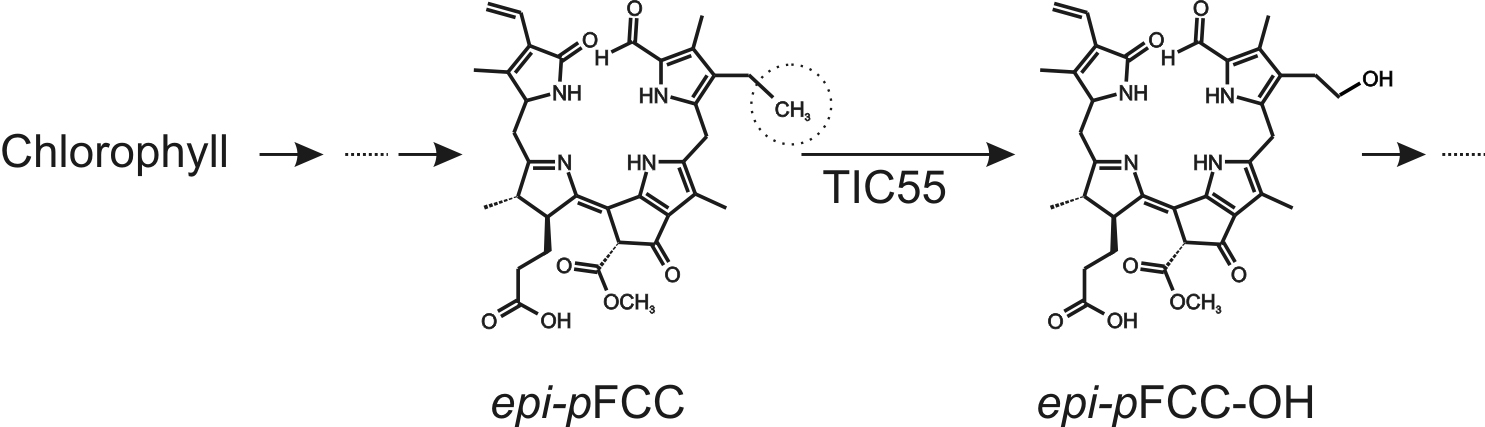
Figure 1. Outline of the pathway of chlorophyll breakdown, highlighting the TIC55-catalyzed reaction from epi-pFCC to epi-pFCC-OH. The circle shows the C32 position, the site of hydroxylation.
Materials and Reagents
- Pipette tips (SARSTEDT)
- 2 ml SafeSeal micro tubes, PP (SARSTEDT, catalog number: 72.695.500 )
- Miracloth (pore size 22-25 µm) (Merck)
- 10 ml syringe with 0.6 mm needle
- Watercolor paint brush, number 10 (for example: FILA, Giotto brush art series 400)
- Fully ripe red-colored Capsicum annuum fruits, from local supermarket
- Sucrose (AppliChem, catalog number: A2211,500 0)
- Tris(hydroxymethyl)aminomethane (Tris) (Carl Roth, catalog number: AE15.3 )
- 2-(N-morpholino)ethanesulfonic acid (MES) (AppliChem, catalog number: A1074.1000 )
- Ethylenediaminetetraacetic acid disodium salt dihydrate (EDTA) (AppliChem, catalog number: A2937.1000 )
- Polyethylene glycol 4000 (PEG 4000) (Sigma-Aldrich, catalog number: 81240 )
- 1,4-Dithiothreitol (DTT) (Carl Roth, catalog number: 6908.3 )
- (+)-Sodium L-ascorbate (Vitamin C) (Sigma-Aldrich, catalog number: A4034 )
- Ferredoxin-NADP+ reductase (FNR) (Sigma-Aldrich, catalog number: F0628 )
- Ferredoxin (Fd) (Sigma-Aldrich, catalog number: F3013 )
- β-Nicotinamide adenine dinucleotide 2’-phosphate reduced tetrasodium salt hydrate (NADPH) (AppliChem, catalog number: A1395 )
- Glucose-6-phosphate dehydrogenase (GDH) (Sigma-Aldrich, catalog number: G8404 )
- Glucose-6-phosphate (Glc6P) (Sigma-Aldrich, catalog number: G7879 )
- Epi-primary fluorescent chlorophyll catabolite (epi-pFCC) (according to Mühlecker et al., 2000)
- Methanol, HPLC grade (Sigma-Aldrich, catalog number: 34860 )
- Chromoplast isolation buffer (for composition, see Recipes)
- Tris MES pH 8 buffer (for composition, see Recipes)
Equipment
- Pipettes (Gilson)
- Fruit juicer (Vitality 4 Life, model: Oscar Vitalmax 900 ) or Sorvall mixer
- Microcentrifuge: Biofuge fresco (Heraeus, model: Biofuge fresco )
- Centrifuge: Avanti J-20 XPi (Beckman Coulter, model: Avanti® J-XN 26 ); Rotors: JLA-10.500 (Beckman Coulter, model: JLA-10.500 with 500 ml polypropylene bottles) and JA-25.50 (Beckman Coulter, model: JA-25.50 with 50 ml polypropylene tubes)
- Ultracentrifuge: Optima LE-80K (Beckman Coulter, model: OptimaTM LE-80K ); Rotor: SW-41Ti (Beckman Coulter, model: SW 41 Ti with 13.2 ml polyallomer tubes)
- -80 °C freezer (Thermo Fisher Scientific, Thermo ScientificTM, model: HERAfreezeTM HFU 586 Top )
- LC-MS/MS: Ultimate3000-Compact (Thermo Fisher Scientific, Thermo ScientificTM, model: UltiMate 3000 ; Bruker Daltonics, model: Compact )
Procedure
- Chromoplast protein isolation from Capsicum annuum
- Collect 300 g of exocarp (with some mesocarp) from red pepper fruits (Capsicum annuum).
For this, cut the pepper fruit in strips lengthwise (Figures 2A-2D). Now cut off most of the mesocarp tissue and collect the outer exocarp (Figure 2E). Cut the exocarp (Figure 2F) in smaller pieces to facilitate grinding.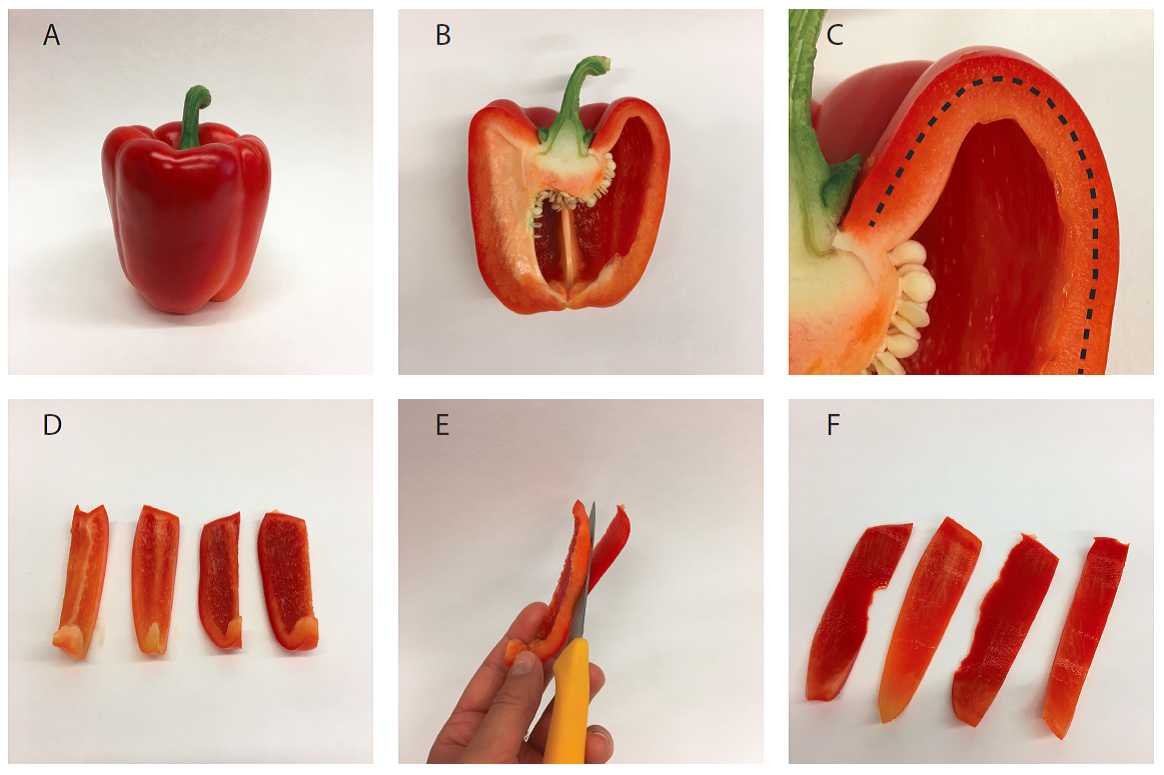
Figure 2. Isolation of pepper fruit mesocarp tissue. A. Entire fruit; B. Halved fruit; C. Detail of B showing exocarp (outside the dotted line) and mesocarp (inside the dotted line); D. Sliced pepper fruit; E. Separation of exocarp from mesocarp with a knife; F. Isolated exocarp. - Blend the exocarp with 400 ml of cold (4 °C) chromoplast isolation buffer (see Recipes) in a fruit juicer or Sorvall mixer, with lowest setting and for three 10 sec-pulses in the Sorvall mixer, or for 30 sec in the fruit juicer. After blending, the tissue should be entirely disintegrated. Avoid warming up of the extract.
- Filter the extract through two layers of miracloth placed in a glass funnel into the 500 ml polypropylene bottles for centrifugation.
- Centrifuge for 10 min, 12,000 x g at 4 °C ( JLA-10.500 rotor).
- Discard supernatant by pouring it into the waste. Do this step quickly since the pellet is not very stable.
- Carefully resuspend the pellet in 100 ml chromoplast isolation buffer using fine strokes of a paint brush.
- Centrifuge for 10 min, 12,000 x g at 4 °C ( JLA-10.500 rotor).
- Resuspend the pellet in 8 ml of 25 mM Tris-MES (see Recipes) pH 8, this time without the paint brush, but by pipetting the solution up and down.
- Transfer to 50 ml polypropylene tubes by pipetting.
- Break chromoplasts by pressing them 10 times through a syringe with a 0.6 mm needle. For this, the solution is sucked-in and pushed-out through the 0.6 mm needle using a 10 ml syringe. Avoid sucking of air.
- Centrifuge for 10 min, 15,000 x g at 4 °C ( JA-25.50 rotor).
- Transfer the supernatant to 13.2 ml allomer tubes by pipetting.
- Fractionate in a soluble and membrane fraction by ultra-centrifugation for 1 h, 150,000 x g at 4 °C (SW-41Ti rotor).
- Resuspend the obtained membrane pellet in 8 ml of 25 mM Tris-MES pH 8 and push 10 times through a syringe with a 0.6 mm needle as above.
- Chromoplast membranes can now be used for hydroxylation assays or can be stored for later use at -80 °C.
- Freeze aliquots of 1-2 ml of the Chromoplast membranes in liquid nitrogen and store at -80 °C.
- Collect 300 g of exocarp (with some mesocarp) from red pepper fruits (Capsicum annuum).
- Hydroxylation assay
- Mix all compounds on ice in a 2 ml tube except for the substrate (epi-pFCC) according to the following:
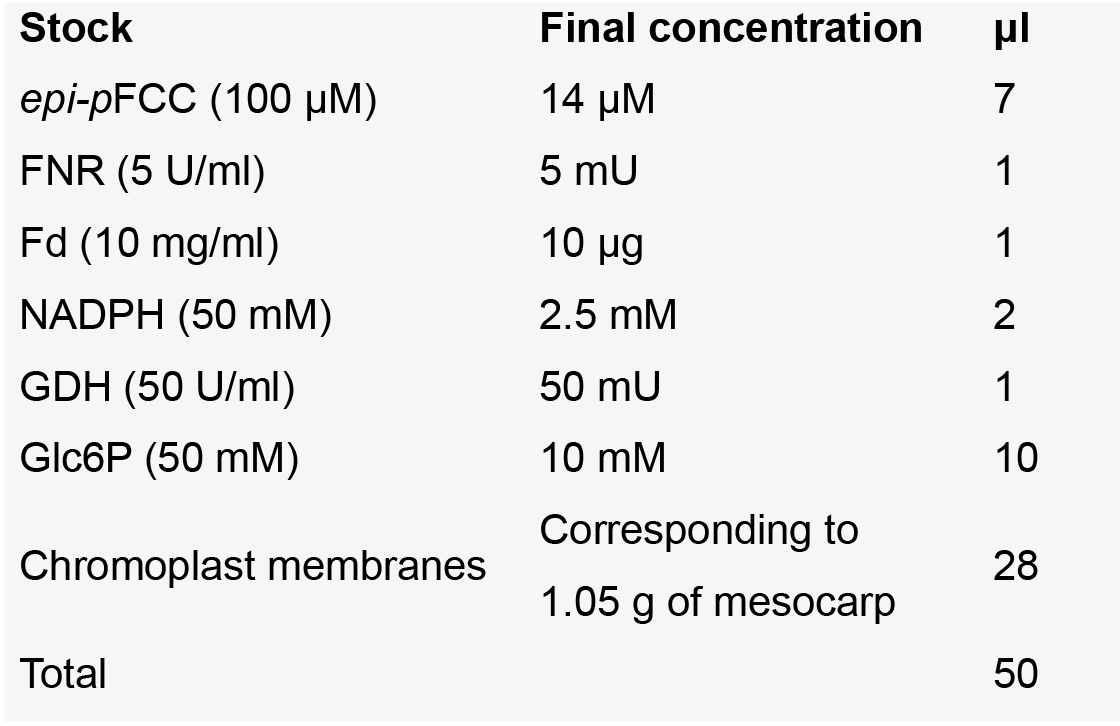
- Start enzyme assay by adding the substrate to the mix from above.
- Incubate at room temperature in darkness for up to 40 min.
- Terminate the reaction by adding 50 µl of methanol.
- Centrifuge for 2 min, 16,000 x g at 4 °C (Biofuge).
- Transfer supernatant to a new tube by pipetting (avoid transferring particles from the pellet).
- Repeat centrifugation to get rid of any particles, which could block the HPLC or LC-MS/MS tubing.
- Analyze supernatant of the samples by HPLC or by LC-MS/MS for formation of epi-pFCC-OH (Hauenstein et al., 2016).
- Mix all compounds on ice in a 2 ml tube except for the substrate (epi-pFCC) according to the following:
Data analysis
Data was analyzed by LC-MS/MS as described (Christ et al., 2016). Figure 3 shows an example of the time-dependent formation of epi-pFCC-OH from epi-pFCC using the here described hydroxylation assay. Figure 4 shows MS/MS experiments of both epi-pFCC and epi-pFCC-OH that are characteristic for both compounds and help for their identification in LC-MS/MS experiments. Ideally, assays are performed with a minimum of three replicates to allow for statistical analysis of the results.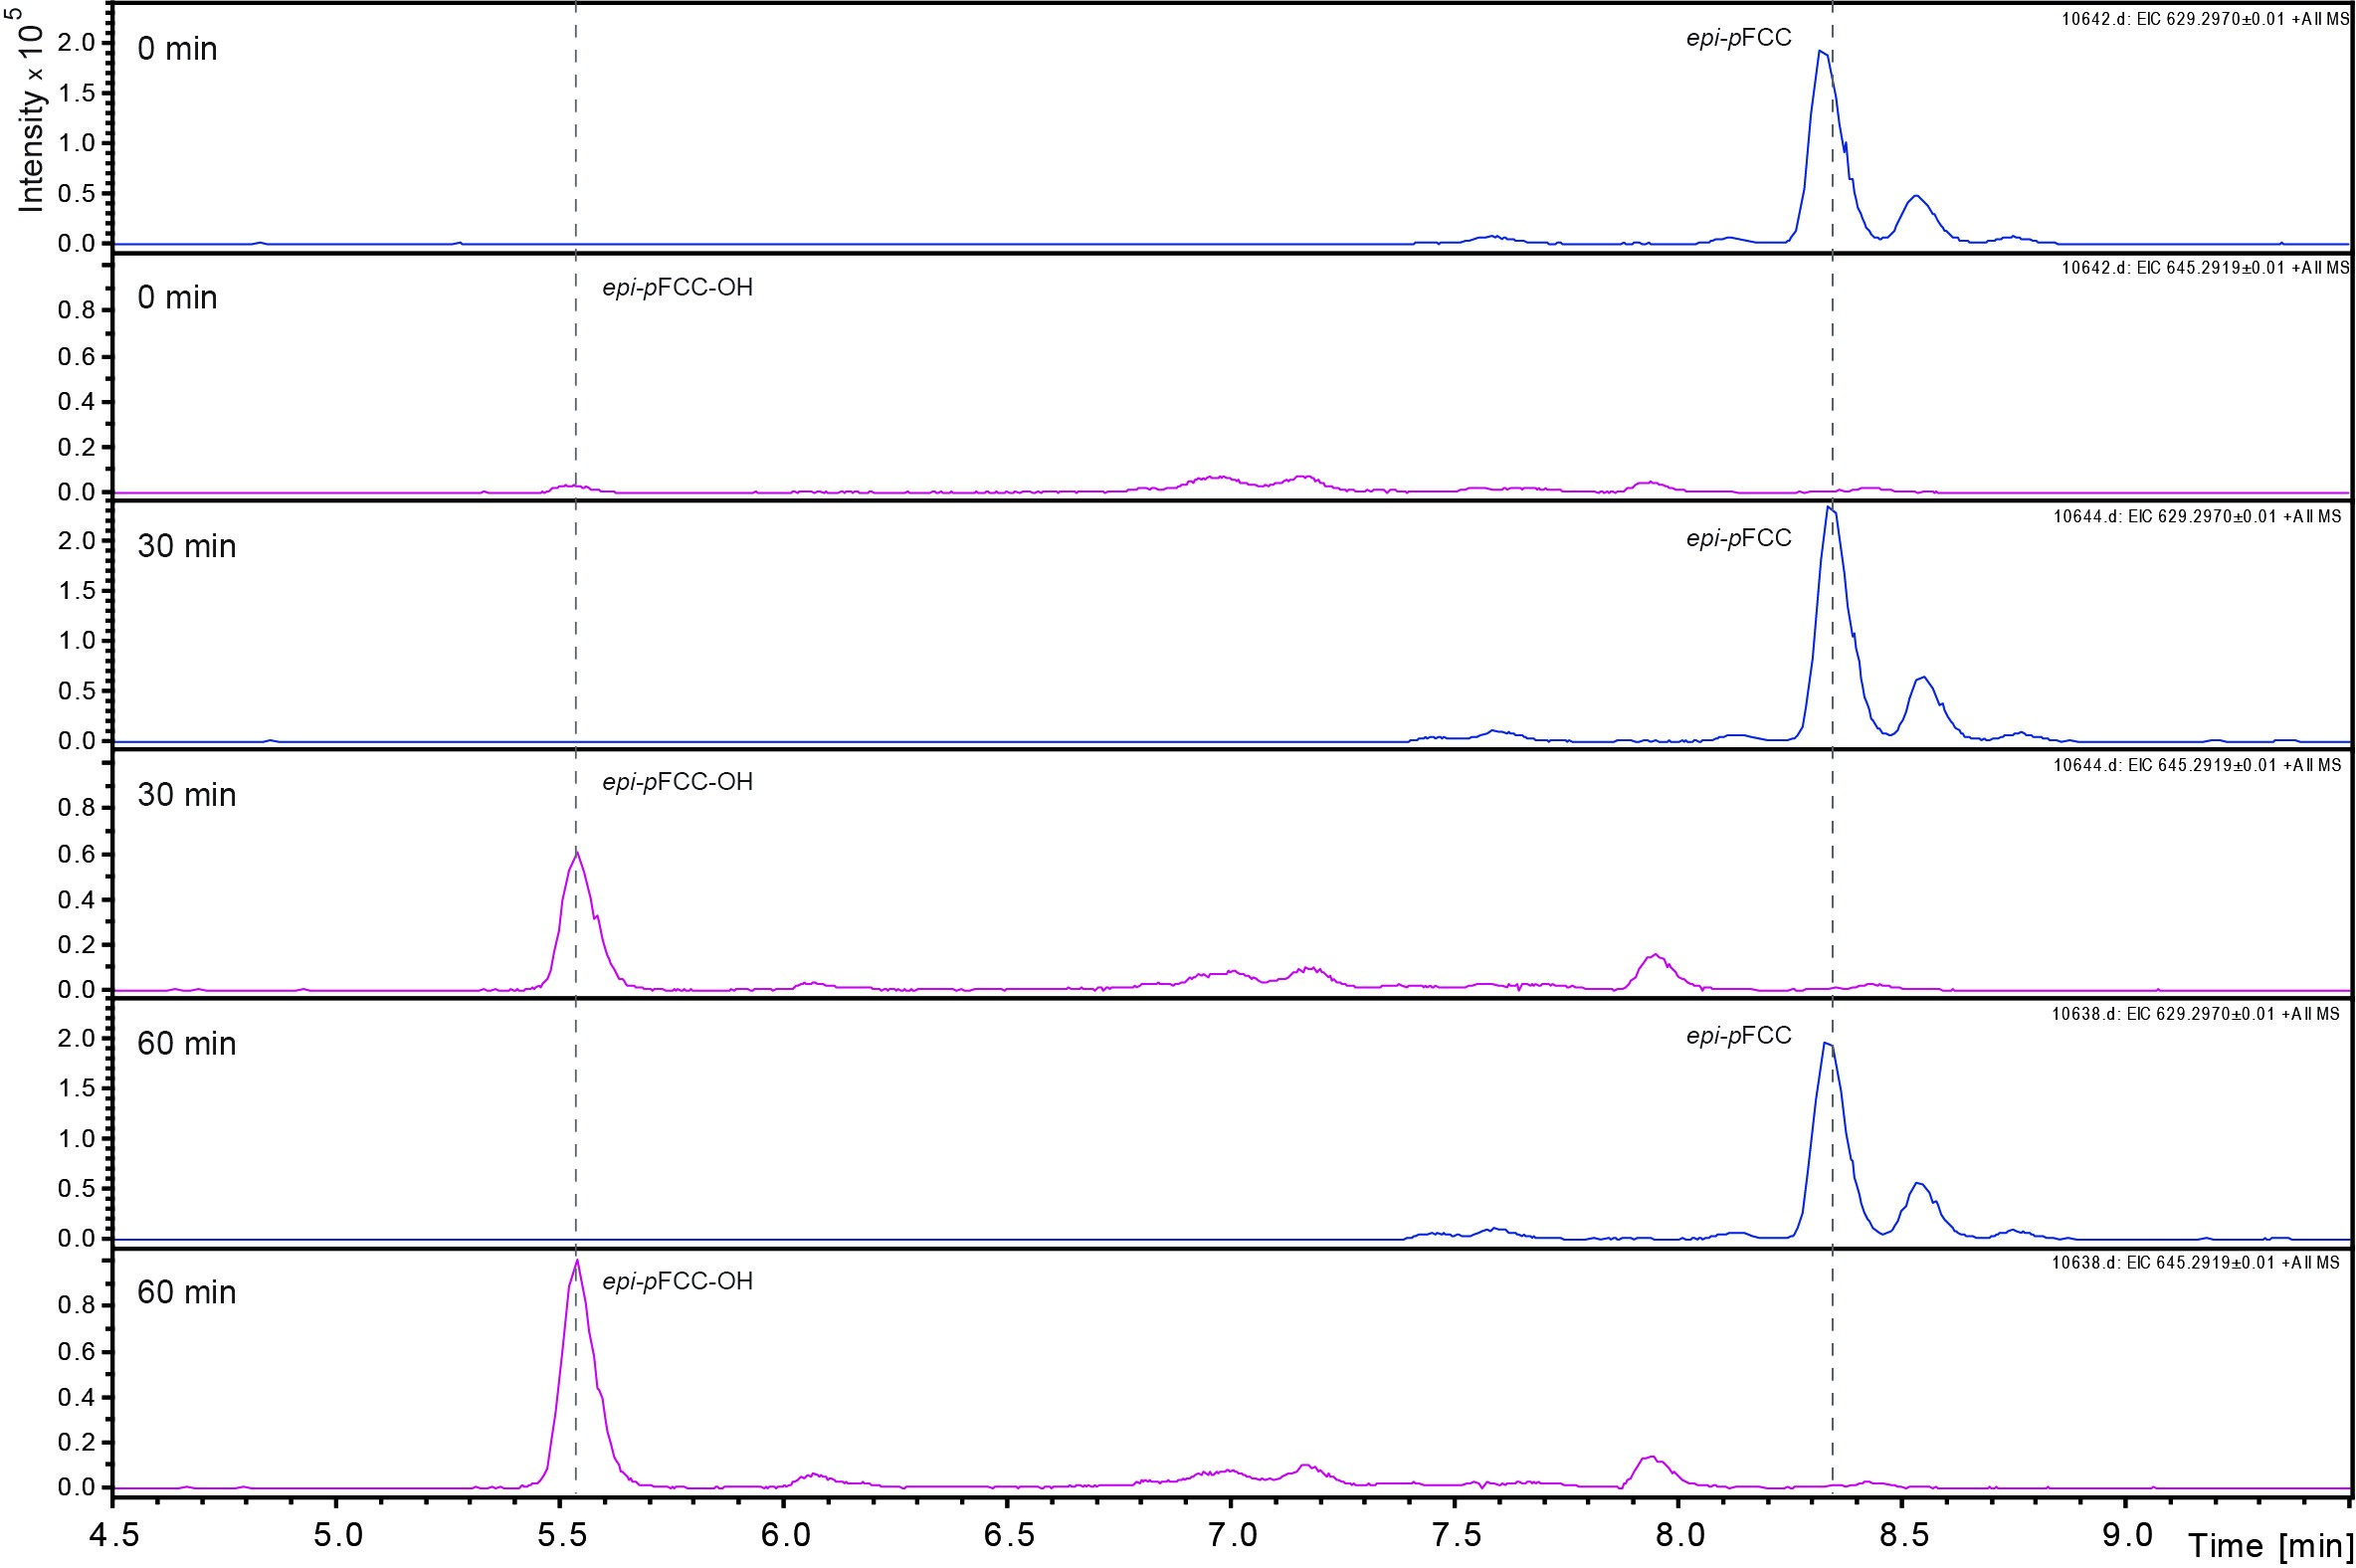
Figure 3. Time dependent formation of epi-pFCC-OH. The formation of epi-pFCC-OH over a time course of 60 min was measured by LC-MS. Shown are extracted ion chromatograms for the masses 629 m/z (epi-pFCC) and 645 m/z (epi-pFCC-OH).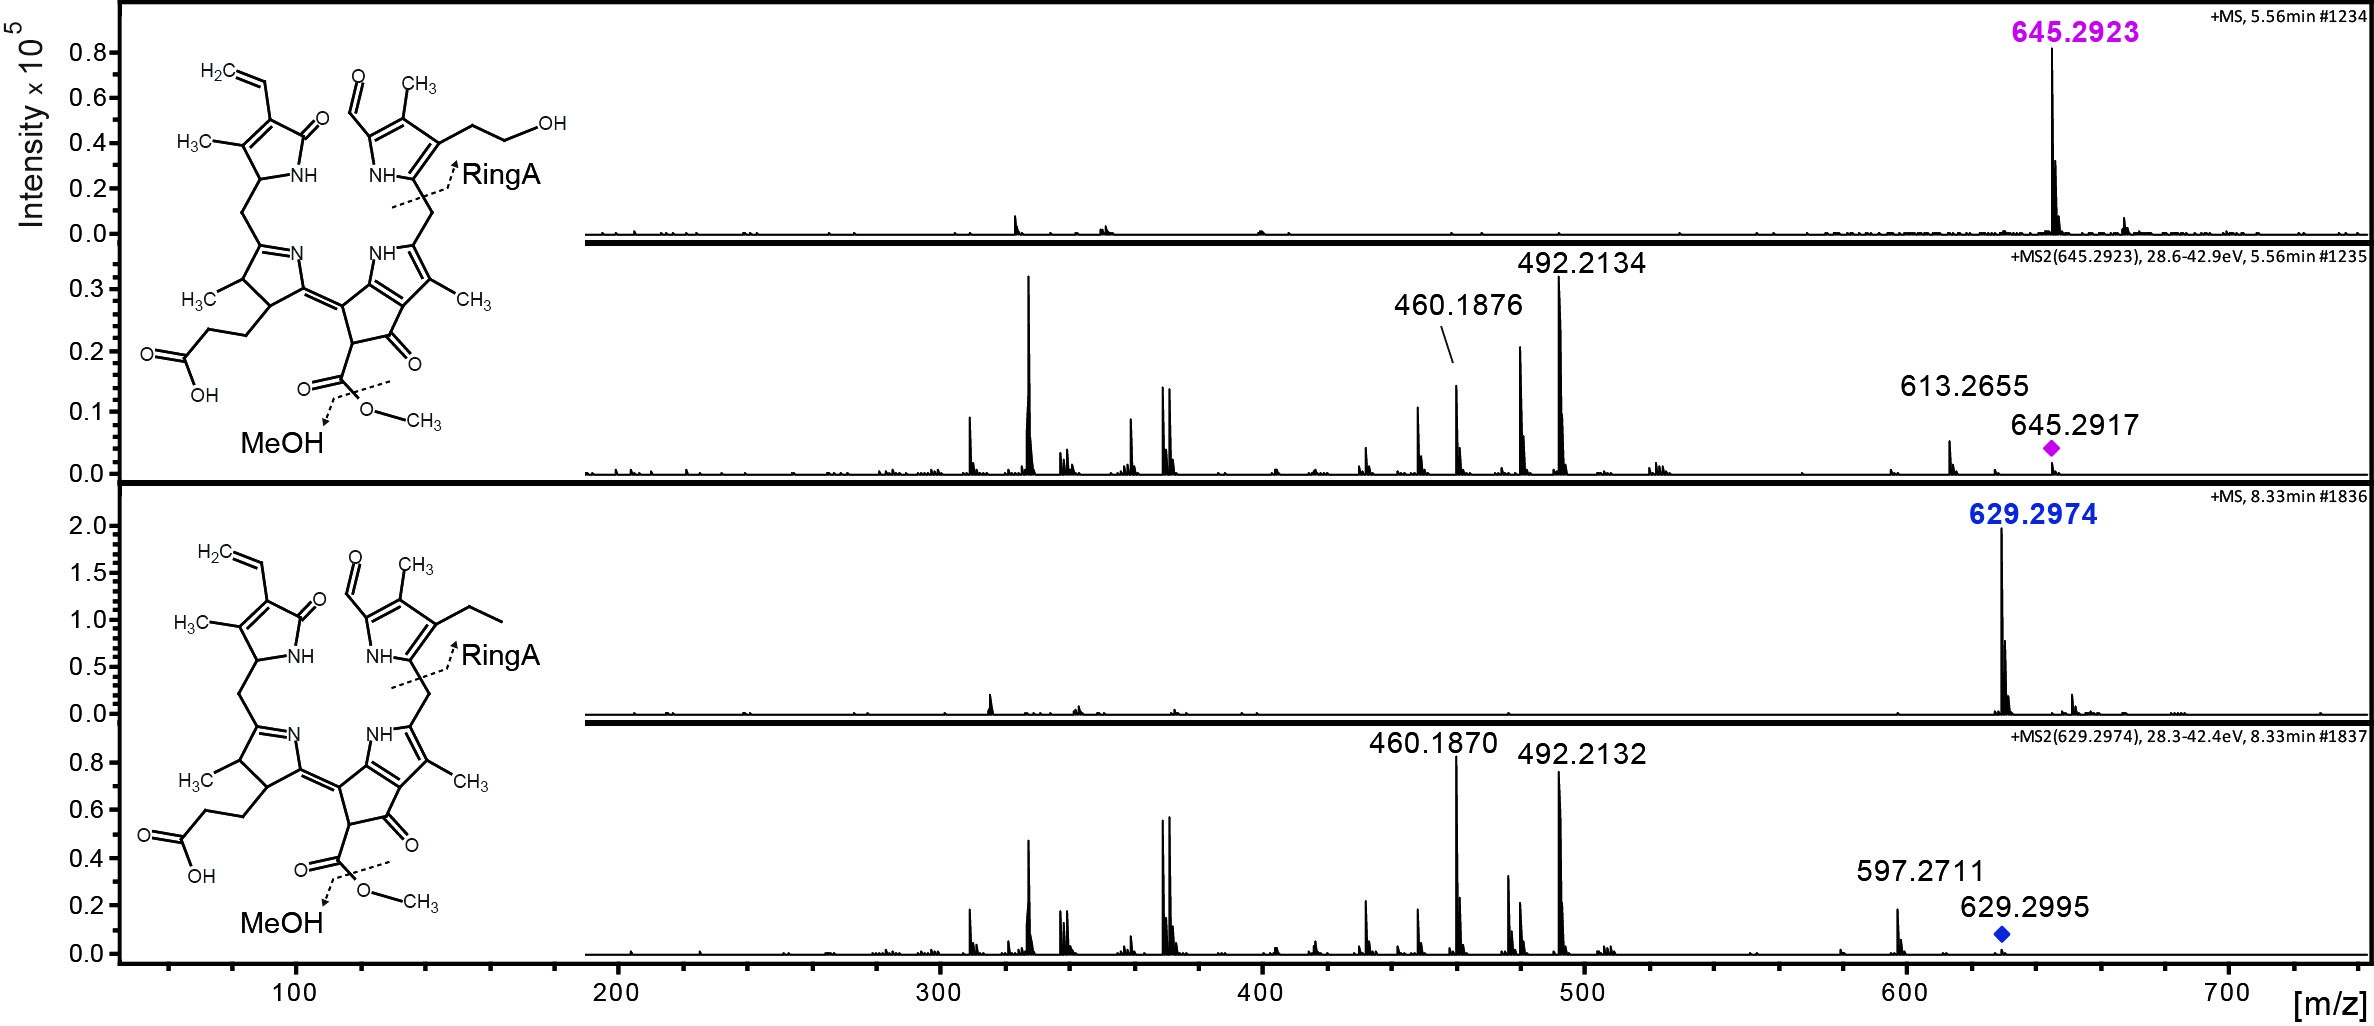
Figure 4. MS/MS fractionation pattern of epi-pFCC (629 m/z; bottom) and its hydroxylated form (645 m/z; top). See Table 1 for MS/MS characteristics of both compounds.
Table 1. Differences between epi-pFCC and epi-pFCC-OH in mass, chemical formula and three characteristic MS/MS fragments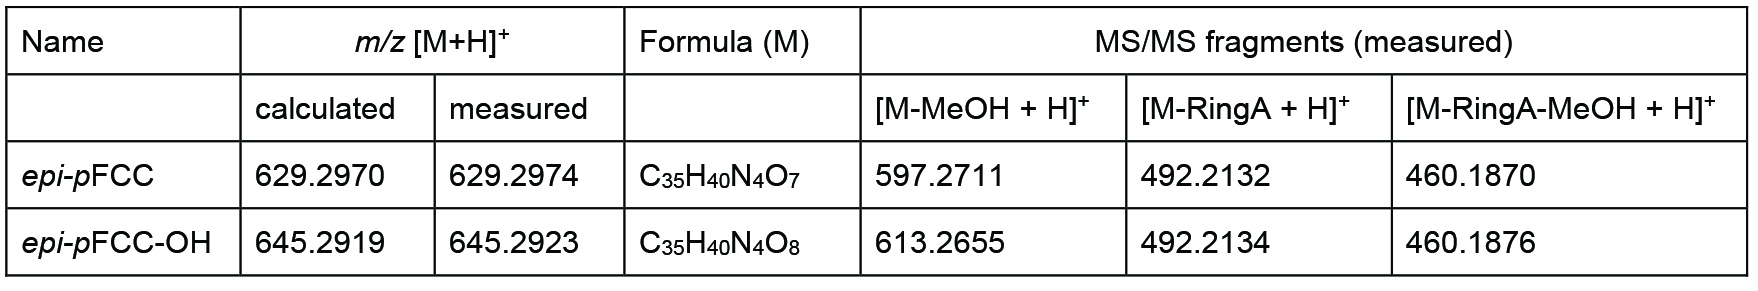
Recipes
- Chromoplast isolation buffer
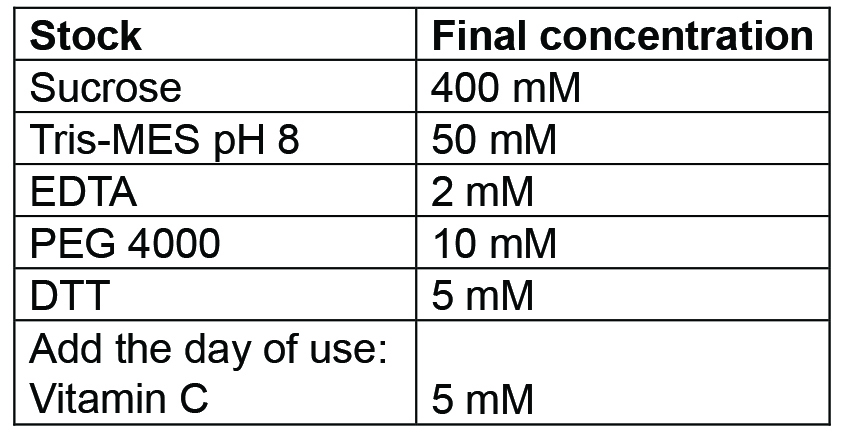
Prepare 500 ml. Buffer can be prepared and then autoclaved in advance, it should be stored at 4 °C for up to a week; for longer storage freeze at -20 °C. Before use, add the Vitamin C (as powder) freshly - Tris MES pH 8 buffer
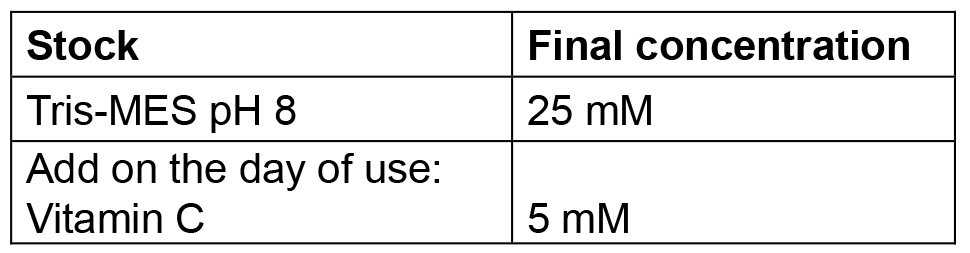
Prepare 100 ml. Buffer can be prepared and then autoclaved in advance, it should be stored at 4 °C for up to a week; for longer storage freeze at -20 °C. Before use, add the Vitamin C (as powder) freshly
Acknowledgments
This work was supported by the Swiss National Science Foundation (grant # 31003A_149389/1). This protocol was adapted from previous work (Hauenstein et al., 2016).
References
- Christ, B., Hauenstein, M. and Hortensteiner, S. (2016). A liquid chromatography-mass spectrometry platform for the analysis of phyllobilins, the major degradation products of chlorophyll in Arabidopsis thaliana. Plant J 88(3): 505-518.
- Hauenstein, M., Christ, B., Das, A., Aubry, S. and Hörtensteiner, S. (2016). A role for TIC55 as a hydroxylase of phyllobilins, the products of chlorophyll breakdown during plant senescence. Plant Cell 28(10): 2510-2527.
- Kräutler, B. (2016). Breakdown of chlorophyll in higher plants--phyllobilins as abundant, yet hardly visible signs of ripening, senescence, and cell death. Angew Chem Int Ed Engl 55(16): 4882-4907.
- Mühlecker, W., Kräutler, B., Moser, D., Matile, P. and Hörtensteiner, S. (2000). Breakdown of chlorophyll: a fluorescent chlorophyll catabolite from sweet pepper (Capsicum annuum). Helv Chim Acta 83: 278-286.
Article Information
Copyright
© 2017 The Authors; exclusive licensee Bio-protocol LLC.
How to cite
Hauenstein, M. and Hörtensteiner, S. (2017). Isolation and Detection of the Chlorophyll Catabolite Hydroxylating Activity from Capsicum annuum Chromoplasts. Bio-protocol 7(18): e2561. DOI: 10.21769/BioProtoc.2561.
Category
Plant Science > Plant biochemistry > Protein > Activity
Biochemistry > Protein > Activity
Do you have any questions about this protocol?
Post your question to gather feedback from the community. We will also invite the authors of this article to respond.