- Protocols

- Articles and Issues
- For Authors
- About
- Become a Reviewer

Ubiquitin Proteasome Activity Measurement in Total Plant Extracts

Published: Vol 7, Iss 17, Sep 5, 2017 DOI: 10.21769/BioProtoc.2532 Views: 9916
Reviewed by: Marisa RosaJinping ZhaoNoelia Foresi
Original research article
The authors used this protocol in:
Nov 2016
Advertisement


Protocol Collections
Comprehensive collections of detailed, peer-reviewed protocols focusing on specific topics


Abstract
The fine-tuned balance of protein level, conformation and location within the cell is vital for the dynamic changes required for a cell to respond to a given stimulus. This requires the regulated turnover of damaged or short-lived proteins through the ubiquitin proteasome system (UPS). Thus, the protease activity of the proteasome is adjusted to meet the current demands of protein degradation via the UPS within the cell. We describe the adaptation of an intramolecular quenched fluorescence assay utilizing substrate-mimic peptides for the measurement of proteasome activity in total plant extracts. The peptide substrates contain donor-quencher pairs that flank the scissile bond. Following cleavage, the increase in dequenched donor emission of the product is subsequently measured over time and used to calculate the relative proteasome activity.
Keywords: ProteasomeBackground
The ubiquitin proteasome system (UPS) is the major protein degradative machinery in eukaryotic cells and as such the UPS is essential for the regulation of many cellular processes, including signaling, cell cycle, vesicle trafficking, and immunity. Proteins destined for turnover are marked by the covalent attachment of ubiquitin and then degraded by the 26S proteasome. The 26S proteasome is composed of two subparticles, the 20S core protease (CP) that compartmentalizes the protease active sites and the 19S regulatory particle that recognizes and translocates appropriate substrates into the CP lumen for breakdown. Proteasome activity is modulated in order to maintain proteostasis in response to fluctuating internal and external conditions. We have recently shown that the UPS is involved in several aspects of plant immunity and a range of plant and animal pathogens subvert the UPS to enhance their virulence (Üstün et al., 2013; Üstün et al., 2014; Üstün and Börnke, 2015; Üstün et al., 2016). In plants, proteasome activity is strongly induced during basal defense and adapted bacterial pathogens can interfere with this induction using specific virulence factors. This protocol describes an assay to assess the relative chymotrypsin-like proteolytic activity of the proteasome in total plant extracts using a fluorogenic substrate. This assay is carried out in a 96-well format using a plate reader and thus is amendable to medium to high throughput and can easily be modified to measure additional proteolytic activities of the proteasome by exchanging the substrate accordingly.
Materials and Reagents
- Pipette tips
- 1.5 ml microcentrifuge tubes
- Black walled 96-well plates for proteasome activity measurements (Corning, catalog number: 3603 )
- Clear 96-well plates for protein measurements (Greiner Bio One International, catalog number: 655101 )
- Plant material (the protocol is optimized for leaf samples from Nicotiana benthamiana, Capsicum annuum and Arabidopsis thaliana but can also be applied to other plant species or tissues)
- Murashige and Skoog (MS) agar (Sigma-Aldrich)
- Sucrose (MP Biomedicals, catalog number: 04821713 )
- Liquid nitrogen (N2)
- Bio-Rad Protein Assay Kit II (Bio-Rad Laboratories, catalog number: 5000002 )
- Proteasome substrate
Suc-LLVY-AMC (chymotrypsin-like activity substrate) (Sigma-Aldrich, catalog number: S6510 )
Note: Other proteolytic activities of the proteasome can be measured using the same protocol by using appropriate substrates (Z-ARR-AMC for measuring the trypsin-like activity [Bachem, catalog number: I-1125.0050 ] and Z-LLE-AMC for the determination of the peptidylglutamyl-peptide-hydrolyzing [PGPH] activity of the 20S proteasome [Bachem, catalog number: I-1945.0005 ]). - Dimethyl sulfoxide (DMSO) (Sigma-Aldrich, catalog number: D8418 )
- Adenosine 5’-triphosphate disodium salt hydrate (ATP) (Sigma-Aldrich, catalog number: A3377 )
- 4-(2-Hydroxyethyl)piperazine-1-ethanesulfonic acid, N-(2-Hydroxyethyl)piperazine-N’-(2-ethanesulfonic acid) (HEPES) (Sigma-Aldrich, catalog number: H3375 )
- Potassium hydroxide (KOH) (Sigma-Aldrich, catalog number: 60377 )
- 1,4-Dithiothreitol (DTT) (Thermo Fisher Scientific, InvitrogenTM, catalog number: 15508013 )
- Magnesium chloride hexahydrate (MgCl2·6H2O) (Sigma-Aldrich, catalog number: M2670 )
- Potassium chloride (KCl) (Sigma-Aldrich, catalog number: P9541 )
- Bovine serum albumin (BSA) (Sigma-Aldrich, catalog number: A2153 )
- Proteasome substrate solution (see Recipes)
- Extraction buffer (see Recipes)
- Proteasome lysis/assay buffer (see Recipes)
Equipment
- Pipettes
- pH-meter
- Cork borer 0.7 cm diameter (Sigma-Aldrich, catalog number: Z165220 )
- Overhead stirrer (Heidolph Instruments, model: RZR 1 )
- Cooled microcentrifuge (4 °C)
- Adjustable thermoblock for 96-well plates (Eppendorf, model: ThermoMixer® C )
- Plate reader spectrophotometer (Absorbance, Fluorescence) (e.g., BioTek Instruments, model: Synergy HT )
Software
- Gen5 software (Biotek Instruments)
Procedure
- Plant cultivation
- Arabidopsis thaliana: Arabidopsis seeds (ecotype Columbia-0) were sown on Murashige and Skoog (MS) agar (Sigma-Aldrich) plates supplemented with 2% (w/v) sucrose and cultivated in tissue culture under a 16-h-light/8-h-dark regime (irradiance of 150 μE m-2 sec-1) at 70% humidity. Arabidopsis seeds germinated on soil were grown under short-day conditions (8 h of light/16 h of dark [23 °C/21 °C], irradiance of 150 μE m-2 sec-1, 70% humidity).
- Nicotiana benthamiana and Capsicum annuum plants were grown in soil in a greenhouse with daily watering and subjected to a 16-h-light/8-h-dark cycle (25 °C/21 °C) at 300 μE m-2 sec-1 light and 40% relative humidity.
- Arabidopsis thaliana: Arabidopsis seeds (ecotype Columbia-0) were sown on Murashige and Skoog (MS) agar (Sigma-Aldrich) plates supplemented with 2% (w/v) sucrose and cultivated in tissue culture under a 16-h-light/8-h-dark regime (irradiance of 150 μE m-2 sec-1) at 70% humidity. Arabidopsis seeds germinated on soil were grown under short-day conditions (8 h of light/16 h of dark [23 °C/21 °C], irradiance of 150 μE m-2 sec-1, 70% humidity).
- Sample preparation
- Punch out two to four leaf discs with a cork borer (diameter 0.7 cm), combine discs from the same sample in a single 1.5 ml microcentrifuge tube and immediately freeze leaf discs in liquid nitrogen. Samples can be stored at -80 °C until further processing.
- Grind frozen leaf material in 200 µl extraction buffer (see Recipes) in an overhead stirrer until the material is completely thawed (be sure to prevent heating of the sample). Alternatively, leaf discs can be ground to a fine powder in a pre-cooled mortar. Add extraction buffer and continue to grind until the material is completely thawed. Pour the suspension into a microcentrifuge tube.
- Centrifuge samples at 17,000 x g for 10 min at 4 °C and subsequently transfer the supernatant to a fresh tube.
- Determine the protein content of the extracts with the Bio-Rad Assay Dye according to the manufacturer’s instructions using BSA as a standard.
- Adjust the protein concentration of the supernatant to 1 mg/ml with extraction buffer. Keep samples on ice until use. Proceed to measurement as soon as possible. It is generally not recommended to store the samples for a longer period of time as the proteasome activity is relative unstable even if stored at -80 °C.
- Punch out two to four leaf discs with a cork borer (diameter 0.7 cm), combine discs from the same sample in a single 1.5 ml microcentrifuge tube and immediately freeze leaf discs in liquid nitrogen. Samples can be stored at -80 °C until further processing.
- Assay
- Prepare assay buffer (see Recipes).
- Add 25-50 μg of plant extract into the wells of a black walled 96-well plate and subsequently mix with 220 μl assay buffer. The amount of extract used is plant species and tissue dependent but should be kept the same within a single experiment. Empirically, 50 µg from Nicotiana tabacum or Capsicum annuum and 25 µg from Arabidopsis thaliana leaf samples work best. Process at least three biological replicates per sample/experimental condition (that is material harvested from different plants receiving the same treatment).
- Incubate for 15 min at 30 °C.
- Add proteasome substrate into the wells (15-30 μl/per sample; final concentration should be 100 μM to 200 μM). Add at least three blank wells including all solutions except protein extract for later background subtraction.
- Measure the release of amino-methyl-coumarin at 30 °C (A360ex/A460em) on a fluorescent plate reader every 1.5 min over a period of 120 min.
The protocol details in Gen5 (Biotek Instruments) are as follows:
Plate Type: 96-WELL PLATE
Set Temperature: Setpoint 30 °C, Preheat before moving to next step
Start Kinetic: Runtime 2:00:00 (HH:MM:SS), Interval 0:01:30, 81 Reads
Read: Fluorescence Endpoint, Full Plate, Filter Set1: Excitation: 360/40, Emission: 460/40, Optics: Top, Gain: 60, Readspeed: Normal, Readheight: 1 mm
End Kinetic
- Prepare assay buffer (see Recipes).
Data analysis
The representation of the results can be done in relative fluorescent units (RFUs) by subtracting the RFU levels of the blank wells (containing all solutions except protein extract) from all values. Calculate proteasome activity from the mean linear slope of the emission curve (Figure 1) and express it as fluorescence units per minute (RFU min-1) or as percentage relative to controls, respectively. The mean slope (Mean V in Gen5) is calculated by a linear regression on points in the calculation zone (marked by a green bar in Figure 1) by the software. In Gen5 (Biotek Instruments) go to Protocols > Data Reduction > Well Analysis and tic the Mean V box. For Mean V, the calculation zone is typically adjusted automatically to ignore misleading data points generated at the beginning of a kinetic assay due to noise. The Mean V values can then be exported to Excel by pressing the ‘Edit Table’ button within the ‘Statistics’ view for further analysis (calculation of mean values and statistics). Refer to the user manual of your plate reader for specific details of your instrument.
A typical result of data analysis is shown in Figure 2. Here, pepper plants were infected with different bacterial strains alongside with MgCl2, as a control. For the experiments it is important to use such controls and leaf material from different plants (at least n = 3 to be able to perform statistics) that are of the same age.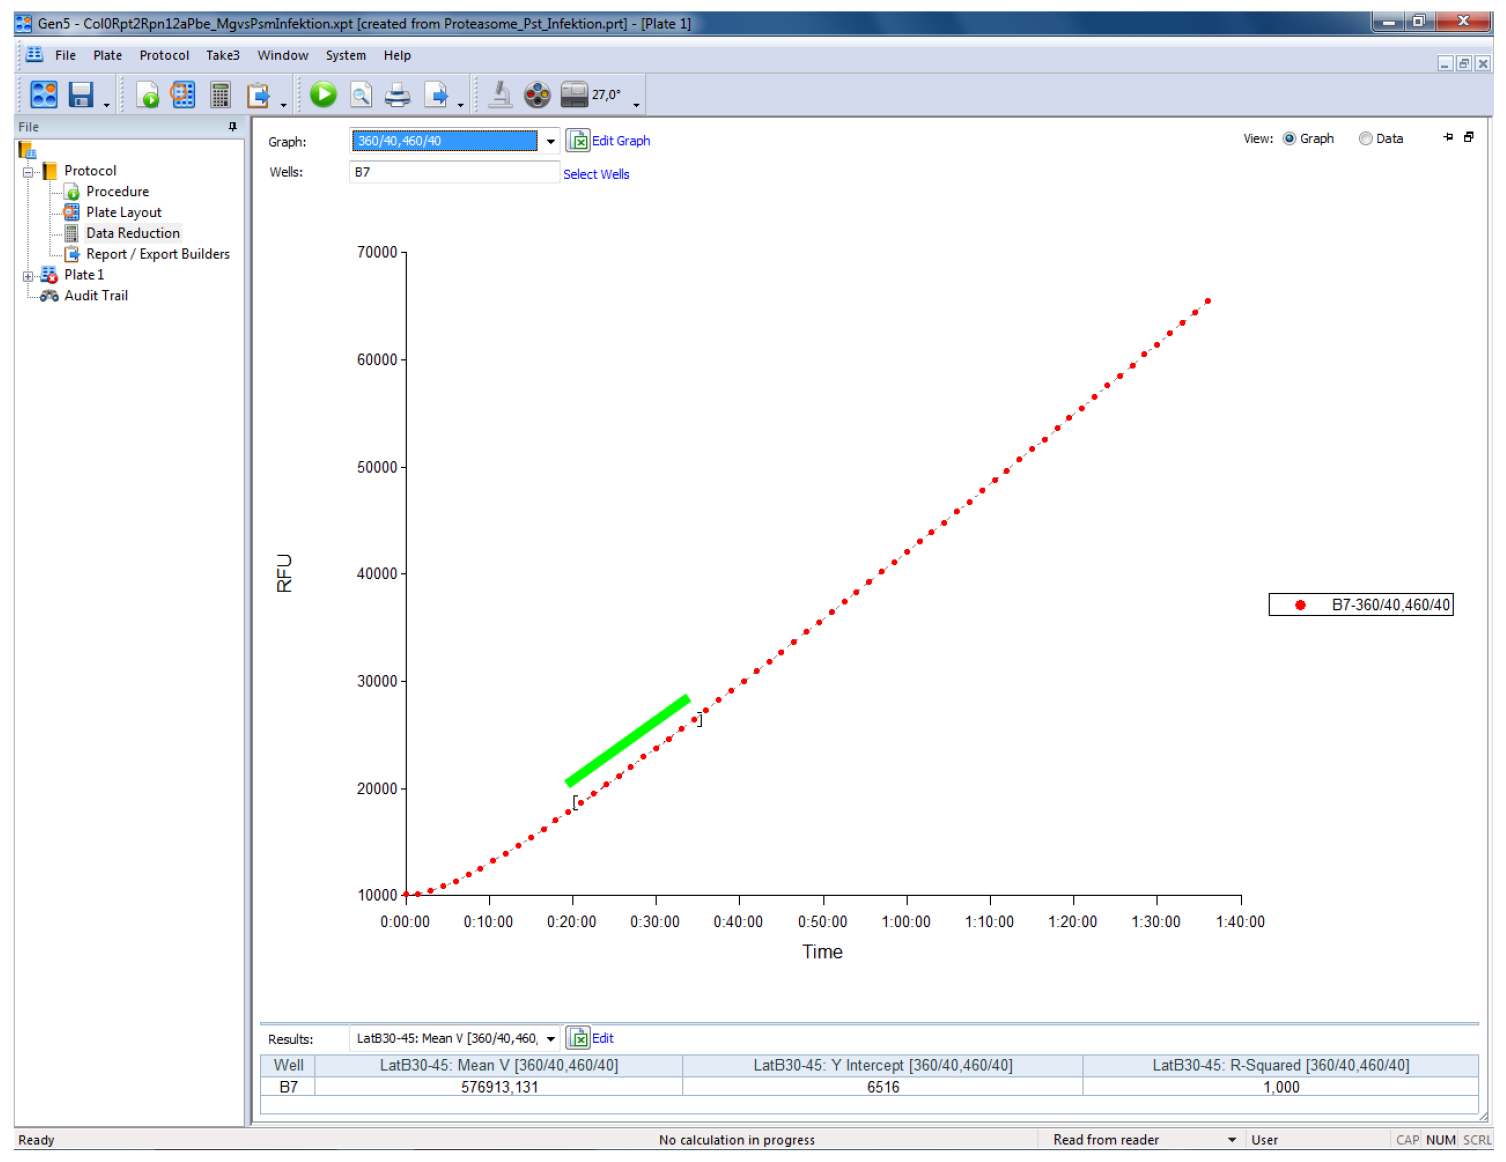
Figure 1. Screenshot of a typical output of a proteasome activity measurement in a leaf sample from Arabidopsis thaliana using the above described procedure. The sample was measured on a Biotek Synergy HT plate reader controlled by the Gen5 software (Biotek Instruments). The green bar indicates the part of the linear slope that has been used to calculate the relative fluorescence units per minute (RFU min-1).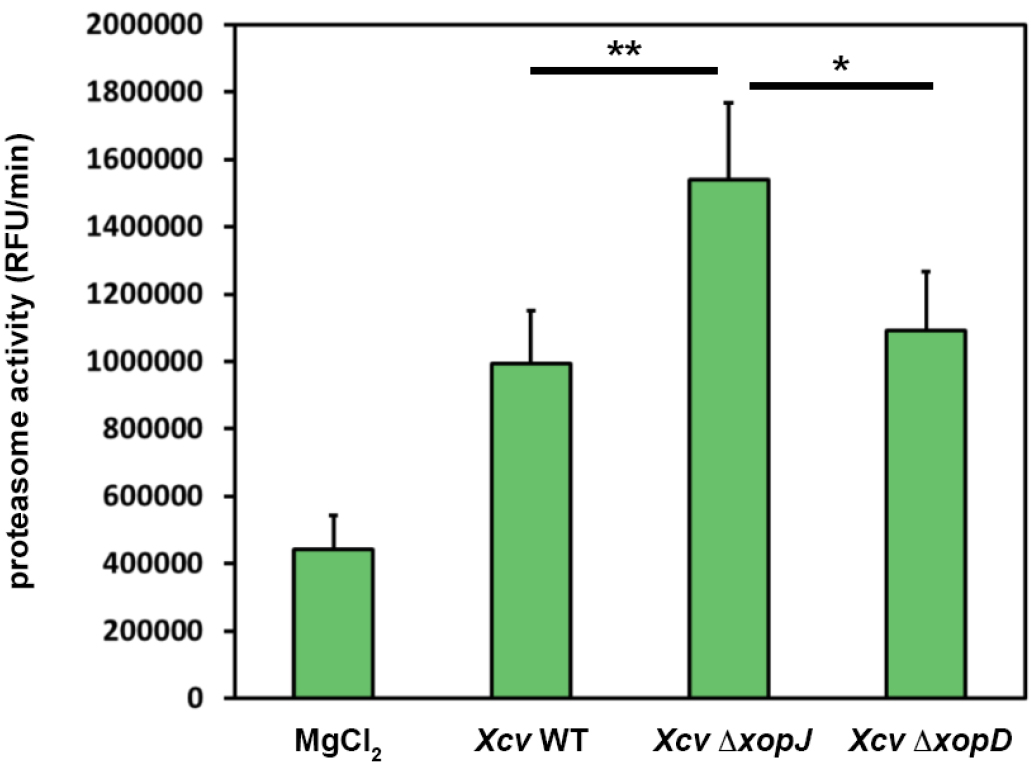
Figure 2. XopJ reduces proteasome activity during Xanthomonas-pepper interaction. Pepper leaves were infiltrated with Xanthomonas campestris pv vesicatoria (Xcv) strains indicated in the figure (WT, wild type; ∆xopJ, strain lacking the type-III effector protein XopJ; ∆xopD strain lacking the type-III effector protein XopD). At 3 dpi proteasome activity in total leaf extracts was determined by monitoring the breakdown of the fluorogenic peptide suc-LLVY-NH-AMC in a fluorescence spectrophotometer. Data represent the mean SD (n = 5). Significant differences were calculated using Student’s t-test and are indicated by: *P < 0.05; **P < 0.01.
Recipes
- Proteasome substrate solution
Dissolve Suc-LLVY-AMC in DMSO to a final concentration of 2 mM and store frozen at -20 °C (stable for several months) - Extraction buffer (always prepare fresh and keep on ice until use)
2 mM ATP
50 mM HEPES-KOH (adjust to pH 7.2 with 1 N KOH)
2 mM DTT
0.25 M sucrose - Proteasome lysis/assay buffer (always prepare fresh and keep on ice until use)
100 mM HEPES-KOH (adjust to pH 7.8 with 1 N KOH)
5 mM MgCl2
10 mM KCl
2 mM ATP
Acknowledgments
This work was supported by the Federation of the European Biochemical Societies (long-term fellowship to S.Ü.), and by the Deutsche Forschungsgemeinschaft (grant Nos. CRC973 and BO1916/5-2 to F.B.). This protocol is modified from previous work described in Reinheckel et al. (2000).
References
- Reinheckel, T., Ullrich, O., Sitte, N. and Grune, T. (2000). Differential impairment of 20S and 26S proteasome activities in human hematopoietic K562 cells during oxidative stress. Arch Biochem Biophys 377(1): 65-68.
- Üstün, S., Bartetzko, V. and Börnke, F. (2013). The Xanthomonas campestris type III effector XopJ targets the host cell proteasome to suppress salicylic-acid mediated plant defence. PLoS Pathog 9(6): e1003427.
- Üstün, S. and Börnke, F. (2015). The Xanthomonas campestris type III effector XopJ proteolytically degrades proteasome subunit RPT6. Plant Physiol 168(1): 107-119.
- Üstün, S., König, P., Guttman, D. S. and Börnke, F. (2014). HopZ4 from Pseudomonas syringae, a member of the HopZ type III effector family from the YopJ superfamily, inhibits the proteasome in plants. Mol Plant Microbe Interact 27(7): 611-623.
- Üstün, S., Sheikh, A., Gimenez-Ibanez, S., Jones, A., Ntoukakis, V. and Börnke, F. (2016). The proteasome acts as a hub for plant immunity and is targeted by Pseudomonas type III effectors. Plant Physiol 172(3): 1941-1958.
Article Information
Copyright
© 2017 The Authors; exclusive licensee Bio-protocol LLC.
How to cite
Readers should cite both the Bio-protocol article and the original research article where this protocol was used:
- Üstün, S. and Börnke, F. (2017). Ubiquitin Proteasome Activity Measurement in Total Plant Extracts. Bio-protocol 7(17): e2532. DOI: 10.21769/BioProtoc.2532.
- Üstün, S., Sheikh, A., Gimenez-Ibanez, S., Jones, A., Ntoukakis, V. and Börnke, F. (2016). The proteasome acts as a hub for plant immunity and is targeted by Pseudomonas type III effectors. Plant Physiol 172(3): 1941-1958.
Category
Plant Science > Plant biochemistry > Protein > Activity
Biochemistry > Protein > Degradation
Do you have any questions about this protocol?
Post your question to gather feedback from the community. We will also invite the authors of this article to respond.