- Protocols

- Articles and Issues
- For Authors
- About
- Become a Reviewer

Overrepresentation Analyses of Differentially Expressed Genes in the Smut Fungus Ustilago bromivora during Saprophytic and in planta Growth
Published: Vol 7, Iss 15, Aug 5, 2017 DOI: 10.21769/BioProtoc.2426 Views: 9560
Reviewed by: Arsalan DaudiMalou FraitureAnonymous reviewer(s)
Original research article
The authors used this protocol in:

Nov 2016
Advertisement


Protocol Collections
Comprehensive collections of detailed, peer-reviewed protocols focusing on specific topics


Related protocols
Abstract
We have established the Ustilago bromivora–Brachypodium spp. interaction as a new model pathosystem for biotrophic fungal plant infections of the head smut type (Rabe et al., 2016). In this protocol, the methodology used for comparing gene expression between saprophytic and in planta growth of the fungus is described. The experimental and analytical pipeline, how next generation RNA sequencing (Illumina RNA-Seq) analysis can be used to obtain lists of genes significantly up or down regulated in planta in comparison to axenic culture is given. Furthermore, different methods to identify functional categories that are over- or under-represented among specific classes of genes are presented.
Keywords: Plant infectionBackground
RNA deep sequencing (RNA-Seq) is a powerful and versatile tool to gain insights into the responses of cells and organisms to environmental changes and their adaptations to new developmental stages. A striking change of life situation comes with the switch from yeast-like growth to filamentous, pathogenicity associated growth modes in non-obligate pathogens. We studied this switch in the biotrophic fungal plant pathogen Ustilago bromivora (Rabe et al., 2016). RNA-Seq from infected tissue is a special situation, since reads from both–the host and the pathogen–will be identified. Here necessary considerations are described. These include the sequencing depth required to sufficiently cover the pathogen in the host tissue, and the methods used to align and quantify the resulting mixed pool of reads. Over/underrepresentation analysis (ORA) is a method to link expression changes to potential biological responses by looking if certain classes of transcripts respond in a concerted way. Three methodologies are described that can be used to statistically test for over- or underrepresentation of classes of transcripts: The first method tests ORA individually for defined classes of interest, such as predicted secreted proteins, using Fisher exact test (example for R implementation given). The other two approaches are ‘explorative’ analyses that test over/underrepresentation across all functional classes defined in a given functional annotation framework (FunCat or Mapman annotation).
Materials and Reagents
- Pipetman Diamond tips, D200 (Gilson, catalog number: F161931 )
- Pipetman Diamond tips, D1000 (Gilson, catalog number: F161671 )
- 50 ml sterile disposable vial (SARSTEDT, catalog number: 62.547.254 )
- 1.5 ml microcentrifuge tubes (SARSTEDT, catalog number: 72.690.001 )
- Micro-homogenizer (Carl Roth, catalog number: K994.1 )
- Glycerol anhydrous (Applichem, catalog number: A1123,1000 )
- Liquid nitrogen
- Sodium hypochlorite ~10% (Honeywell International, catalog number: 71696-2.5L )
- Hydrochloric acid (HCl) 37% (Applichem, catalog number: 131020.1211 )
- TRIzol reagent (Thermo Fisher Scientific, InvitrogenTM, catalog number: 15596026 )
- TURBO DNA-free Kit (Thermo Fisher Scientific, InvitrogenTM, catalog number: AM1907 )
- Ribo-Zero rRNA Removal Kit (Plant) (Illumina, catalog number: MRZPL1224 )
- NEB Next Ultra RNA Library Prep Kit (New England Biolabs, catalog number: E7530S )
- Ampure XP beads (Beckman Coulter, catalog number: A63882 )
- Agilent RNA 6000 Nano Kit for Bioanalyzer (Agilent Technologies, catalog number: 5067-1511 ) or Standard Sensitivity RNA Analysis Kit (15 nt) (Advanced Analytical Technologies, catalog number: DNF-471 )
- Illumina PE Cluster Kit (Illumina, catalog number: FC-401-4003 )
- Illumina 250 cycle SBS reagents (Illumina, catalog number: PE-401-4001 )
- Potato dextrose broth (BD, catalog number: 254920 )
- Standard potting soil (Topfsubstrat ED63, Einheitserde, catalog number: SP ED63 T, obtained from GBC-Gartenbauzentrum Schwechat, catalog number: 013224 )
- Perlite (Perlite Premium 2-6 mm, Gramoflor, obtained from GBC-Gartenbauzentrum Schwechat, catalog number: 079568 )
- Silica sand (Quarzsand 0.5-2 mm, min2C, obtained from GBC-Gartenbauzentrum Schwechat, catalog number: 005989 )
- Germination soil (Aussaaterde, Huminsubstrat N3, Neuhaus, Klasmann-Deilmann, obtained from GBC-Gartenbauzentrum Schwechat, catalog number: 001318 )
- Potato dextrose liquid medium (PD medium) (see Recipes)
- Soil mix (see Recipes)
Equipment
- Pipetman P1000 (Gilson, catalog number: F123602 )
- Pipetman P200 (Gilson, catalog number: F123601 )
- Centrifuge for 50 ml disposable vials (e.g., Eppendorf, model: 5810 R )
- Spectral photometer capable of measuring OD at 600 nm
- ND-1000 NanoDrop Spectrophotometer (Thermo Fisher Scientific, model: NanoDrop 1000 )
- 2100 Bioanalyzer (Agilent Technologies, model: 2100 Bioanalyzer ) or Fragment Analyzer 12 (Advanced Analytical Technologies, model: Fragment Analyzer 12)
- Illumina HiSeq2500 instrument (Illumina, model: HiSeq® 2500 )
- Fume hood
Software
- FastQC (http://www.bioinformatics.babraham.ac.uk/projects/fastqc) (freely available)
- Cutadapt (Martin, 2011) (freely available)
- Kallisto (Bray et al., 2016) (freely available)
- R statistical environment (R Development Core Team, 2012) (freely available)
For those not familiar with R, the following resources may be helpful:
https://cran.r-project.org/doc/manuals/r-release/R-intro.pdf
https://onlinecourses.science.psu.edu/statprogram/r
https://www.youtube.com/watch?v=7cGwYMhPDUY - DESeq2 R package (Love et al., 2014) (freely available)
- FunCat workflow (Ruepp et al., 2004) implemented on the Pedant home page (http://mips.helmholtz-muenchen.de/funcatDB/index_update.html) (freely available for publicly released species)
- Mercator online tool (http://www.plabipd.de/portal/web/guest/mercator-sequence-annotation) (freely available)
- Pageman tool (Usadel et al., 2006), part of the Mapman software suit: http://mapman.gabipd.org/web/guest/mapman (freely available)
Procedure
- Obtain samples of saprophytically grown U. bromivora
- To obtain samples of saprophytically grown U. bromivora, PD medium (see Recipes) was inoculated from a mating type 1 strain (UB1) glycerol stock kept at -80 °C. The glycerol stock was produced by mixing 1 ml UB1 overnight culture with 1 ml 50% glycerol. For the original isolation of U. bromivora spore lines please refer to (Bosch and Djamei, 2017).
- Cell are grown at 21 °C and 200 rpm to an OD600 nm = ~0.8 in three independent biological replicates. Fungal material is sampled by centrifugation in 50 ml vials at 1,200 x g for 5 min. The supernatant is carefully poured off and the pellet is shock frozen in liquid nitrogen. If other species are grown, it can be the case that the pellet is less stable and the supernatant should be pipetted off.
- Obtain samples of the fungus growing in planta
- To obtain samples of the fungus growing in planta, caryopses of Brachypodium hybridum Bd28 are gas sterilized by putting them into a closed exicator together with two 50 ml tubes each with 25 ml 5% sodium hypochlorite solution + 0.75 ml 37% HCl for 2 h.
- After gas sterilization, seeds are left in a 50 ml tube in a fume hood without cover for 1 h, so that any residual chlorine gas can evaporate.
- The seeds are then soaked in sterile filtered tap water for 1-2 h, and germinated for 2-3 weeks at 4 °C in the dark.
- The seedlings are subsequently infected with U. bromivora spore solution. The spore solution is obtained by grinding spore sori filled spikelets of infected plants in a small amount (e.g., 1 ml) of filtered tap water with a micro homogenizer in a disposable vial with a V-shaped bottom (e.g., 1.5 ml micro centrifuge tube). The seedlings are kept moistened (but not submerged) with spore solution at 4 °C for one week and are then planted in soil (see soil mix in the recipes section).
- 12 days after planting, plant stems are harvested and shock frozen in liquid nitrogen.
- RNA extraction
a.RNA is extracted using TRIzol (Chomczynski and Sacchi, 2006) according to the manufacturer’s protocol.
b.Residual DNA is removed with the TURBO DNA-free Kit according to the manufacturer’s instructions. - Determination of RNA quality and quantity
- RNA quality should be verified: To determine RNA concentration and purity, the RNA should be measured with a NanoDrop spectrophotometer. A 260:280 ratio close to 2 and a 260:230 ratio of approximately 2-2.2 is desirable. A minimal amount of 100-200 ng RNA is required for subsequent library preparation. To determine that the isolated RNA is not significantly degraded, a Bioanalyzer or Fragment Analyzer with appropriate kits can be used (see Equipment). Measurements are conducted according to the manufacturer’s instructions. The RNA integrity number (RIN) provided by the Bioanalyzer software is not applicable to the in planta samples, since they contain plant and fungal rRNAs (example: see Figure 1). However, the Bioanalyzer or Fragment Analyzer plots should be manually evaluated for the following criteria: All rRNA peaks should be narrow and near symmetrically shaped and the baseline between peaks should be flat and close to 0.
- Alternatively, an RNA gel (1% agarose gel in TBE) can be used to assess RNA integrity, even though this method is less precise than using the Bioanalyzer/Fragment Analyzer. For high quality RNA samples from saprophytic growth two clear bands (rRNAs) and for in planta samples four bands should be seen, with almost no additional smear.
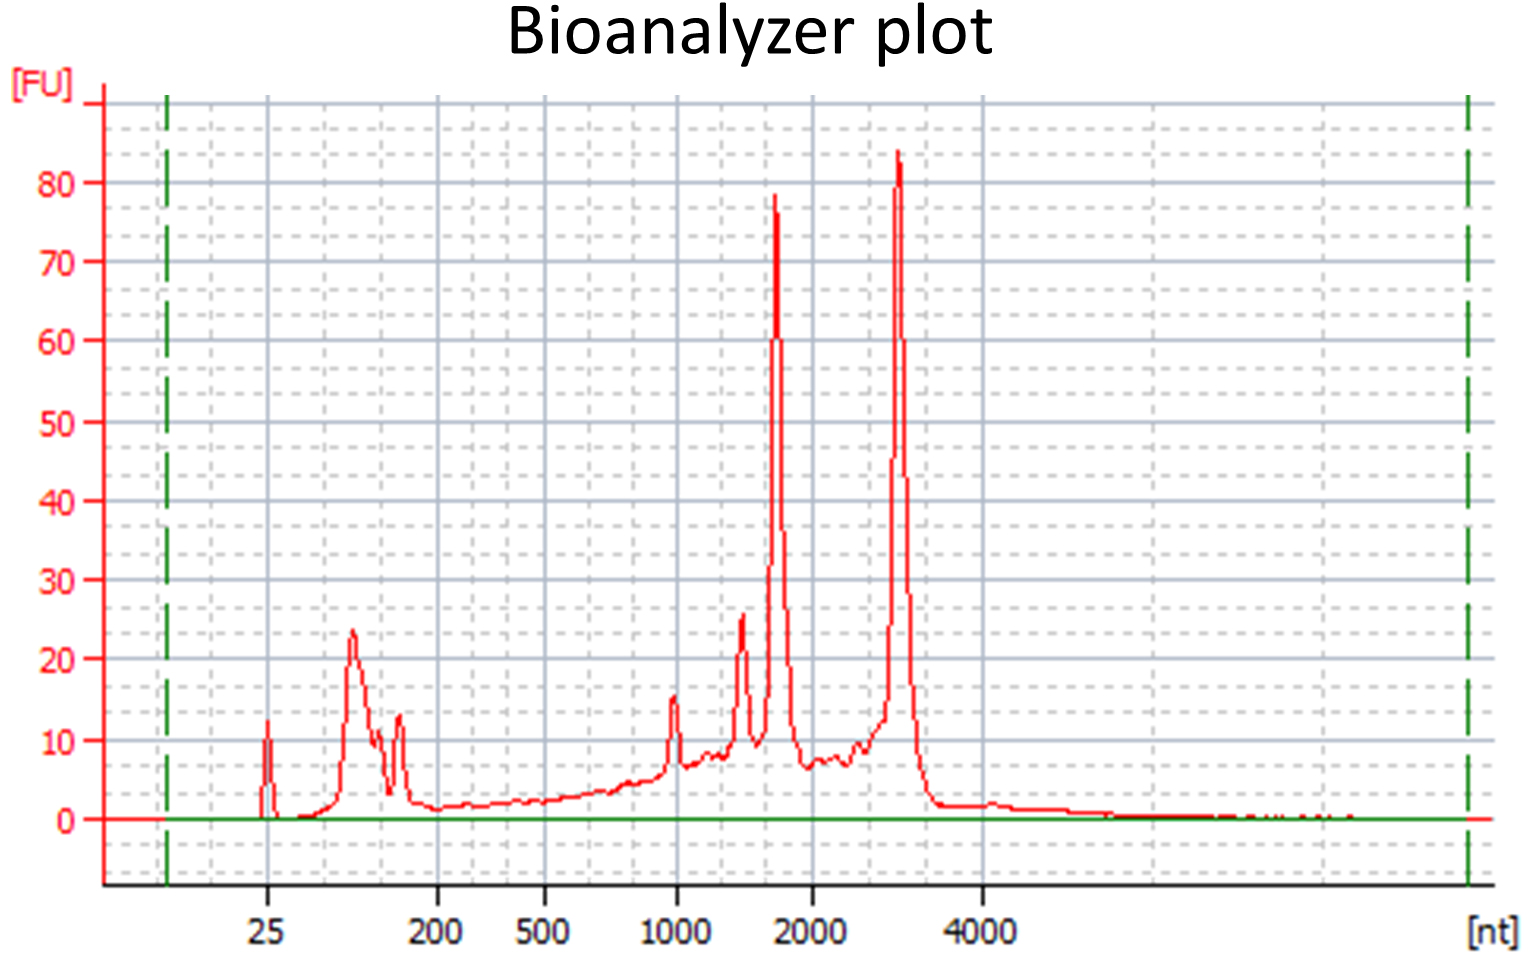
Figure 1. Bioanalyzer plot for a high quality RNA sample extracted from U. bromivora infected Brachypodium tissue - Library construction
- Before library preparation ribosomal RNA is removed from the samples using Ribo-Zero rRNA Removal Kit following manufacturer instructions.
- The libraries are prepared using the NEB Next Ultra RNA Library Prep Kit. Size selection is performed using Ampure XP beads. The Bioanalyzer/Fragment Analyzer is used to test the size distribution of the libraries, followed by qPCR to determine the correct concentration needed for cluster generation.
- The libraries are sequenced in paired end mode (PE125), using an Illumina HiSeq2500 instrument.
Notes: - An important consideration, when deciding on the sequencing depth, is sufficient coverage of pathogen transcripts in libraries derived from infected host tissue (see Notes).
- We sequenced the in planta samples to an average depth of 130,000,000 raw reads and the axenic culture samples to an average depth of 23,000,000 raw reads.
- The quality of the resulting reads is assessed using FastQC: Properties examined are the per-base quality to exclude sequencing problems like quality drop-off towards the end or failed cycles, kmer-distribution and overrepresented sequences to identify adapter dimers and short inserts and duplication rate to exclude overamplification or other library problems. Except for low amounts of reads showing Illumina adapter sequences on the 3’ end we did not experience any obvious problems. The adapter sequences are removed from the reads using cutadapt v1.4.2.
Data analysis
Figure 2 shows a flow diagram of the different steps involved in RNA-Seq data analysis, indicating the software tools used.
Figure 2. Workflow of RNA-Seq data analysis. Dark blue background: Input from lllumina RNA sequencing; Light blue: Sequencing quality control and read quantification; Green: Identification of differentially expressed genes; Orange: Three methods for over/under-representation analysis.
- Identification of differentially regulated genes
- The trimmed RNA-Seq reads are then quantified against the combined transcriptomes extracted from Brachypodium distachyon Bd21 (Bdistachyon_283_v2.1) and Ustilago bromivora UB1 annotations, with the Kallisto software, using default parameters. This constitutes a pseudo-alignment against the transcriptome. In cases where more than one splicing variant encoded by the same gene is identified (in our dataset 20 cases), the splicing variants can be treated and counted as individual genes in all subsequent analyses.
- Further analysis of the dataset can be conducted with the statistical environment R. For comparison of U. bromivora gene expression between the saprophytic and in planta growth conditions, only U. bromivora transcripts (i.e., those with a gene identifier starting with ‘UBRO’) are retained. Differential expression statistics are computed using the DESeq2 R package. To estimate the size factors between samples, the default assumption that the overall fungal expression levels are similar between all samples is used (estimateSizeFactors:type = ‘ratio’).
- Transcripts are considered significantly up- or downregulated in planta, if the log2-fold-change compared to axenic culture is > 2/< -2 and the Benjamini-Hochberg (Hochberg and Benjamini, 1990) corrected P-value is < 0.1.
Additionally, to reliably assess downregulation in planta despite the lower coverage of fungal reads in the in planta samples, we required an average of at least 150 reads for a transcript in the axenic samples to consider it in planta downregulated. (See more details in the Notes section).
- The trimmed RNA-Seq reads are then quantified against the combined transcriptomes extracted from Brachypodium distachyon Bd21 (Bdistachyon_283_v2.1) and Ustilago bromivora UB1 annotations, with the Kallisto software, using default parameters. This constitutes a pseudo-alignment against the transcriptome. In cases where more than one splicing variant encoded by the same gene is identified (in our dataset 20 cases), the splicing variants can be treated and counted as individual genes in all subsequent analyses.
- Over/Underrepresentation analysis
- To test over-/underrepresentation (ORA) of transcript classes of interest among the in planta up- and downregulated transcripts, one of the following strategies can be used depending on the situation:
- For user-defined lists of transcripts (e.g., in our case the list of transcripts encoding for predicted secreted proteins), over/underrepresentation of the given class among the lists of significantly responding transcripts compared to the representation of the class among all predicted or expressed transcripts can be calculated using Fisher exact test in the R statistical environment. The following code can be used:
input <- cbind(total=c(Nrtotal_secreted, Nrtotal non-secreted), in_planta_up=c(Nrin-planta up secreted, Nrin-planta up non-secreted))
fisher.test(input)
In the fisher.test() function the parameter alternative=”greater” or alternative=”less” can be added to test for only overrepresentation or only underrepresentation in cases where one of the two options can be precluded.
Nrtotal_secreted .. the number of transcripts encoding for predicted secreted proteins among all predicted or expressed transcripts
Nrtotal_non-secreted .. the number of transcripts encoding for predicted non-secreted proteins among all predicted or expressed transcripts
Nrin-planta up secreted .. the number of transcripts encoding for predicted secreted proteins among those transcripts identified to significantly upregulated in-planta compared to saprophytic growth
Nrin-planta up non-secreted .. the number of transcripts encoding for predicted non-secreted proteins among those transcripts identified to significantly upregulated in-planta compared to saprophytic growth. - To systemically test for overrepresentation of functional classes among the transcripts significantly up or down regulated in planta, the available FunCat classification and ORA workflow for the predicted U. bromivora transcripts http://mips.helmholtz-muenchen.de/funcatDB/index_update.html can be used.
- Alternatively, the following workflow can be used for all species, also when FunCat annotation is not available:
- Use of the Mercator online tool to generate a functional annotation in the Mapman format–predicted transcripts have to be submitted in FASTA format.
- Use of the Pageman tool (integrated in the Mapman software suit http://mapman.gabipd.org/web/guest/mapman) to conduct ORA. We used Fisher test statistics and the p-values were corrected for multiple testing by the Benjamini-Hochberg algorithm.
Notes
- All sequencing raw data (.bam files) as well as counts of each U. bromivora gene in each sample from our experiment published in Rabe et al. (2016) can be downloaded from GeneExpressionOmnibus (GEO: http://www.ncbi.nlm.nih.gov/geo/) under the accession number GSE87751.
- Considerations concerning sequencing depth of samples from pathogen infected host tissue: The required sequencing depth will depend on both, the proportion of pathogen RNA compared to host RNA and the expected expression level of genes of interest. These properties may vary, depending on the time point during the infection cycle and the tissue studied. A quantitative real time (qRT)-PCR pre-assay to compare host against pathogen genomic marker can help to evaluate the ratio between host versus pathogen cells.
Below we give some examples from our dataset that may help to estimate relevant properties and asses the reliability of expression differences observed for individual genes:
Despite obtaining on average in total approximately 103,500,000 map-able reads in the in planta samples and only 13,800,000 in the axenic culture samples, i.e., ~7.5x more total reads, the in planta samples contain only an average of ~175,000 U. bromivora reads, compared to ~14,000,000 fungal reads in the samples of fungus grown in axenic culture. We thus obtained an approximately 80x better coverage of the axenic stage. This corresponds to having ~600x more plant reads compared to fungal reads in the mixed samples, a similar ratio to what we get when directly comparing the plant and fungal reads in the mixed samples. Having 80x lower coverage means that a transcript expressed equally in axenic culture and in planta that obtains 80 reads in axenic culture would typically obtain only one read in planta. Therefore, to reliably assess whether a transcript for which no reads are found in planta is downregulated compared to axenic culture, sufficient reads are required in the axenic culture sample. We defined a threshold of at least 150 reads (roughly 2x the difference in coverage) in axenic culture, additional to a significant P-value for the DESeq2 analysis, to consider a transcript for which no reads were obtained in planta as significantly downregulated in planta. Applying these filters, we identified 888 U. bromivora transcripts for which downregulation in planta could not be reliably assessed due to insufficient coverage. - Suppliers and order numbers given for chemicals, consumables and instruments refer to the equipment used by us. In general, it can be exchanged for equivalent equipment from other suppliers.
Recipes
- Potato dextrose liquid medium (PD medium)
24 g/L potato dextrose broth in deionized water
Autoclaved - Soil mix
3:1:1:1 standard potting soil:perlite:silica sand:germination soil
Acknowledgments
This protocol is adapted from Rabe et al. (2016). We would like to thank all the people involved in the works for this protocol as well as the original publication that it is based upon. The research leading to these results received funding from the European Research Council under the European Union's Seventh Framework Programme (FP7/2007-2013)/ERC grant agreement no. [EUP0012 ‘Effectomics’], the Austrian Science Fund (FWF): [P27429-B22, P27818-B22, I3033-B22], and the Austrian Academy of Science (OEAW).
References
- Bosch, J. and Djamei, A. (2017). Isolation of Ustilago bromivora strains from infected spikelets through spore recovery and germination. Bio Protoc 7(14): e2392.
- Bray, N. L., Pimentel, H., Melsted, P. and Pachter, L. (2016). Near-optimal probabilistic RNA-seq quantification.v Nat Biotechnol 34: 525-527.
- Chomczynski, P and Sacchi, N. (2006). The single-step method of RNA isolation by acid guanidinium thiocyanate-phenol-chloroform extraction: twenty-something years on. Nat Protoc 1(2): 581-585.
- Hochberg, Y and Benjamini, Y. (1990). More powerful procedures for multiple significance testing. Stat Med 9(7): 811-818.
- Lohse, M., Nagel, A., Herter, T., May, P., Schroda, M., Zrenner, R., Tohge, T., Fernie, A. R., Stitt, M. and Usadel, B. (2014). Mercator: a fast and simple web server for genome scale functional annotation of plant sequence data. Plant Cell Environ 37(5): 1250-1258.
- Love, M. I., Huber, W. and Anders, S. (2014). Moderated estimation of fold change and dispersion for RNA-seq data with DESeq2. Genome Biol 15(12): 550.
- Martin, M. (2011). Cutadapt removes adapter sequences from high-throughput sequencing reads. EMBnet 17: 10-12.
- Rabe, F., Bosch, J., Stirnberg, A., Guse, T., Bauer, L., Seitner, D., Rabanal, F. A., Czedik-Eysenberg, A., Uhse, S., Bindics, J., Genenncher, B., Navarrete, F., Kellner, R., Ekker, H., Kumlehn, J., Vogel, J. P., Gordon, S. P., Marcel, T. C., Münsterkötter, M., Walter, M. C., Sieber, C. M., Mannhaupt, G., Güldener, U., Kahmann, R. and Djamei, A. (2016). A complete toolset for the study of Ustilago bromivora and Brachypodium sp. as a fungal-temperate grass pathosystem. eLife 5: 179-188.
- R Development Core Team. (2012). R: A language and environment for statistical computing. R Foundation for Statistical Computing.
- Ruepp, A., Zollner, A., Maier, D., Albermann, K., Hani, J., Mokrejs, M., Tetko, I., Güldener, U., Mannhaupt, G., Münsterkötter, M. and Mewes, H. W. (2004). The FunCat, a functional annotation scheme for systematic classification of proteins from whole genomes. Nucleic Acids Res 32(18): 5539-5545.
- Usadel, B., Nagel, A., Steinhauser, D., Gibon, Y., Bläsing, O. E., Redestig, H., Sreenivasulu, N., Krall, L., Hannah, M. A., Poree, F., Fernie, A. R and Stitt, M. (2006). PageMan: an interactive ontology tool to generate, display, and annotate overview graphs for profiling experiments. BMC Bioinformatics 7: 535.
Article Information
Copyright
![]() Czedik-Eysenberg et al. This article is distributed under the terms of the Creative Commons Attribution License (CC BY 4.0).
Czedik-Eysenberg et al. This article is distributed under the terms of the Creative Commons Attribution License (CC BY 4.0).
How to cite
Readers should cite both the Bio-protocol article and the original research article where this protocol was used:
- Czedik-Eysenberg, A. B., Rabe, F., Ekker, H., Czepe, C. and Djamei, A. (2017). Overrepresentation Analyses of Differentially Expressed Genes in the Smut Fungus Ustilago bromivora during Saprophytic and in planta Growth. Bio-protocol 7(15): e2426. DOI: 10.21769/BioProtoc.2426.
- Rabe, F., Bosch, J., Stirnberg, A., Guse, T., Bauer, L., Seitner, D., Rabanal, F. A., Czedik-Eysenberg, A., Uhse, S., Bindics, J., Genenncher, B., Navarrete, F., Kellner, R., Ekker, H., Kumlehn, J., Vogel, J. P., Gordon, S. P., Marcel, T. C., Münsterkötter, M., Walter, M. C., Sieber, C. M., Mannhaupt, G., Güldener, U., Kahmann, R. and Djamei, A. (2016). A complete toolset for the study of Ustilago bromivora and Brachypodium sp. as a fungal-temperate grass pathosystem. eLife 5: 179-188.
Category
Plant Science > Plant immunity > Host-microbe interactions
Plant Science > Plant immunity > Perception and signaling
Molecular Biology > DNA > Gene expression
Do you have any questions about this protocol?
Post your question to gather feedback from the community. We will also invite the authors of this article to respond.