- Protocols

- Articles and Issues
- For Authors
- About
- Become a Reviewer

Xanthoferrin Siderophore Estimation from the Cell-free Culture Supernatants of Different Xanthomonas Strains by HPLC


Published: Vol 7, Iss 14, Jul 20, 2017 DOI: 10.21769/BioProtoc.2410 Views: 9823
Reviewed by: Arsalan DaudiSrujana Samhita YadavalliBin Tian
Original research article
The authors used this protocol in:

Nov 2016
Advertisement


Protocol Collections
Comprehensive collections of detailed, peer-reviewed protocols focusing on specific topics


Related protocols
Abstract
Xanthomonads can scavenge iron from the extracellular environment by secreting the siderophores, which are synthesized by the proteins encoded by xss (Xanthomonas siderophore synthesis) gene cluster. The siderophore production varies among xanthomonads in response to a limited supply of iron where Xanthomonas campestris pv. campestris (Xcc) produces less siderophores than Xanthomonas oryzae pv. oryzae (Xoo) and Xanthomonas oryzae pv. oryzicola (Xoc). Siderophore production can be measured by HPLC and with the CAS (Chrome azurol S)-agar plate assay, however HPLC is a more accurate method over CAS-agar plate assay for siderophore quantification in Xanthomonads. Here we describe how to quantify siderophores from xanthomonads using HPLC.
Keywords: Xanthomonas siderophoresBackground
The Xanthomonas group of bacterial phytopathogens possess an xss (Xanthomonas siderophore synthesis) operon, which is required to produce xanthoferrin (an α-hydroxy carboxylate-type siderophore; similar to vibrioferrin) and to encode an outer membrane receptor involved in the siderophore-mediated iron uptake (Pandey and Sonti, 2010; Pandey et al., 2016a and 2016b). Siderophores are small iron-chelating compounds secreted by bacteria to utilize the insoluble form of iron (Neilands, 1995). For the past three decades, CAS (Chrome azurol S)-agar plate assay has been mostly employed to measure bacterial siderophores by monitoring the halo formation around bacterial colonies (Schwyn and Neilands, 1987; Pandey and Sonti, 2010). However, the above assay cannot reliably be used to quantify siderophores from bacteria which also secrete organic acids (e.g., oxalic acid, citric acid, and isocitric acids) along with siderophores, as the organic acids are capable of chelating iron from CAS dye to compromise the accuracy to quantify siderophore (Rai et al., 2015). Since the above mentioned assay only gives the idea about the bacterial siderophore production qualitatively, hence HPLC-mediated siderophore quantification is a better method than the CAS-agar plate assay for bacteria that produce both siderophores along with organic acids; such as Xanthomonas species (Rai et al., 2015; Pandey et al., 2016a and 2016b).
Materials and Reagents
- Pipette tips (Corning, Axygen®, catalog numbers: TF-300-R-S , TF-200-R-S , and TF-1000-R-S )
- Culture tubes (Borosil, catalog number: 9800U06 )
- Petri dishes (Tarson Products, catalog number: 460140-140MM )
- Stericup® filter units with 0.22 μm porosity (EMD Millipore, catalog number: SCGPU02RE )
- Centrifuge tubes: 500 ml, 50 ml, 15 ml, 2 ml, and 1.5 ml (Tarson Products, Kolkata, India)
- Cork borer, 8 ± 0.2 mm (HiMedia Laboratories, catalog number: LA737 )
- Syringe driven filter unit with 0.22 μm porosity (Millex®-GS) (EMD Millipore, catalog number: SLGS033SS )
- Xanthomonas campestris pv. campestris 8004, X. oryzae pv. oryzicola BXOR1, X. oryzae pv. oryzae (Indian isolate) and ∆xssA mutant in Xanthomonas siderophore synthesis gene A (Lab collections)
- Rifampicin
- 2,2’-dipyridyl (DP) (Sigma-Aldrich, catalog number: 14453 )
Note: This product has been discontinued.
- Amberlite XAD16N, 20-60 mesh (Sigma-Aldrich, catalog number: XAD16-1KG )
- Methanol (Thermo Fisher Scientific, catalog number: Q32407 )
- Standard vibrioferrin (Fujita et al., 2011; see Notes 2 and 3)
- Trifluoroacetic acid (TFA) (Sigma-Aldrich, catalog number: T6508-25ML )
- Acetonitrile (CH3CN) (Sigma-Aldrich, catalog number: 34888-1L )
Note: This product has been discontinued.
- Peptone (HiMedia Laboratories, catalog number: CR001 )
- Sucrose (HiMedia Laboratories, catalog number: GRM601-500G )
- Sodium hydroxide (NaOH) (Sigma-Aldrich, catalog number: 221465 )
- Chrome Azural S (CAS) (Merck, catalog number: 1.02477.0025 )
- Ferric chloride (FeCl3) (Standard Reagents, catalog number: SRCF005C )
- Hydrochloric acid (HCl) (Fisher Scientific, catalog number: 29507 )
- Hexadecyltrimethylammonium bromide (HDTMA) (Sigma-Aldrich, catalog number: H6269-250G )
- BactoTM agar (BD, BactoTM, catalog number: 214010 )
- BactoTM peptone (BD, BactoTM, catalog number: 211677 )
- Agar (HiMedia Laboratories, catalog number: RM026-500G )
- Peptone-sucrose (PS) medium (Tsuchia et al., 1982; see Recipes)
- CAS solution (Schwyn and Neilands, 1987; see Recipes)
- Peptone-sucrose-agar (PSA) medium (see Recipes)
- PSA-CAS-DP plate (see Recipes)
Equipment
- Conical flasks: 500 ml (Vensil Glass Works, catalog number: 1161 )
- Conical flasks: 2,000 ml (Borosil, catalog number: 4980030 )
- Micro-pipettes (Eppendorf, catalog number: EPPR4396 )
- Shaking incubator (Eppendorf, New BrunswickTM, model: Innova® 43 )
- SORVALL RC-5B PLUS Superspeed centrifuge (Thermo Fisher Scientific, Waltham, MA, USA)
- pH meter (Thermo Fisher Scientific, Thermo ScientificTM, catalog number: EC-PH510/11S )
- Agilent 1100 series HPLC system (Agilent Technologies, model: Agilent 1100 Series )
- Agilent C-18 (4.6 mm x 250 mm x 5 μm) column (Agilent Technologies, Santa Clara, CA, USA)
- Burette (BOROSIL, catalog number: 2123016 ), burette support stand and clamps
- Vacuum concentrator plus (Eppendorf, model: Concentrator Plus , catalog number: 5305000304)
- Millipore vacuum, pressure pump (EMD Millipore, catalog number: XI04 220 50 )
- Autoclave
Software
- ChemStation Software; Rev. A.10.02 [1757] (Agilent, Santa Clara, CA, USA)
- Microsoft Office Excel 2013 (Microsoft Corporation, Redmond, USA)
Procedure
- Preparation of the cell-free culture supernatant
- Streak the bacterial strain from its glycerol stock on a PSA plate containing rifampicin (50 μg/ml) and incubate in a static incubator at 28 °C for 2-3 days. To start a primary culture, transfer a single colony from the above mentioned plate to an autoclaved culture tube containing 3 ml fresh PS medium (see Recipes) with rifampicin (50 μg/ml). The primary culture of Xanthomonas can be grown to late-exponential growth (OD600 ~1.0) phase at 28 °C and 200 rpm in shaking incubator for 16-20 h.
- Start a secondary culture by using 0.2% inoculum (2 ml) from the above primary culture into fresh PS medium (1 L) supplemented with the appropriate amount of 2,2’-dipyridyl (150 μM for X. campestris pv. campestris str. 8004, 100 μM for X. oryzae pv. oryzae, and 50 μM for X. oryzae pv. oryzicola). Incubate the secondary culture in a 28 °C incubator with shaking at 200 rpm for 48 h.
- Centrifuge the bacterial cultures at 17,000 x g for 1 h at 4 °C to pellet cells and exopolysaccharides.
- To remove the remaining cells from the supernatant, filter the supernatant with Stericups (pore size 0.22 μm) and a vacuum pressure pump.
- Adjust pH to 2.0 with concentrated HCl (6 N) to reduce the solubility of siderophore in water (Rey et al., 1996).
- Streak the bacterial strain from its glycerol stock on a PSA plate containing rifampicin (50 μg/ml) and incubate in a static incubator at 28 °C for 2-3 days. To start a primary culture, transfer a single colony from the above mentioned plate to an autoclaved culture tube containing 3 ml fresh PS medium (see Recipes) with rifampicin (50 μg/ml). The primary culture of Xanthomonas can be grown to late-exponential growth (OD600 ~1.0) phase at 28 °C and 200 rpm in shaking incubator for 16-20 h.
- Column chromatography using XAD-16 resin columns
- Prepare a 2.4 x 30 cm column by packing 220 g of Amberlite XAD-16 polymeric resin.
Note: Prepare the Amberlite resin by soaking in water overnight on the day before the column is needed.
- Wash the packed column with two-times the bed-volume (440 ml) of methanol and equilibrate the column with three-times the bed-volume (660 ml) of sterile MilliQ water.
- Pass the cell-free bacterial supernatant (Procedure A; step A5) through the equilibrated XAD-16 resin column (see Note 7).
- Elute with 200 ml methanol and collect approximately 100 fractions (~2 ml each) in 2.0 ml centrifuge tubes (see Note 7; Figure 1).
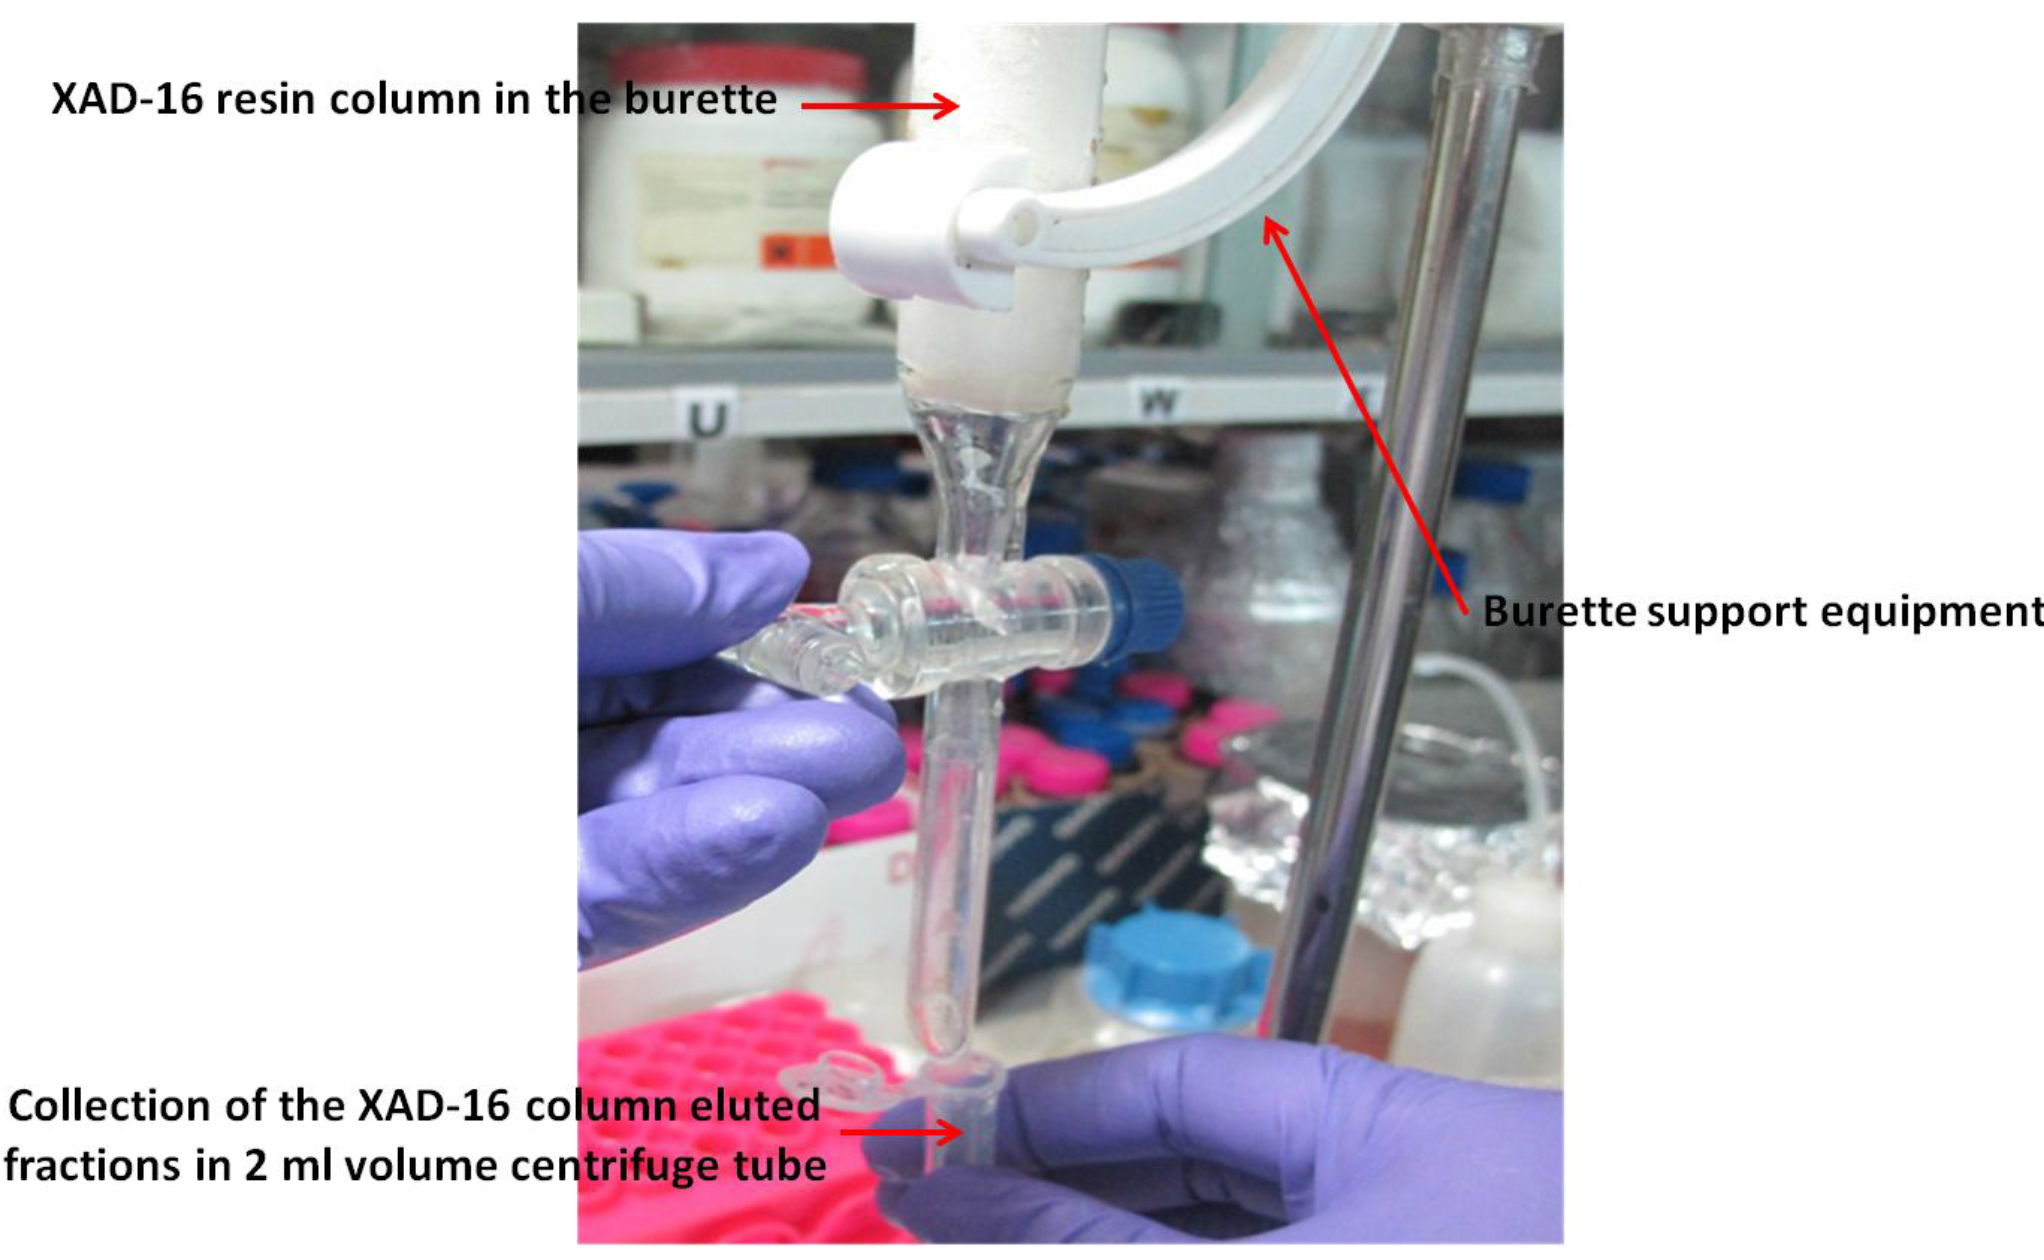
Figure 1. Xad-16 resin column (prepared in the burette) with burette support equipment for the collection of different fractions of the elute for xanthoferrin siderophores
- Prepare a 2.4 x 30 cm column by packing 220 g of Amberlite XAD-16 polymeric resin.
- CAS-Plate assay
- Prepare a PSA-CAS-DP plate (see Recipes).
- Punch several holes in the plate with a sterile cork borer keeping approximately 2.5 cm distance between the holes.
- Put approximately 250 μl of each fraction (according to elution order, Procedure B; step B4) into separate holes, placed upright with the lid on top, and incubate at 28 °C in a static incubator.
- Observe the activity of the fractions after 24 h.
- The characteristic, yellow-colored haloes (haloes 13-24) indicate the presence of siderophores while blue- and red-colored haloes (haloes 1-12) indicate the presence of organic acids (Figure 2).
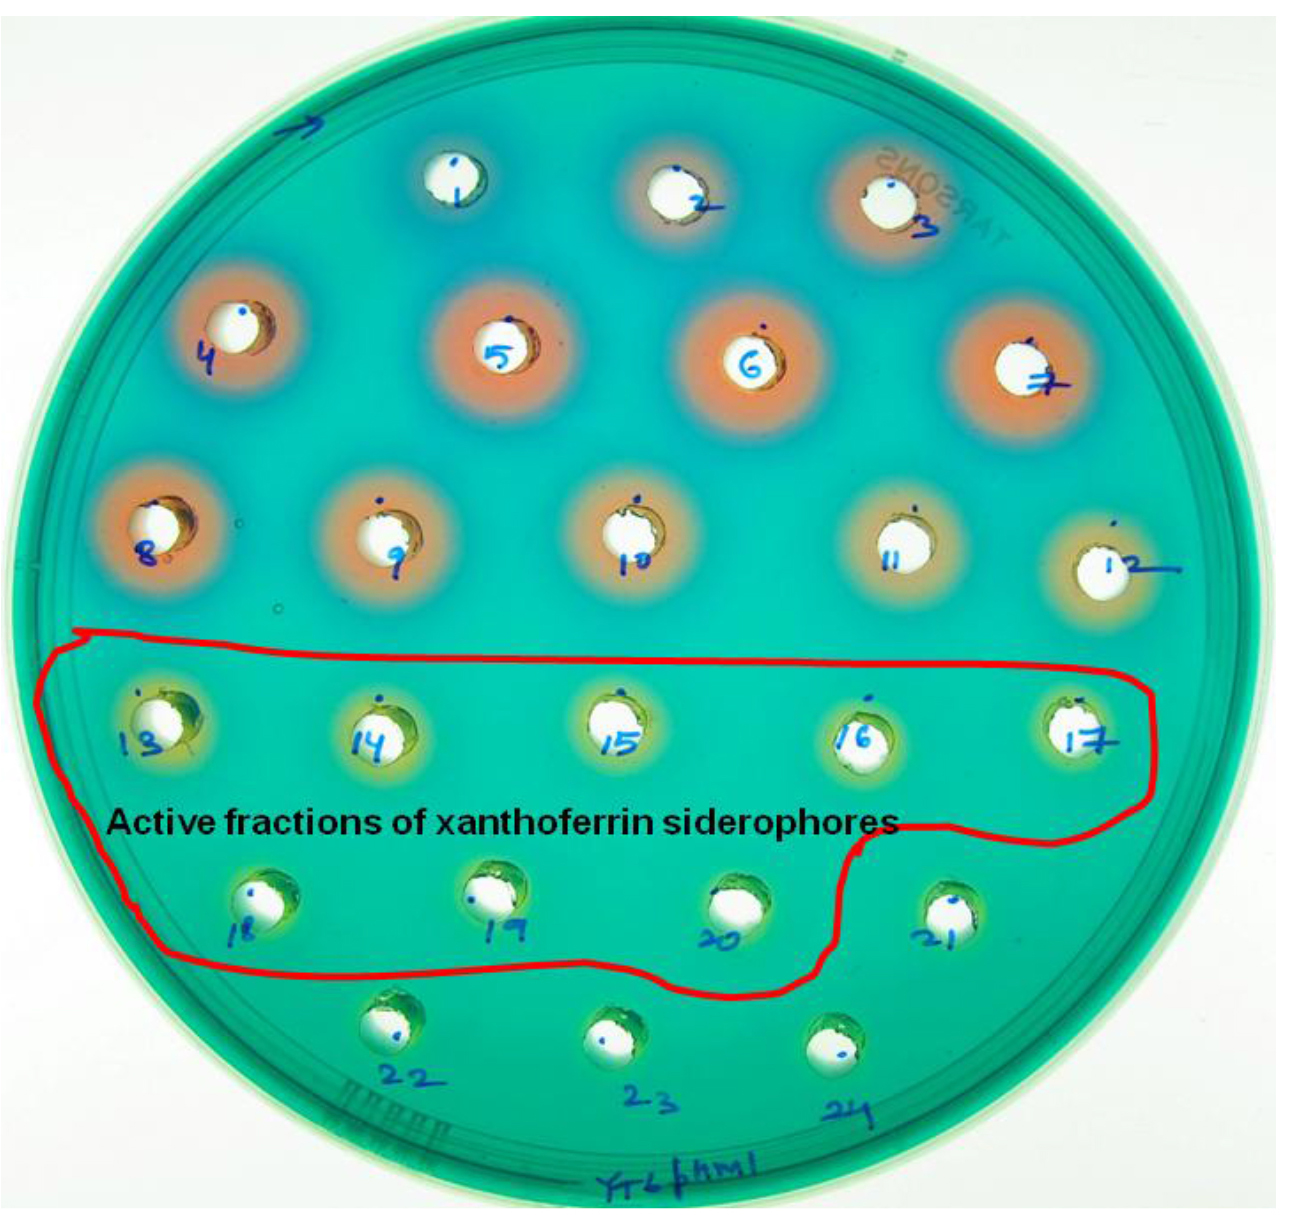
Figure 2. A PSA-CAS-DP plate with multiple holes representing different colored haloes formation after 24 h incubation with different fractions of the eluate (separated by XAD-16 resin column) for siderophore isolation from X. oryzae pv. oryzicola. Blue- and red-colored haloes (haloes 1-12) indicate the fractions with organic acids while yellow-colored haloes (haloes 13-24) indicate the fractions with xanthoferrin siderophores.
Notes:- We have not taken the 21st-24th fractions of the siderophore elutes for HPLC run. Because we have already observed there was negligible amount of siderophores present in those fractions in comparison to the presence of other impurities which create more noise during the HPLC run. Addition of those fragments for the HPLC run along with the active fragments (13th-20th) would have increased the impurity level to more extent without significantly increasing the total amounts of the siderophores in the sample. Note that Student’s t-test (paired) was used to analyze extent of contribution for those fractions towards the impurity levels and siderophore amounts in the main active fractions (13th-20th) for HPLC run.
- In order to minimize the extent of interference (after heat and trial methods) due to other unwanted ingredients present in the fractions corresponding to the halos 21-24, only the active fractions of the siderophores corresponding to the haloes 13-20 should be collected from their respective remaining main stocks (~1.75 ml each) for HPLC quantification.
- We have not taken the 21st-24th fractions of the siderophore elutes for HPLC run. Because we have already observed there was negligible amount of siderophores present in those fractions in comparison to the presence of other impurities which create more noise during the HPLC run. Addition of those fragments for the HPLC run along with the active fragments (13th-20th) would have increased the impurity level to more extent without significantly increasing the total amounts of the siderophores in the sample. Note that Student’s t-test (paired) was used to analyze extent of contribution for those fractions towards the impurity levels and siderophore amounts in the main active fractions (13th-20th) for HPLC run.
- Prepare a PSA-CAS-DP plate (see Recipes).
- HPLC quantification
- Pool all the active fractions (corresponding to haloes 13-20) from Procedure B; step B4 into a 15 ml centrifuge tube that display characteristic yellow haloes on the PSA-CAS-DP plate (Procedure C; step C5).
- To remove the solvent, dry the sample completely using a vacuum concentrator (at 30 °C in alcohol mode).
- Reconstitute in 1 ml methanol and filter with a syringe driven filter unit with 0.22 μm pore size.
- Inject the recommended volume of filtered sample for each strain (25 μl for X. campestris pv. campestris, and 10 μl for X. oryzae pv. oryzicola and X. oryzae pv. oryzae) into the Agilent 1100 series HPLC system (Figures 3A-3B).
- Achieve the separation with Agilent C-18 column (4.6 mm x 250 mm x 5 μm) using gradient: A = H2O/0.1% TFA, B = CH3CN/0.1% TFA; 0-30% B in 10 min, 30-45% B in 15 min, 45-0% B in 20 min at a flow rate of 1 ml/min.
- Make the standard curve, draw trendline, and get equation (using Microsoft Excel) from either known amounts of vibrioferrin (Fujita et al., 2011) or xanthoferrin versus their respective peak areas obtained by HPLC chromatograms (see Notes 1, 2 and 3).
- Calculate the amount of xanthoferrin siderophores (present in the unknown sample) from the formula obtained either by standard vibrioferrin or xanthoferrin.
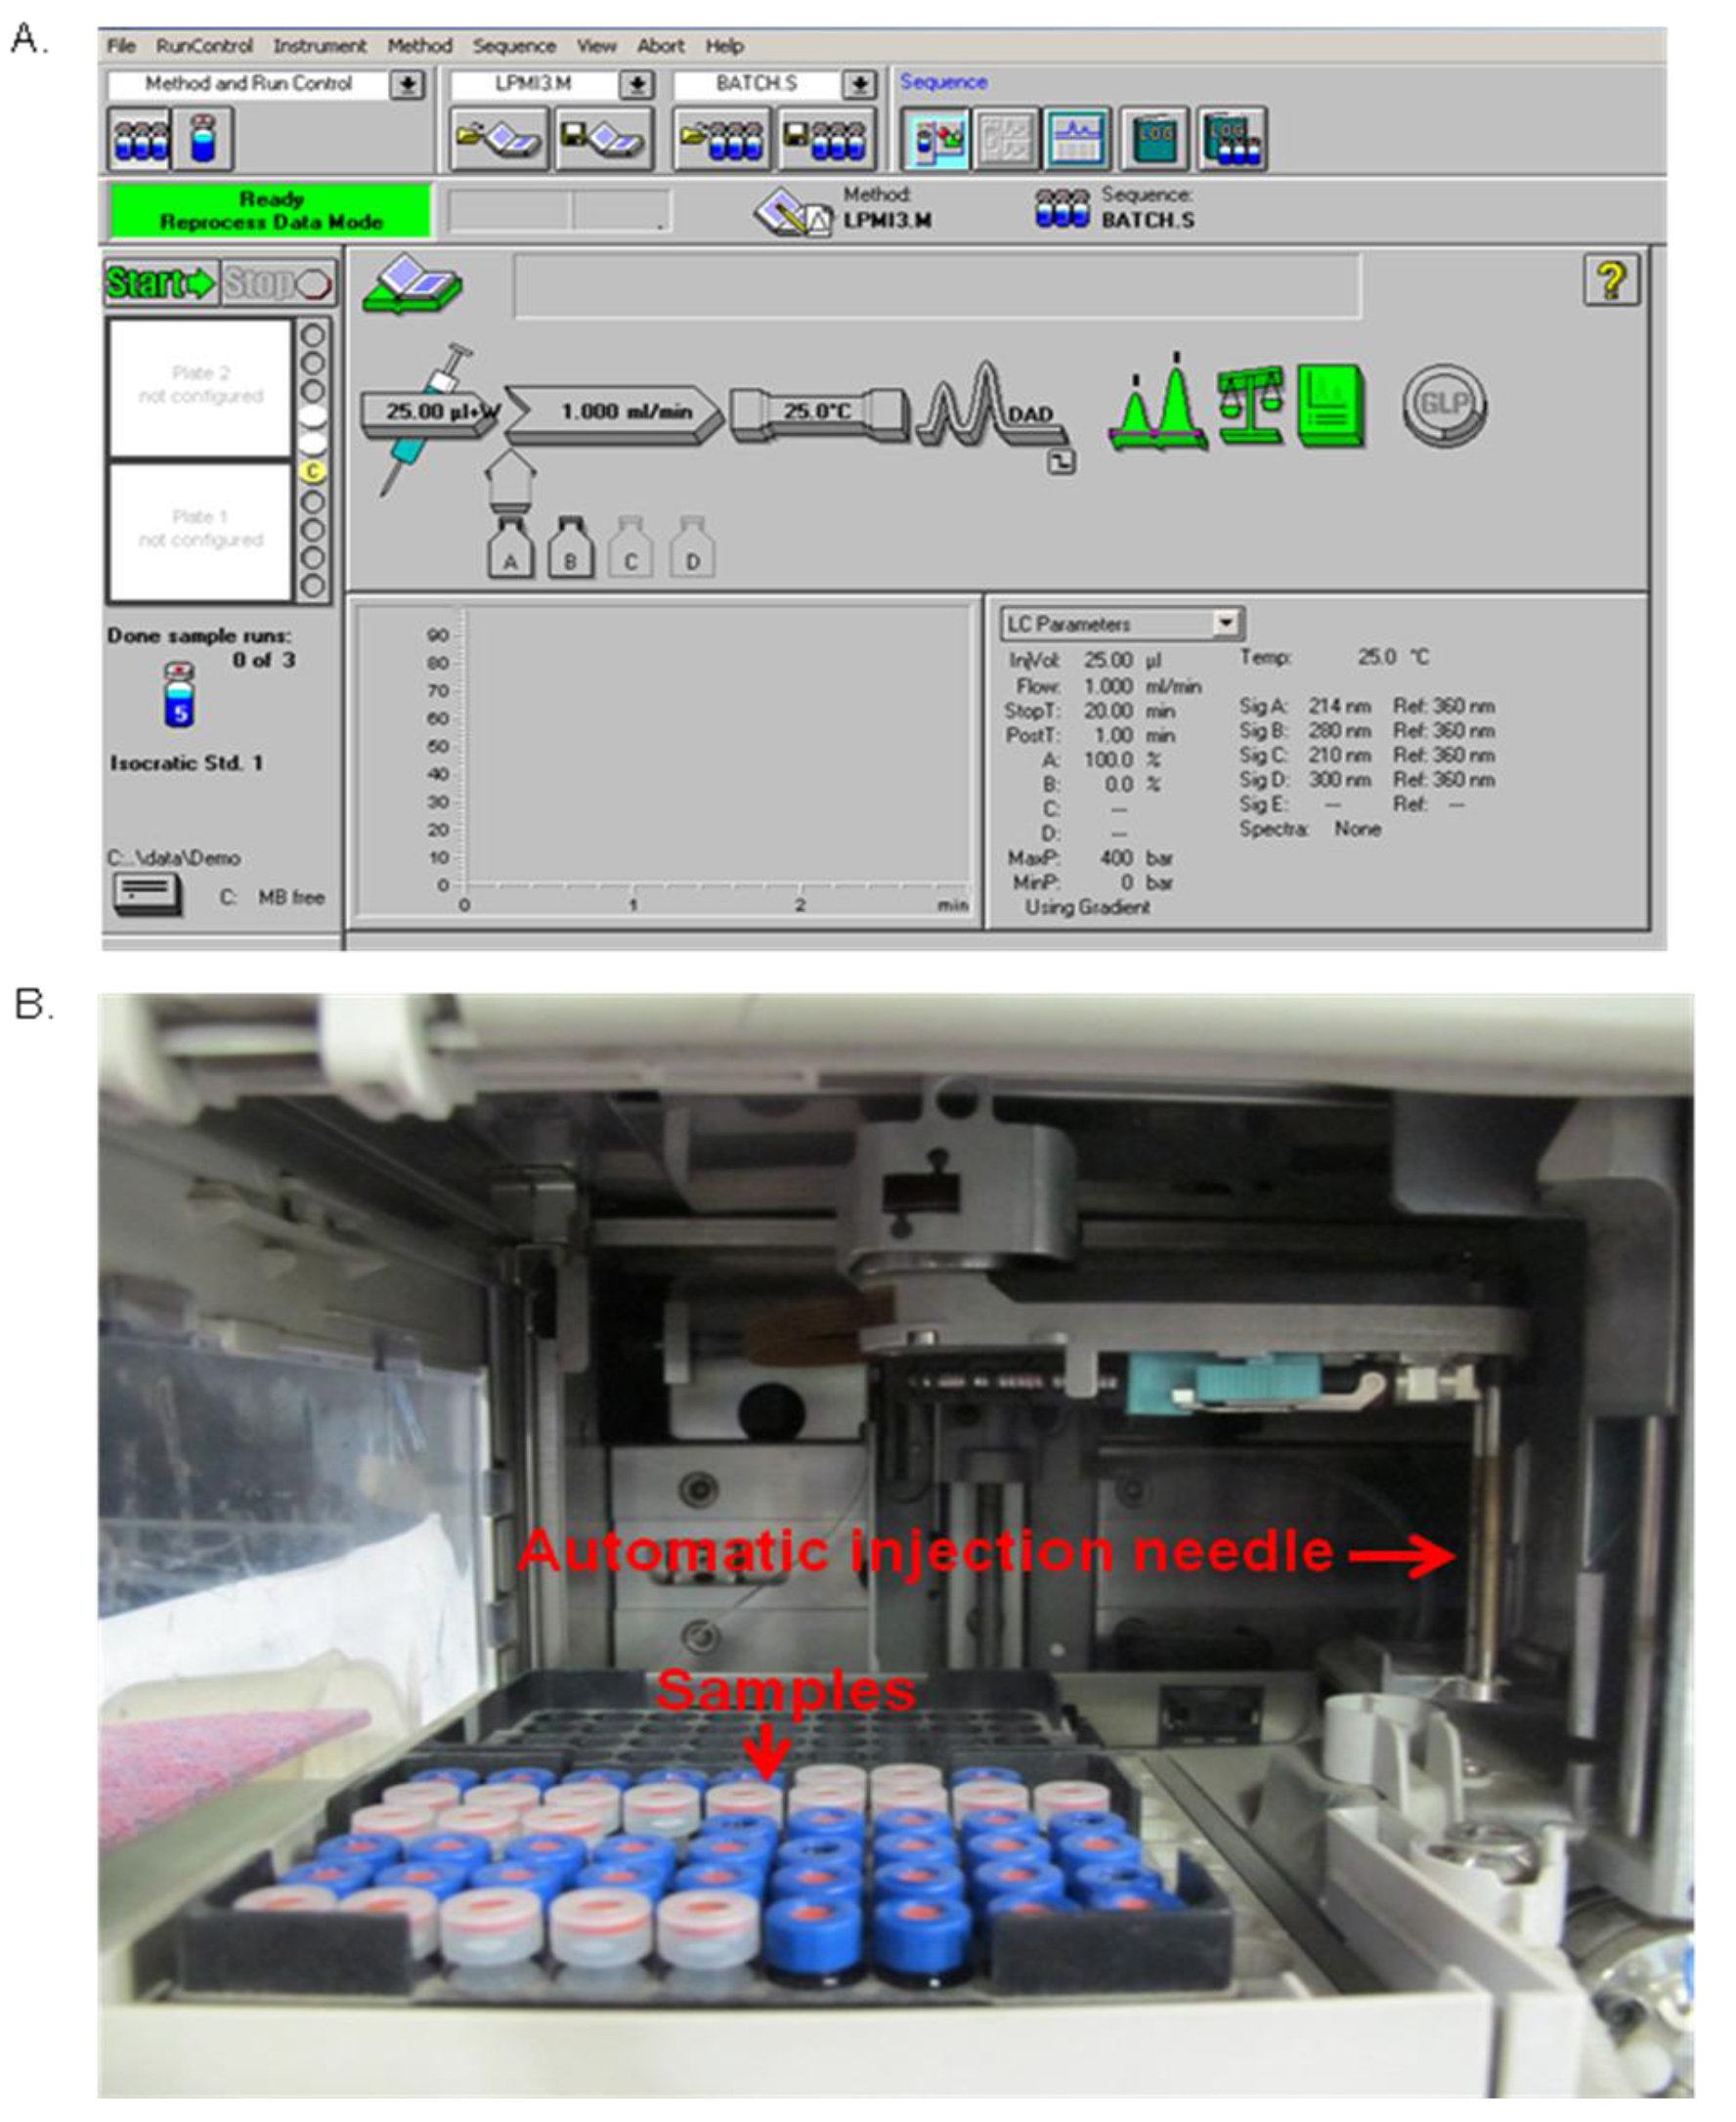
Figure 3. HPLC program and instrument. A. HPLC program in ChemStation Software; Rev. A.10.02 [1757]. B. A part of HPLC machine indicating samples orientation and automatic injection needle.
- Pool all the active fractions (corresponding to haloes 13-20) from Procedure B; step B4 into a 15 ml centrifuge tube that display characteristic yellow haloes on the PSA-CAS-DP plate (Procedure C; step C5).
Data analysis
Load HPLC signals of sample (Procedure D; step D5) and blank (empty buffer elute from the XAD-16 resin column) to the offline mode of ChemStation software. Subtract the blank signal from sample signal and then auto-integrate to automatic identification of peaks. Record the RT (Retention Time) values and peak areas generated in the dialogue box. The pure xanthoferrin signals can be observed while monitoring the missing peak in the HPLC chromatogram of isolated siderophores from ∆xssA mutant of Xanthomonas spp. in comparison to their respective wild-type. From the active fractions of the xanthoferrin, the purest fraction can be isolated, vacuum-dried, weighed and utilized as ‘standard xanthoferrin’ for plotting the standard curve by taking different known amounts for HPLC runs. Draw the standard curve of xanthoferrin by plotting the ‘amounts vs. average peak areas’ obtained after respective HPLC runs (Figure 4). Determine the amount of unknown sample xanthoferrin siderophores using the standard curve. Validate the significance level in the difference, if any exists between the data obtained for two different sets, using a paired Student’s t-test.
Note: For one set of experiments, take at least three independent biological replicates.
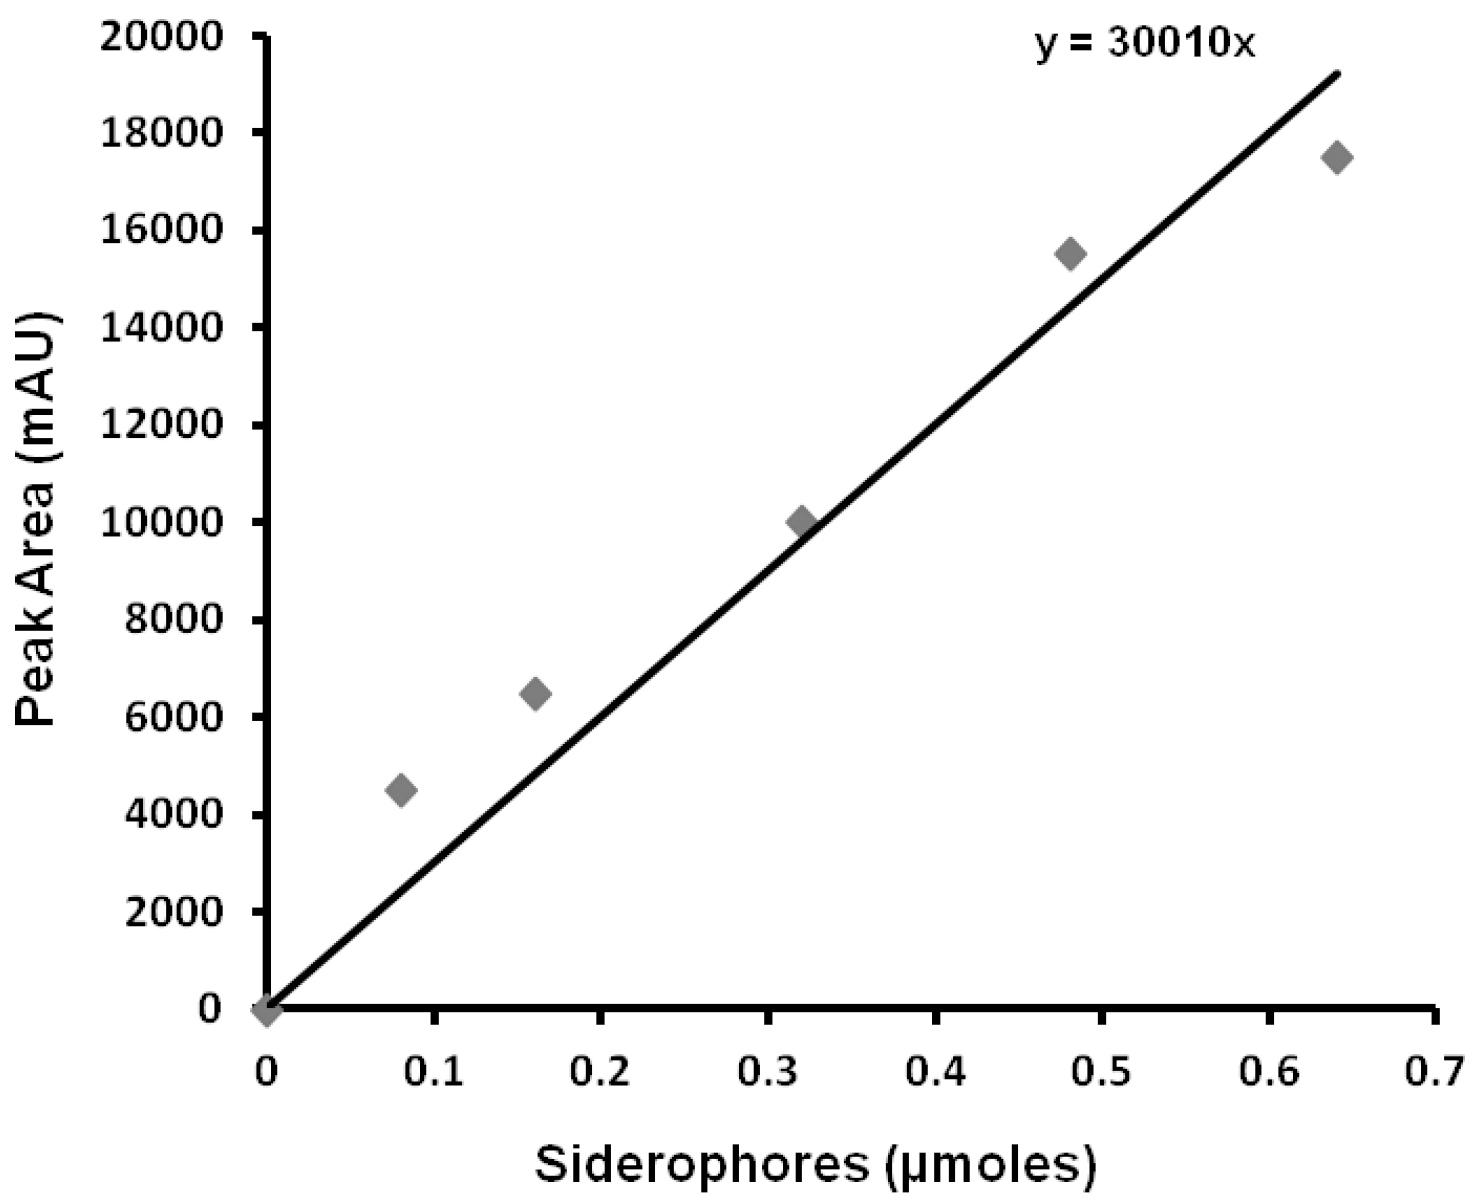
Figure 4. Xanthoferrin standard curve; displaying the equation for depicting the amount of siderophores used in the HPLC run for getting respective peak areas
Notes
- ∆xssA mutant can be used as negative control. Xanthoferrin peak will be absent or drastically reduced in the ∆xssA mutant strain. Corresponding to the missing peak of HPLC chromatogram for the siderophores isolated from ∆xssA mutant (Pandey et al., 2016a), pure xanthoferrin can be collected from a wild-type strain and used as a standard.
- Although the mass of siderophores can be determined directly by weighing dried xanthoferrin, it is preferable to create a standard curve for a large number of samples (> 5).
- Since we detected iron (III)-vibrioferrin complexes at 300 nm (retention time ~11 min), the isolated xanthoferrin siderophores are expected to present mostly as iron-siderophore complexes. Therefore it is preferable to prepare the standard curve using the iron-siderophore complex (1:1 ratio).
- Bacterial inoculation and CAS-plate assay should be performed in aseptic conditions.
- Since long term storage and frequent freeze-thaw cycles may cause degradation of xanthoferrin siderophores, it can be stored at 4 °C for a maximum period of 1 week.
- The concentration of 2,2’-dipyridyl can vary slightly (up to ± 25 μM) depending on the availability of iron as impurities in media components.
- Column preparation and chromatography should be carried out at room temperature. Chromatography steps (washing, equilibration and elution) should be performed by gravity flow.
Recipes
- Peptone-sucrose (PS) medium
1% peptone (w/v)
1% sucrose (w/v)
Dissolve above reagents in MilliQ water
Adjust pH to 7.4 with 3 N sodium hydroxide and autoclave at 121 °C and 15 psi for 20 min
- CAS solution
- 0.06 g Chrome Azurol S dye in 50 ml MilliQ water
- Fe(III) solution: 10 ml
1 mM FeCl3
10 mM HCl
- 0.072 g HDTMA in 40 ml MilliQ water
- Make all three solutions separately, then mix together and autoclave at 121 °C and 15 psi for 20 min to sterilize
- Peptone-sucrose-agar (PSA) medium
1% BactoTM peptone (w/v)
1% sucrose (w/v)
Dissolve above reagents in MilliQ water adjust pH to 7.4 with 3 N sodium hydroxide, add 1.4% BactoTM agar (w/v; final), and autoclave at 121 °C and 15 psi for 20 min
- PSA-CAS-DP plate (for 140 mm plate)
60 ml melted PSA
2,2’-dipyridyl (75 μM for X. campestris pv. campestris and 50 μM for X. oryzae pv. oryzae and X. oryzae pv. oryzicola)
7.2 ml CAS solution
Acknowledgments
We acknowledge Dr. Masaki J. Fujita (Hokkaido University, Japan) for providing the pure vibrioferrin for this study. We extend the acknowledgement to a previous study from our lab (Rai, 2015), from where we have modified the siderophore estimation protocol for Xcc. This work was supported by funding to SC from DBT-India, CSIR-HRDG-India, DST-SERB-India and CDFD core funding. SSP was recipient of JRF and SRF from CSIR-India. PS and BS were recipients of JRF and SRF from UGC-India. RKV was recipient of JRF and SRF from DBT-India.
References
- Fujita, M. J., Kimura, N., Sakai, A., Ichikawa, Y., Hanyu, T. and Otsuka, M. (2011). Cloning and heterologous expression of the vibrioferrin biosynthetic gene cluster from a marine metagenomic library. Biosci Biotechnol Biochem 75(12): 2283-2287.
- Neilands, J. B. (1995). Siderophores: structure and function of microbial iron transport compounds. J Biol Chem 270(45): 26723-26726.
- Pandey, A. and Sonti, R. V. (2010). Role of the FeoB protein and siderophore in promoting virulence of Xanthomonas oryzae pv. oryzae on rice. J Bacteriol 192(12): 3187-3203.
- Pandey, S. S., Patnana, P. K., Lomada, S. K., Tomar, A. and Chatterjee, S. (2016a). Co-regulation of iron metabolism and virulence associated functions by iron and XibR, a novel iron binding transcription factor, in the plant pathogen Xanthomonas. PLoS Pathog 12(11): e1006019.
- Pandey, S. S., Patnana, P. K., Rai, R. and Chatterjee, S. (2016b). Xanthoferrin, the alpha-hydroxycarboxylate-type siderophore of Xanthomonas campestris pv. campestris, is required for optimum virulence and growth inside cabbage. Mol Plant Pathol.
- Rai, R., Javvadi, S. and Chatterjee, S. (2015). Cell-cell signaling promotes ferric iron uptake in Xanthomonas oryzae pv. oryzicola that contribute to its virulence and growth inside rice. Mol Microbiol 96(4): 708-727.
- Rey, F., Ferreira, M. A., Facal, P. and Machado, A. A. S. C. (1996). Effect of concentration, pH, and ionic strength on the viscosity of solutions of a soil fulvic acid. Can J Chem 74: 295-299.
- Schwyn, B. and Neilands, J. B. (1987). Universal chemical assay for the detection and determination of siderophores. Anal Biochem 160(1): 47-56.
- Tsuchia, K., Mew, T. W. and Wakimoto, S. (1982). Bacteriological and pathological charecteristics of wild types and induced mutants of Xanthomonas campestris pv. oryzae. Phytopathology 72: 43-46.
Article Information
Copyright
© 2017 The Authors; exclusive licensee Bio-protocol LLC.
How to cite
Pandey, S. S., Singh, P., Samal, B., Verma, R. K. and Chatterjee, S. (2017). Xanthoferrin Siderophore Estimation from the Cell-free Culture Supernatants of Different Xanthomonas Strains by HPLC. Bio-protocol 7(14): e2410. DOI: 10.21769/BioProtoc.2410.
Category
Microbiology > Microbe-host interactions > Bacterium
Plant Science > Plant immunity > Host-microbe interactions
Biochemistry > Lipid > Extracellular lipids
Do you have any questions about this protocol?
Post your question to gather feedback from the community. We will also invite the authors of this article to respond.