- Protocols

- Articles and Issues
- For Authors
- About
- Become a Reviewer

Measuring Cyanobacterial Metabolism in Biofilms with NanoSIMS Isotope Imaging and Scanning Electron Microscopy (SEM)
Published: Vol 7, Iss 9, May 5, 2017 DOI: 10.21769/BioProtoc.2263 Views: 10267
Reviewed by: Claudia CatalanottiAnonymous reviewer(s)
Original research article
The authors used this protocol in:
May/Jun 2016
Advertisement


Protocol Collections
Comprehensive collections of detailed, peer-reviewed protocols focusing on specific topics


Related protocols
Abstract
To advance the understanding of microbial interactions, it is becoming increasingly important to resolve the individual metabolic contributions of microorganisms in complex communities. Organisms from biofilms can be especially difficult to separate, image and analyze, and methods to address these limitations are needed. High resolution imaging secondary ion mass spectrometry (NanoSIMS) generates single cell isotopic composition measurements, and can be used to quantify incorporation and exchange of an isotopically labeled substrate among individual organisms. Here, incorporation of cyanobacterial extracellular organic matter (EOM) by members of a cyanobacterial mixed species biofilm is used as a model to illustrate this method. Incorporation of stable isotope labeled (15N and 13C) EOM by two groups, cyanobacteria and associated heterotrophic microbes, are quantified. Methods for generating, preparing, and analyzing samples for quantifying uptake of stable isotope-labeled EOM in the biofilm are described.
Keywords: Stable isotopesBackground
Stable isotope labeling combined with NanoSIMS (‘NanoSIP’) is an established method to quantify incorporation of stable isotope labeled substrates into individual microbial cells, which can then be extrapolated to estimate incorporation for a population of cells (for example, Lechene et al., 2006 and Woebken et al., 2012). Tracing multiple stable isotope labels (e.g., 13C and 15N) into individual cells can be used to examine differential incorporation between treatments over time (for example, Popa et al., 2007 and Stuart et al., 2016a). Biofilms present specific challenges to quantifying incorporation of label. Since individual organisms are embedded in an extracellular matrix and have a diverse range of cell sizes and shapes, cell counts and biomass calculations are difficult. Additionally, polymeric labeled substrates, such as EOM, can adhere to the matrix and cell surfaces, so unincorporated label needs to be accounted for. Imaging-based methods such as NanoSIMS, paired with SEM and fluorescence microscopy, are well-suited to address these challenges because cell sizes and unincorporated label can be identified. Here, we describe methods to address these challenges in order to quantify the incorporation of labels (13C and 15N) from a polymeric substrate (EOM) into a photosynthetic biofilm. EOM is extracellular material that is loosely associated with cells, and is separated from the cells in the biofilm. One drawback of this method is that biofilm spatial structure (the extracellular matrix) is not preserved. If the examination of spatial arrangements is desired, embedding and sectioning of the biofilm samples may be necessary (for example, Lechene et al., 2006).
Materials and Reagents
- Sterile cell scrapers (VWR, catalog number: 89260-224 or 89260-222 )
Note: The product “ 89260-224 ” has been discontinued. - 0.2 µm syringe filters (polyethersulfone membranes, e.g., Pall, catalog number: 4652 )
- Pipet tip
- 1.7 ml microcentrifuge tubes
- Sterile syringes
- Silicon (Si) wafers, sized to fit NanoSIMS holder (e.g., 5 x 5 mm, Ted Pella, catalog number: 16008 )
- Sterile tissue grinder (Fisher Scientific, catalog number: 02-542-08 )
- Biofilm culture
Note: We examined a unicyanobacterial mixed species biofilm, however, the protocol is suitable for analysis of most biofilm types, provided that an aqueous substrate can be added to the sample, with even distribution. A detailed description of our biofilms and culturing procedures can be found in Stuart et al., 2016a. - Stable isotope labeled compound appropriate to support growth, or metabolism, of organism(s) of interest (e.g., 99 atom percent excess [atm%] 13C-NaHCO3, Cambridge Isotope Laboratories, catalog number: CLM-441-1 )
- Appropriate defined medium for growth (e.g., modified artificial seawater base [ASN] medium, described in Stuart et al., 2016a)
- 50% ethanol (EtOH)
- 37% formaldehyde solution (Sigma-Aldrich, catalog number: 252549 )
- 10x phosphate buffered saline (Sigma-Aldrich, catalog number: P5493 )
- Sodium chloride (NaCl)
- Sterile MilliQ water
- 4% PFA (see Recipes)
- Sterile 10% sodium chloride (NaCl) solution (see Recipes)
- Modified artificial seawater base (ASN) medium recipe (with nitrate) (see Recipes)
Equipment
- Dounce homogenizer (WHEATON, catalog number: 357546 )
- Microcentrifuge, capable of variable rpm generating up to 15,000 x g
- Isotope-ratio mass spectrometer (e.g., ANCA-IRMS, PDZE Europa Limited, Crewe, England)
- Chambers for biofilm cultivation (e.g., Pyrex sealable flasks, Corning, PYREX®, catalog number: 4985-1L )
- Incubator (as appropriate for cultivating the organism of interest)
- Dissecting microscope (e.g., Fisher Scientific, model: Fisher ScientificTM 420 Series , catalog number: 11-350-124)
- Desiccator cabinet (e.g., Thermo Fisher Scientific, Thermo ScientificTM, catalog number: 5317-0070 )
- Epifluorescence light microscope (e.g., Leica Microsystems, model: Leica DMI600B )
- Diamond or carbide scribe (e.g., Ted Pella, catalog number: 54412 )
- Gold (or other conductive metal) sputter coater (e.g., Cressington, model: Sputter Coater 108 )
- NanoSIMS 50 or 50 L (AMETEK, Cameca, model: NanoSIMS 50 or NanoSIMS 50 L )
- Scanning electron microscope (SEM) with better than 50 nm resolution and micrograph recording capability (e.g., FEI, model: FEI Inspect F SEM )
Software
- Ion image data processing software (e.g., LIMAGE, L. Nittler, Carnegie Institution of Washington, Washington, DC, USA; ImageJ with MIMS plugin; Look@NanoSIMS [Polerecky et al., 2012] or similar)
Procedure
- Rare isotope substrate generation, biofilm incubations, fixation and preparation on Si wafers
- Generate rare isotope enriched extracellular organic matter (EOM)
Note: Substrate for isotope labeling will depend on hypotheses being tested that are specific to the experiments conducted. Here, we describe generation of a polymeric rare isotope labeled substrate, EOM, but substrates may also be simple defined compounds (e.g., 13C-amino acids, glucose, bicarbonate, or 15N nitrate, ammonium). Substrate used will be dependent on hypotheses being tested. - Inoculate and grow a biofilm (or pure culture) in sealed flasks (with no headspace) to late exponential phase, with fresh media of similar composition to experimental conditions but where the growth substrate of interest is replaced by a rare isotope analog (e.g., ASN with 3 mM 13C sodium bicarbonate and 1.76 mM K15NO3).
Notes: - Biofilms are cultured without headspace in order to avoid CO2 (without 13C label) to equilibrate from the air into the medium, however, the 13C sodium bicarbonate will become depleted and will need to be refreshed over time. Frequency of addition of 13C sodium bicarbonate will depend on C-fixation rates of the biofilm. Our additions were made every 48 h.
- Maintaining biofilms in conditions to which they have been previously acclimated is recommended. In this case, biofilms were cultured with a 12:12 light:dark cycle at 23 °C and 20 μmol m-2 sec-1 light.
- Transfer the biofilm(s) an additional three times into the rare-isotope media at 1:50 dilution.
Note: The target biomass of late exponential biofilm for these cultures is 50-100 mg dry weight (in this case, 50 ml cultures, 3 weeks of growth). - Inoculate this rare-isotope-labeled culture into a larger volume fresh rare isotope media and grow to late exponential phase, at the volume(s) needed to generate approximately 1-5 g dry weight. Inoculum can be split into multiple flasks at this stage, ensuring equal inoculation of each culture. For our biofilms, this was achieved with four 500 ml flasks of cultures grown for 3 weeks.
- Harvest biofilm(s) and separate EOM (adapted from Jiao et al., 2010; Stuart et al., 2016b).
Note: Methods described here are specific to hypersaline filamentous cyanobacterium, ESFC-1, and will need to be tested and modified for different species. - Decant and discard media overlaying biofilm and transfer biofilm to sterile Dounce homogenizer. If biofilm is adherent, use sterile cell scraper.
- Add 1-2 ml sterile solution.
Note: For our hypersaline biofilms, 10% NaCl was used, and salt concentration chosen based on that of defined medium, (e.g., ASN). - Homogenize biofilm.
Note: This will require microscopic examination initially to ensure minimal cell lysis during homogenization. - Incubate homogenate for 15 min at 40 °C.
Note: This is to loosen the exopolysaccharides from the cells. This will require initial tests, such as microscopic examination, to ensure minimal cell lysis is occurring during this step. - Centrifuge homogenate at 15,000 x g at 4 °C for 20 min.
- Separate supernatant from cell pellet and filter through 0.2 µm syringe filter. Filtered supernatant is EOM. Store at -80 °C until use.
Note: Polyethersulfone membranes are recommended since they have low protein and polysaccharide binding. - Determine the bulk isotope ratio of cell pellet and EOM by isotope-ratio mass spectrometry (e.g., ANCA-IRMS, PDZE Europa Limited, Crewe, England).
- Inoculate cells into replicate preferred cultivation chambers, cultivate for biofilm development, measuring growth over time, a detailed description of growth conditions for our cyanobacterial biofilms can be found in Stuart et al., 2016b.
Notes:- Minimize volume of biofilm cultures as much as possible, while maintaining relevant conditions, to conserve use of stable isotope substrate (EOM, in this case), generated in step A1.
- To obtain quantitative measurements of elemental uptake (µg C or N fixed), biomass measurements for all biofilm community members are necessary. Microscopy of a subportion of the fixed biofilm may be used to generate biovolume measurements (Stuart et al., 2016b).
- A fully defined medium (e.g., ASN [Stuart et al., 2016a]) is recommended, in which all C and N sources are known, so that biofilm C and N budgets can be estimated.
- Minimize volume of biofilm cultures as much as possible, while maintaining relevant conditions, to conserve use of stable isotope substrate (EOM, in this case), generated in step A1.
- Add stable isotope labeled substrate(s) to naïve biofilm culture
- Add isotopically rare growth substrate (step A1) to unlabeled biofilm cultures (step A2).
- Control treatments should include (at minimum):
- Killed controls–fix biofilms with 4% PFA (see Recipes below) for 1 h prior to experiment start, rinse off fixative, then treat similarly to other live samples.
- Controls with no stable isotope added.
- Optional: other controls to address hypotheses regarding specific metabolisms (for example, in presence of specific inhibitors).
- Killed controls–fix biofilms with 4% PFA (see Recipes below) for 1 h prior to experiment start, rinse off fixative, then treat similarly to other live samples.
- At chosen time points, remove spent media from biofilm cultures.
Note: Time points are dependent on metabolic rates being targeted, and growth rates of test organisms. Our time points ranged from 1 h to 24 h, based on the growth rate of our organism (approximately 0.1 day-1) and bulk rates of C-fixation based on 13C-bicarbonate incorporation (IRMS measurements). - Optionally: Save spent media for further analysis–filter through 0.2 µm polyethersulfone syringe filters and freeze the filtrate at -80 °C.
- Add isotopically rare growth substrate (step A1) to unlabeled biofilm cultures (step A2).
- Fix tissues to preserve ultrastructure
- Add 4% PFA to biofilm tissues and incubate either 1 h at room temperature or overnight at 4 °C.
Note: Glutaraldehyde or ethanol are acceptable alternative fixatives. - Remove 4% PFA and rinse biofilms carefully a minimum of 3 times with sterile H2O.
Note: It is important to thoroughly remove salt and fixatives, as these interfere with NanoSIMS measurements. - Store biofilms in 50% EtOH, in enough volume to cover the biofilms, at -20 °C.
Note: Fixed biofilms can be stored under these conditions for up to a few years.
- Add 4% PFA to biofilm tissues and incubate either 1 h at room temperature or overnight at 4 °C.
- Prepare fixed biofilm samples for microanalysis and imaging
- Using a pipet tip, transfer a piece of fixed biofilm into a sterile tissue grinder containing 1 ml of sterile H2O.
- Grind gently to break up biofilm and transfer to a 1.7 ml microcentrifuge tube.
- Centrifuge at 10,000 x g for 1 min, remove supernatant and add 1 ml of sterile H2O. Repeat rinse process, remove supernatant and then resuspend in 10 µl of 50% EtOH. These steps help to remove excess extracellular organic matter that adheres to cell surfaces. This organic matter can interfere with NanoSIMS analysis of cellular uptake.
- For mixed species biofilms (i.e., non-axenic mixtures of bacteria and cyanobacteria), the centrifugation speed must be high enough or long enough to collect bacterial cells in addition to filaments (e.g., 15,000 x g, and/or more than 20 min).
- Under a dissecting microscope, gently score silicon wafers with a diamond scribe to create a ~2 x 2 mm spaced grid (see Figure 1A). Pipet 1-2 µl of sample onto one square of the grid, let dry and examine under the microscope–aim for approximately 30 filaments per spot, if there are too many or too few, wash off sample and concentrate/dilute sample in tube as necessary. In the ideal preparation, cells should form a monolayer, with minimal overlap or clumping.
- Replicate samples and treatments may be pipetted into additional grid squares; they should be close together, without risking overlap.
- Dry samples overnight or longer at room temperature, protected from dust and humidity.
- Optional: image with an epifluorescence microscope to assess cell density and configuration. Be aware that fluorescence imaging may not be performed after metal coating.
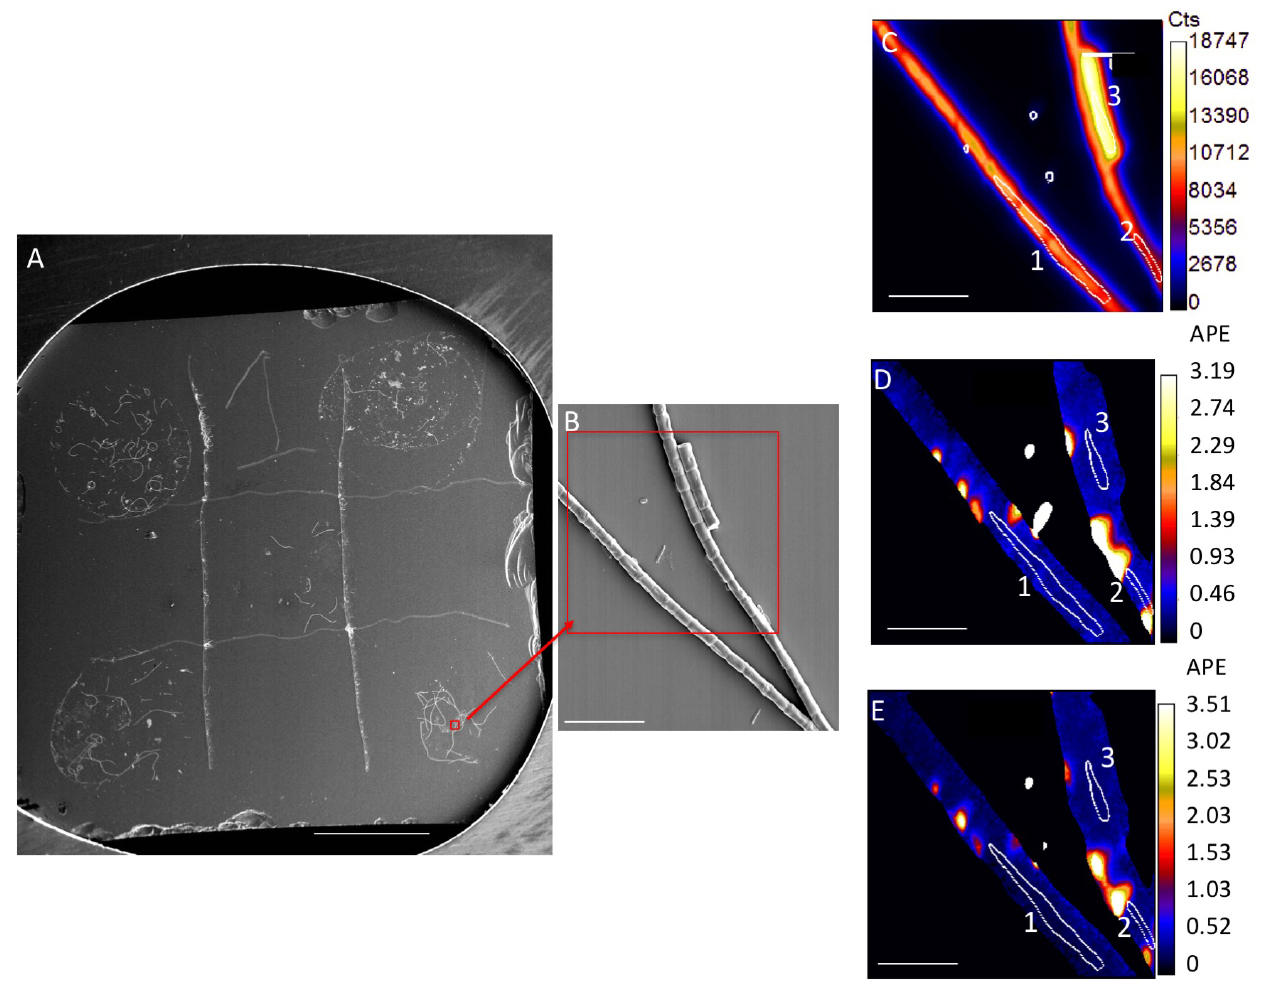
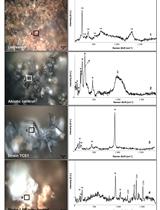
Figure 1. Representative image of samples and analysis. A. Silicon wafer with 5 samples spotted on grid. Scale bar is 1 mm. Red box and arrow indicate location of SEM image. B. SEM image. Red box indicates a representative NanoSIMS analysis area, NanoSIMS output of this area is shown in C-E. C. NanoSIMS 12C14N ion image, showing cumulative counts in a 30 x 30 µm area, with a 2562 pixels beam spot size, over a duration of 30 cycles. D. 13C/12C ratio image; E. 15N/14N ratio image. Numbered white circles in (C-E) indicate representative regions of interest (ROIs) for analysis. ROIs 1-3 values are in Table 1. Scale bars for (B-E) are 10 µm. - Use sputter coater to coat samples with a highly conductive metal surface
- A gold or iridium coat is typical; aim for a 5 to 10 nm coating; thicker for larger cells or preparations with increased topographic relief. Carbon coating may be used, but will interfere with carbon isotope measurements.
- Metal coating is not necessary for low-relief samples (< 1 μm), but it improves SEM imaging and initial imaging of the sample in the NanoSIMS.
- A gold or iridium coat is typical; aim for a 5 to 10 nm coating; thicker for larger cells or preparations with increased topographic relief. Carbon coating may be used, but will interfere with carbon isotope measurements.
- Place Si wafers in a holder
- If the SEM chamber is large enough, samples may be placed in a NanoSIMS holder; otherwise, SEM image samples prior to loading in a NanoSIMS holder.
- If the SEM chamber is large enough, samples may be placed in a NanoSIMS holder; otherwise, SEM image samples prior to loading in a NanoSIMS holder.
- Generate rare isotope enriched extracellular organic matter (EOM)
- SEM imaging
- SEM imaging is very useful for selecting analysis targets and ensuring they are clear of interfering debris or non-target cells. Analysis locations selected in the SEM may be relocated in the NanoSIMS if SEM images of the target location are collected at three scales (100x, 500x, and 3,000x). SEM stage coordinates can also be used to relocate targets that are too small or indistinct to identify in the NanoSIMS light imaging system (CCD camera); this is not necessary for most cell dispersions on Si wafers.
- Place holder with samples into the SEM.
- Adjust spot size and kV as needed for the instrument; low voltage imaging can reduce charging if the sample has not been metal coated.
- Select analysis targets and image at low, medium and high magnification (100x, 500x, 3,000x).
- Choose locations where multiple filaments are adjacent or overlap, but are still clearly distinguishable (see Figure 1B).
Note: Overlapping filaments will allow for analysis of 2-3 filaments in one analysis window, maximizing NanoSIMS analysis time, however, if they are not clearly distinguishable this will compromise the analysis. - If heterotropic bacterial cells are of interest, collect high magnification images (> 3,000x) in order to clearly visualize them (Figure 1B).
- Collect enough SEM images for analysis of at least 20 filaments per sample.
- Choose locations where multiple filaments are adjacent or overlap, but are still clearly distinguishable (see Figure 1B).
- SEM imaging is very useful for selecting analysis targets and ensuring they are clear of interfering debris or non-target cells. Analysis locations selected in the SEM may be relocated in the NanoSIMS if SEM images of the target location are collected at three scales (100x, 500x, and 3,000x). SEM stage coordinates can also be used to relocate targets that are too small or indistinct to identify in the NanoSIMS light imaging system (CCD camera); this is not necessary for most cell dispersions on Si wafers.
- NanoSIMS analysis
- Load sample into NanoSIMS
- Samples may require 1-12 h to come to the necessary vacuum, depending on the sample type, dryness and density of cell material.
- Samples may require 1-12 h to come to the necessary vacuum, depending on the sample type, dryness and density of cell material.
- Analysis for C and N isotopes is performed using a Cs+ analysis beam. Negative secondary ions are extracted in this mode.
- Tune the instrument and set up masses for the desired analysis. To measure 13C or 15N enrichment in cells, ion masses of 24, 25, 26, 27 (12C2-, 13C12C-, 12C14N-, and 12C15N- respectively) should be collected. Previous work indicates the C dimer (e.g., 12C2-) has superior yield to the 12C monomer and better coincidence with the secondary mass spectrometer settings for CN-(Pett-Ridge and Weber, 2012).
- Mass resolving power (ΔM/M) > 6,800 is necessary to resolve isobaric interferences.
- Reference materials should be analyzed to ensure correct instrument performance. This can simply be unlabeled controls, though a consistently run sample can provide higher confidence in the results (Pett-Ridge and Weber, 2012).
- Mass resolving power (ΔM/M) > 6,800 is necessary to resolve isobaric interferences.
- Choose analysis beam current
- Typically, analysis speed is the primary factor considered in the choice of beam current, because CN- is a high yield species, and the maximum sustainable count rate for the NanoSIMS detectors is ~250,000 counts per second, which is easily achieved from cells with 1 to 2 pA Cs+. These settings will typically yield ~150 nm diameter analysis beam. This diameter sets the ultimate spatial resolution of the analysis.
- If higher spatial resolution is desired, lens and aperture settings that reduce the diameter of the analysis beam and reduce the beam current should be used.
- Typically, analysis speed is the primary factor considered in the choice of beam current, because CN- is a high yield species, and the maximum sustainable count rate for the NanoSIMS detectors is ~250,000 counts per second, which is easily achieved from cells with 1 to 2 pA Cs+. These settings will typically yield ~150 nm diameter analysis beam. This diameter sets the ultimate spatial resolution of the analysis.
- Choose and save locations to analyze
- General locations are first recorded based on points located in the CCD camera (light imaging). If desired targets cannot be visualized in the CCD camera, other land marks must be located, and measurements determined from an SEM image or a coordinate transformation can be used to locate the targets in SIMS mode.
- SIMS real-time imaging is necessary to ensure that targets selected in CCD imaging are centered in the imaged field.
- General locations are first recorded based on points located in the CCD camera (light imaging). If desired targets cannot be visualized in the CCD camera, other land marks must be located, and measurements determined from an SEM image or a coordinate transformation can be used to locate the targets in SIMS mode.
- Set up analysis parameters to use on each mapped location and analyze. This includes:
- Size of analysis raster, which will depend on the size of the cells being analyzed. Usually between 10 x 10 µm and 25 x 25 µm.
- Pixel number, which is typically based on the analysis beam spot size (linear pixel number) ~2 x (raster size)/(spot size). For a typical 150 nm diameter analysis beam, 1282 pixels would be reasonable for a 10 x 10 µm raster, and 2562 pixels for a 25 x 25 µm raster.
- Pre-analysis sputtering: typically, a high-current Cs+ beam is rastered over the sample before data collection to enhance and stabilize the secondary ion count rate from the sample. The sample is sputtered to approximately twice the depth of Cs+ implantation, which is on the order of 60 nm. One can estimate the necessary duration of sputtering based on the sputter rate (ξ), primary ion beam current (I), sputtering time (t), raster area (A) and sputtered depth (d):

For biological materials, the sputter rate may be estimated as 2.5 nm µm2 pA-1 sec-1 (Ghosal et al., 2008). Longer pre-analysis sputtering may be necessary to remove residual materials from cell surfaces. The optimal duration of sputtering can be determined empirically by monitoring count rates and isotopic ratios with depth. - Analysis duration, which should be timed according to the number of counts needed from the smallest target to achieve sufficient analysis precision; 10,000 counts of the minor isotope will result in ~1% analysis precision.
Notes: - Determining consistent data collection parameters will likely be an iterative process, especially for a new sample, where enrichment levels, residual material on the cell surfaces, and within-sample variability, is unknown. Samples may need to be analyzed and examined, after which conditions may be altered slightly to ensure appropriate data collection.
- It is critical that unlabeled and killed controls be run. These results are used for the enrichment calculations below.
- Load sample into NanoSIMS
Data analysis
- Analysis of NanoSIMS ion images requires special software that can quantitatively process the images on a pixel by pixel basis. Several software packages are available (e.g., LIMAGE [L. Nittler, Carnegie Institution of Washington, DC]), including free versions.
- Results can be visualized based on quantitative ion images (such as 12C14N- ion Figure 1C) or ion ratio images (13C/12C, Figures 1D-1E) for each analyzed area. Ratios are calculated on a pixel by pixel basis.
- For stable isotope labeling experiments such as these, data are typically presented as ratios, in delta notation, atom percent of the minor isotope, or atom percent excess (APE) of the minor isotope. APE is an ideal presentation since it is simple and a direct representation of the uptake of the label (see equation below). While common in the literature, delta notation may be less intuitive for highly enriched samples. The choice of units, however, does not affect data visualization, either for images or graphs.
- Regions of interest (ROIs) surrounding target cells must be determined for quantification of isotopic ratios (Figures 1C-1E). ROIs are typically drawn manually, but automated routines can also be successful.
- For biofilm bacterial cells or cyanobacterial filaments, ROIs can be hand drawn based on secondary electron and 12C14N- ion images (Figure 1C), both of which yield a good indication of cell boundaries. It is also useful to examine 13C/12C and 15N/14N images, as these images may allow hotspots of residual labeled substrate to be excluded (Figures 1D-1E).
- Isotopic ratios, uncertainties, and pixel size are extracted for each ROIs.
- Atom percent enrichment (APE) of the ROI can be calculated according to (Table 1):
- APE = [Rf/(Rf/(Rf + 1) - Ri/(Ri + 1)] x 100%
- Rf is the final ratio, use the measured ratio of the isotope in the ROI (i.e., 13C/12C). Ri is the initial ratio, the measured ratio in killed controls or no-isotope added controls.
- Net fixation of stable isotope (the percentage of stable isotope incorporated relative to initial stable isotope content) can then be calculated (Popa et al., 2007) for each ROI and averaged (Table 1):
- Fxnet = {Rf[1 - Ri/(Ri + 1)] - Ri/(Ri + 1}/{Rs/(Rs + 1) - Rf[Rs/(Rs + 1]} x 100%
- Rf is the isotopic ratio of the treated biofilm, from NanoSIMS measurement (i.e., 13C 12C counts/12C2 counts in an ROI).
- Ri is the isotopic ratio in the initial biofilm, from NanoSIMS measurement (i.e., a time zero sample or killed control ratio in an ROI).
- Rs is the isotopic ratio in the substrate added. This can be obtained by IRMS, or if using a purchased substrate, from the manufacturer.
- Net fixation can be extrapolated to calculate the average net μg C or N assimilated per biofilm using biovolume measurements on the biofilms.
- C content can be estimated using biovolume-to-carbon conversion factors from the literature (e.g., 2.2 x 10⁻¹³ g C/μm3 for bacteria and 1.8 x 10⁻¹³ g C/μm3 for filamentous diazotrophic cyanobacteria) (Bratbak, 1985; Goebel et al., 2008), and then used to calculate average µg C in the biofilm.
- N content can be estimated based on C/N ratios determined via elemental analysis of biomass coupled with IRMS analysis, and literature for marine bacteria (C/N of 4.0 for cyanobacteria and 4.4 for heterotrophs), (Fukuda et al., 1998) then used to calculate average µg N in the biofilm.
- Multiply the average µg C or N in the cyanobacteria or heterotroph biomass in the biofilm by the average net fixation rate for that organism.
- If examining substrates with more than one stable isotope label (i.e., 13C as well as 15N), relative use efficiency can be calculated (Mayali et al., 2013), and mean use efficiencies compared to a theoretical mean of 1.0 using a t-test, to test for elemental preferences (Table 1).
- C/N relative use efficiency is calculated using this equation: [FCnet x (C:N)b]/[FNnet x (C:N)s] where (C:N)b is the C/N ratio for the biomass and (C:N)s is the C/N ratio for the substrate, which can be estimated based on the literature or determined via elemental analysis.
Table 1. Representative NanoSIMS ROI extracted data and analysis
aRepresentative ROIs from Figures 1D-1F.ROIa 12C2b 13C 12Cb 14N 12Cb 15N 12Cb 13C/12Cb 15N/14N 15N/APEc 13C/APEc FCnetc FNnetc C/N relusec 1 279691.90 8454.86 374425.10 2154.07 0.015 0.006 0.206 0.378 0.540 0.188 1.996 2 210659.20 7840.00 303345.00 2481.86 0.019 0.008 0.445 0.715 1.062 0.471 1.568 3 493302.90 14908.48 657695.20 4458.77 0.015 0.007 0.307 0.377 0.539 0.308 1.219 Initial -- -- -- -- 0.011 0.004 -- -- -- -- 3.34d EOM -- -- -- -- 2.09 6.27 -- -- -- -- 4.80e
bcounts and ratios extracted from NanoSIMS software (LIMAGE)
ccalculated based on equations in Data analysis section
d(C:N)b
e(C:N)s
Recipes
- 4% PFA (100 ml)
9.25 ml of 37% formaldehyde solution
90.75 ml of 1x phosphate buffered saline (diluted with MilliQ H2O from 10x stock, pH 7.4)
Mix together and use immediately - Sterile 10% sodium chloride (NaCl) solution (100 ml)
10 g NaCl
100 ml H2O
Mix to dissolve, autoclave at 121 °C for 25 min to sterilize - Modified artificial seawater base (ASN) medium recipe (with nitrate)
Chemical g/L Final conc. 1 NaCl 25 428 mM 2 MgCl2·6H2O 2 9.84 mM 3 KCl 0.5 6.71 mM 4 MgSO4·H2O 3.5 14.2 mM 5 CaCl2·2H2O 0.5 3.4 mM 6 NaHCO3 0.2 2.38 mM 7 Tricine 0.025 0.14 mM 8 KH2PO4 0.0494 0.0363 mM 9 NaNO3 0.0748 1.76 mM 10 FeCl3 0.001898 0.0117 mM 11 EDTA 0.004355 0.0149 mM 12 H3BO3 0.00286 0.0463 mM 13 MnCl2·4H2O 0.00181 9.15 μM 14 ZnSO4·7H2O 0.000222 0.772 μM 15 NaMoO4·2H2O 0.00039 1.61 μM 16 Co(NO3)2·6H2O 0.0000494 0.17 μM 17 Cyanocobalamin 0.000005 0.00369 μM 18 Biotin 0.000005 0.0205 μM 19 Thiamin HCl 0.0002 0.593 μM
- Stock a: Prepare 1,000x stock solution of 8 in distilled water
- Stock b: Prepare 500x stock solution of 9 in distilled water
- Stock c: Prepare 1,000x stock of 10-11 in distilled water
- Stock d: Prepare 1,000x stock solution of 12-16 in distilled water
- Stock e: Prepare 1,000x stock solution of 17-19, filter sterilize and freeze in 1 ml aliquots
- Add 1-7 to 1 L distilled water
- Add 1 ml of stock solutions a, c and d and 2 ml of stock solution b
- Autoclave at 121 °C for 20 min and once cooled add stock e
- Stock solutions a-d can be stored at 4 °C for up to 6 months
Acknowledgments
Funding was provided by the DOE Genomic Science Program under contract SCW1039. Work at Lawrence Livermore National Laboratory was performed under the auspices of DOE contract DE-AC52-07NA27344. This protocol is based on previous work described in Stuart et al. (2016a and 2016b).
References
- Bratbak, G. (1985). Bacterial biovolume and biomass estimations. Appl Environ Microbiol 49(6): 1488-1493.
- Fukuda, R., Ogawa, H., Nagata, T. and Koike, I. I. (1998). Direct determination of carbon and nitrogen contents of natural bacterial assemblages in marine environments. Appl Environ Microbiol 64(9): 3352-3358.
- Ghosal, S., Fallon, S. J., Leighton, T. J., Wheeler, K. E., Kristo, M. J., Hutcheon, I. D. and Weber, P. K. (2008). Imaging and 3D elemental characterization of intact bacterial spores by high-resolution secondary ion mass spectrometry. Anal Chem 80(15): 5986-5992.
- Goebel, N. L., Edwards, C. A., Carter, B. J., Achilles, K. M. and Zehr, J. P. (2008). Growth and carbon content of three different-sized diazotrophic cyanobacteria observed in the subtropical North Pacific(1). J Phycol 44(5): 1212-1220.
- Jiao, Y., Cody, G. D., Harding, A. K., Wilmes, P., Schrenk, M., Wheeler, K. E., Banfield, J. F. and Thelen, M. P. (2010). Characterization of extracellular polymeric substances from acidophilic microbial biofilms. Appl Environ Microbiol 76(9): 2916-2922.
- Lechene, C., Hillion, F., McMahon, G., Benson, D., Kleinfeld, A. M., Kampf, J. P., Distel, D., Luyten, Y., Bonventre, J., Hentschel, D., Park, K. M., Ito, S., Schwartz, G. B., Slodzian, G (2006). High-resolution quantitative imaging of mammalian and bacterial cells using stable isotope mass spectrometry. J Biol 5:20.
- Mayali, X., Weber, P. K., Pett-Ridge, J. (2013). Taxon-specific C/N relative use efficiency for amino acids in an estuarine community. FEMS Microbiol Ecol 83: 402-412.
- Pett-Ridge, J. and Weber, P. K. (2012). NanoSIP: NanoSIMS applications for microbial biology. Methods Mol Biol 881: 375-408.
- Polerecky, L., Adam, B., Milucka, J., Musat, N., Vagner, T. and Kuypers, M. M. (2012). Look@NanoSIMS--a tool for the analysis of nanoSIMS data in environmental microbiology. Environ Microbiol 14(4): 1009-1023.
- Popa, R., Weber, P. K., Pett-Ridge, J., Finzi, J. A., Fallon, S. J., Hutcheon, I. D., Nealson, K. H. and Capone, D. G. (2007). Carbon and nitrogen fixation and metabolite exchange in and between individual cells of Anabaena oscillarioides. ISME J 1(4): 354-360.
- Stuart, R. K., Mayali, X., Boaro, A. A., Zemla, A., Everroad, R. C., Nilson, D., Weber, P. K., Lipton, M., Bebout, B. M., Pett-Ridge, J. and Thelen, M. P. (2016a). Light regimes shape utilization of extracellular organic C and N in a cyanobacterial biofilm. MBio 7(3).
- Stuart, R. K., Mayali, X., Lee, J. Z., Craig Everroad, R., Hwang, M., Bebout, B. M., Weber, P. K., Pett-Ridge, J. and Thelen, M. P. (2016b). Cyanobacterial reuse of extracellular organic carbon in microbial mats. ISME J 10(5): 1240-1251.
- Woebken, D., Burow, L. C., Prufert-Bebout, L., Bebout, B. M., Hoehler, T. M., Pett-Ridge, J., Spormann, A. M., Weber, P. K. and Singer, S. W. (2012). Identification of a novel cyanobacterial group as active diazotrophs in a coastal microbial mat using NanoSIMS analysis. ISME J 6(7): 1427-1439.
Article Information
Copyright
© 2017 The Authors; exclusive licensee Bio-protocol LLC.
How to cite
Stuart, R. K., Mayali, X., Thelen, M. P., Pett-Ridge, J. and Weber, P. K. (2017). Measuring Cyanobacterial Metabolism in Biofilms with NanoSIMS Isotope Imaging and Scanning Electron Microscopy (SEM). Bio-protocol 7(9): e2263. DOI: 10.21769/BioProtoc.2263.
Category
Microbiology > Microbial metabolism > Other compound
Cell Biology > Cell imaging > Electron microscopy
Biochemistry > Other compound > Bicarbonate
Do you have any questions about this protocol?
Post your question to gather feedback from the community. We will also invite the authors of this article to respond.