- Protocols

- Articles and Issues
- For Authors
- About
- Become a Reviewer

Direct Visualization and Quantification of the Actin Nucleation and Elongation Events in vitro by TIRF Microscopy

Published: Vol 7, Iss 5, Mar 5, 2017 DOI: 10.21769/BioProtoc.2146 Views: 9771
Reviewed by: Marisa RosaPablo Bolanos-VillegasStefanie Rosa
Original research article
The authors used this protocol in:
Dec 2015
Advertisement


Protocol Collections
Comprehensive collections of detailed, peer-reviewed protocols focusing on specific topics


Abstract
Total internal reflection fluorescence (TIRF) microscopy is a powerful tool for visualizing the dynamics of actin filaments at single-filament resolution in vitro. Thanks to the development of various fluorescent probes, we can easily monitor all kinds of events associated with actin dynamics, including nucleation, elongation, bundling, fragmentation and monomer dissociation. Here we present a detailed protocol regarding the visualization and quantification of actin nucleation and filament elongation events by TIRF microscopy in vitro, which is based on the methods previously reported (Liu et al., 2015; Yang et al., 2011).
Keywords: Actin assemblyBackground
The actin cytoskeleton undergoes constant assembly and disassembly that has been implicated in numerous physiological cellular processes, such as cell division, cell expansion, cytokinesis and maintenance of cell polarity. Understanding how actin dynamics are precisely regulated is a fundamental question in cell biology. Actin as the core component of the actin cytoskeleton can self-assemble into filamentous structure with the diameter of approximately 7 nm in the presence of potassium chloride, adenosine triphosphate, and magnesium. Within cells, however, the actin assembly and disassembly is tightly regulated by different actin-binding proteins (ABPs) to meet the demands of various physiological cellular processes. Reconstitution of how ABPs regulate actin assembly and disassembly as well as the formation of high-order actin structures in vitro may provide insights into the mechanism of action of actin during these physiological cellular processes. In order to achieve this, we need to establish assays to trace the actin assembly and disassembly reaction in vitro. The process of actin assembly and disassembly has been traced by the kinetic pyrenyl-actin assay. However, considering that it is a solution-based bulk assay, it is hard to determine the contribution of individual events to actin polymerization, such as actin nucleation and filament elongation events. Development of total internal reflection fluorescence microscopy (TIRF microscopy, or TIRFM) allows the direct visualization of the dynamics of individual actin filaments and quantification of the associated parameters. In addition, this assay requires the minimal amount of proteins compared to other assays.
Materials and Reagents
- Cover glass (Thermo Fisher Scientific, Thermo ScientificTM, catalog number: 3323 )
- 4 x 40 mm double-layer strips
- Parafilm (Bemis, catalog number: PM996 )
- Microscope slide (Sail brand, catalog number: 7105 )
- Capillary paper
- Oregon-green (OG) labeled actin (Scott et al., 2011)
- Recombinant AtFormin5 and plant AtProfilin5 (Liu et al., 2015)
- N-ethylmaleimide-myosin (Amann and Pollard, 2001)
- Unlabeled rabbit muscle actin (Kuhn and Pollard, 2005)
- EGTA (AMRESCO, catalog number: 0732 )
- Magnesium chloride hexahydrate (MgCl2·6H2O) (Sigma-Aldrich, catalog number: M2393 )
- Potassium chloride (KCl) (Sigma-Aldrich, catalog number: P5405 )
- Imidazole (EMD Millipore, catalog number: 814223 )
- Tris base (Sigma-Aldrich, catalog number: T3253 )
- Calcium chloride (CaCl2) (Sigma-Aldrich, catalog number: C5670 )
- ATP (Sigma-Aldrich, catalog number: A6559 )
- DTT (Sigma-Aldrich, catalog number: D0632 )
- Sodium azide (NaN3) (Sigma-Aldrich, catalog number: S2002 )
- EDTA (AMRESCO, catalog number: 0322 )
- Glucose (Sigma-Aldrich, catalog number: G8270 )
- Catalase from bovine liver (Sigma-Aldrich, catalog number: C9322 )
- Glucose Oxidase from Aspergillus niger (Sigma-Aldrich, catalog number: G7141 )
- Methylcellulose (Sigma-Aldrich, catalog number: M0262 )
- Bovine serum albumin (BSA) (Sigma-Aldrich, catalog number: A1933 )
- Sodium chloride (NaCl) (Sigma-Aldrich, catalog number: S7653 )
- 10x KMEI (see Recipes)
- 10x ME (see Recipes)
- Buffer G (see Recipes)
- 1x TIRFM buffer (see Recipes)
- HS-TBS (see Recipes)
- HS-BSA (see Recipes)
- LS-BSA (see Recipes)
Equipment
- Alcohol burner
- -80 °C freezer
- Centrifuge
- Spectrophotometer as an accessory in Infinite 200 PRO multimode reader (Tecan Trading)
- Olympus IX81 microscope (Olympus, model: IX81) equipped with an inverted TIRF illumination system that has a 100x oil TIRF objective (1.49 numerical aperture)
- Argon laser (488 nm excitation)
- Photometrics cascade II 512 CCD camera (Photometrics, model: Photometrics cascade II 512 CCD camera)
Software
- MicroManager software (https://micro-manager.org/)
- ImageJ software (http://rsbweb.nih.gov/ij/; version 1.41)
Procedure
- Preparation of TIRFM flow cells
- Mount two 4 x 40 mm double-layer strips of Parafilm to the 24 x 60 mm cover glass tightly, leaving the gap for 3-4 mm.
- Place a 25 x 76 mm microscope slide on the cover glass perpendicularly to make the flow cell. Press gently.
- Heat the flow cell in an alcohol burner for 2-3 sec to ensure that the Parafilm sticks tightly to the cover glass and microscope slide. The chamber volume should be about 40 μl.
- See Figure 1 for how to make a flow cell.
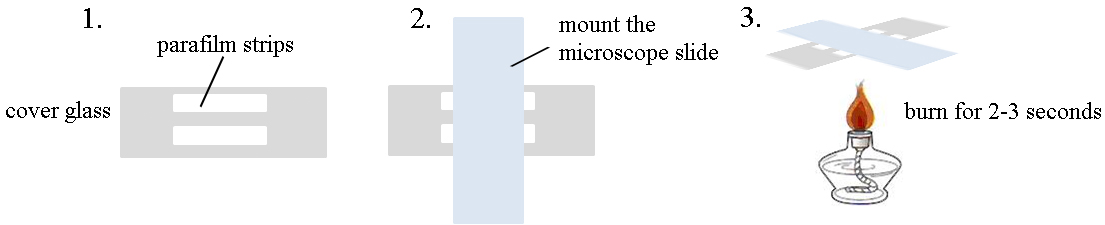
Figure 1. Cartoon for the preparation of flow cells for TIRFM - Preparation of actin monomers
- 100 μl OG labeled actin (about 20 μM) is taken out from -80 °C freezer and thawed in ice water. It is then subjected to centrifugation at 200,000 x g for 2 h, at 4 °C. Subsequently, 50 μl supernatant is pipetted out carefully after centrifugation and is kept on ice in the dark (see Note 1).
- Ten microliter supernatant is diluted into 490 μl buffer G for the determination of actin concentration, using buffer G as the control. Since not all actin monomers are labeled, the concentration of unlabeled or labeled actin is determined by the spectrophotometer associated with an Infinite 200 PRO multimode reader. To determine the concentration of total actin, the absorbance is measured at 290 nm and 491 nm using the extinction coefficient of 26,600 M-1 cm-1 at 290 nm for actin and 77,800 M-1 cm-1 at 491 nm for Oregon-green, respectively, and the concentration of total actin is calculated using the following equation: [total Actin] = (A290 - 0.16991 x A491) x 50 x 106/26,600 μM.
- Usually, one actin monomer is labeled by one Oregon-green molecule on Cys-374 (Kuhn and Pollard, 2005), so we can infer the concentration of labeled actin by calculating the concentration of Oregon-green molecules. The concentration of OG is calculated using the following equation: [OG] = A491 x 50 x 106/77, 800 μM. So [OG] is used as [OG-actin]. Usually the concentration of OG-actin is about 5 μM, and unlabeled actin is 1 to 2 μM.
- OG actin is mixed with unlabeled actin at equal molar ratio and 1/10 volume of 10x ME is subsequently added into the solution and is kept on ice in the dark.
- NEM-myosin is diluted to 20 nM in HS-TBS and 40 μl of diluted NEM-myosin is injected into the chamber, incubate 5 min at room temperature in the dark.
- The flow cell is washed with 40 μl HS-BSA, followed by washing with 40 μl LS-BSA immediately, and incubate for 2 min at room temperature in dark. A small piece of capillary paper is placed on the other side of the chamber by capillarity to help fluid flow out.
- The flow cell is washed with 40 μl 1x TIRFM buffer.
- Actin monomers (0.75 μM, 50% OG labeled) in 1x TIRFM buffer is injected into the chamber. The growth of single actin filaments is observed under an Olympus IX81 microscope equipped with a 100x oil objective by the TIRF illumination, and images are captured with MicroManager imaging software (Micro-Manager) at 2- or 3-sec intervals. OG is excited by a 488 nm Argon laser, and the time-lapse series images are taken using a Photometrics cascade II 512 CCD camera and saved as a tiff file. The file can be opened and further analyzed by ImageJ software.
- Examples
- Example 1. Formin5 (FH5) eliminates the inhibitory effect of Profilin5 (PRF5) on spontaneous actin nucleation. Various concentrations of proteins are pre-incubated with actin monomers for 5 min in the dark before being injected into the flow cell. See the example in Figure 2.
- Example 2. Determination of the effect of PRF4 and PRF5 on actin filament elongation.
- Step 1. Actin monomers at 0.75 μM in 1x TIRFM buffer is injected into the chamber. After the actin assembly reaction running for about 10 min, it will generate enough amount of actin filament ends to permit the filament elongation in step 2 (step 8b.ii). Actin filaments are observed under an Olympus IX81 microscope by TIRF illumination. Images are acquired with the sequential-acquire program, which is paused after 10 min. The last frame and time point are marked for further analysis.
- Step 2. Equal amount of actin monomers in 1x TIRFM buffer as in step 1 (step 8b.i) is injected into the chamber in the presence or absence of PRFs that are preincubated with actin for 5 min in the dark quickly and gently, in order to keep the position of slide. Normally, the injection can be done in one minute. The sequential-acquire program is then restarted to continue the image acquisition for another 10 min. The PRF-actin complex will add onto the ends of existing filaments to promote further elongation. The image series is saved as a tiff file. The time interval between two observations should be taken into consideration when analyzing image series. See the example in Figure 3.
Data analysis
The saved time-lapse image series are opened in ImageJ software and the scale bar is set with 6 pixels as 1 μm. Figure 2 is shown as an example of the visualization and quantification of actin nucleation events. Basically, the nucleation activity is compared by counting the number of actin filaments (> 1 μm) per microscopic field at different time points and plotted (Figure 2). Consistent with the biochemical activity of profilin as an actin monomer sequestering protein, PRF5 inhibits spontaneous polymerization; whereas FH5 can overcome the inhibitory effect of PRF5 on spontaneous actin polymerization via utilizing PRF5-actin complex to accelerate actin polymerization.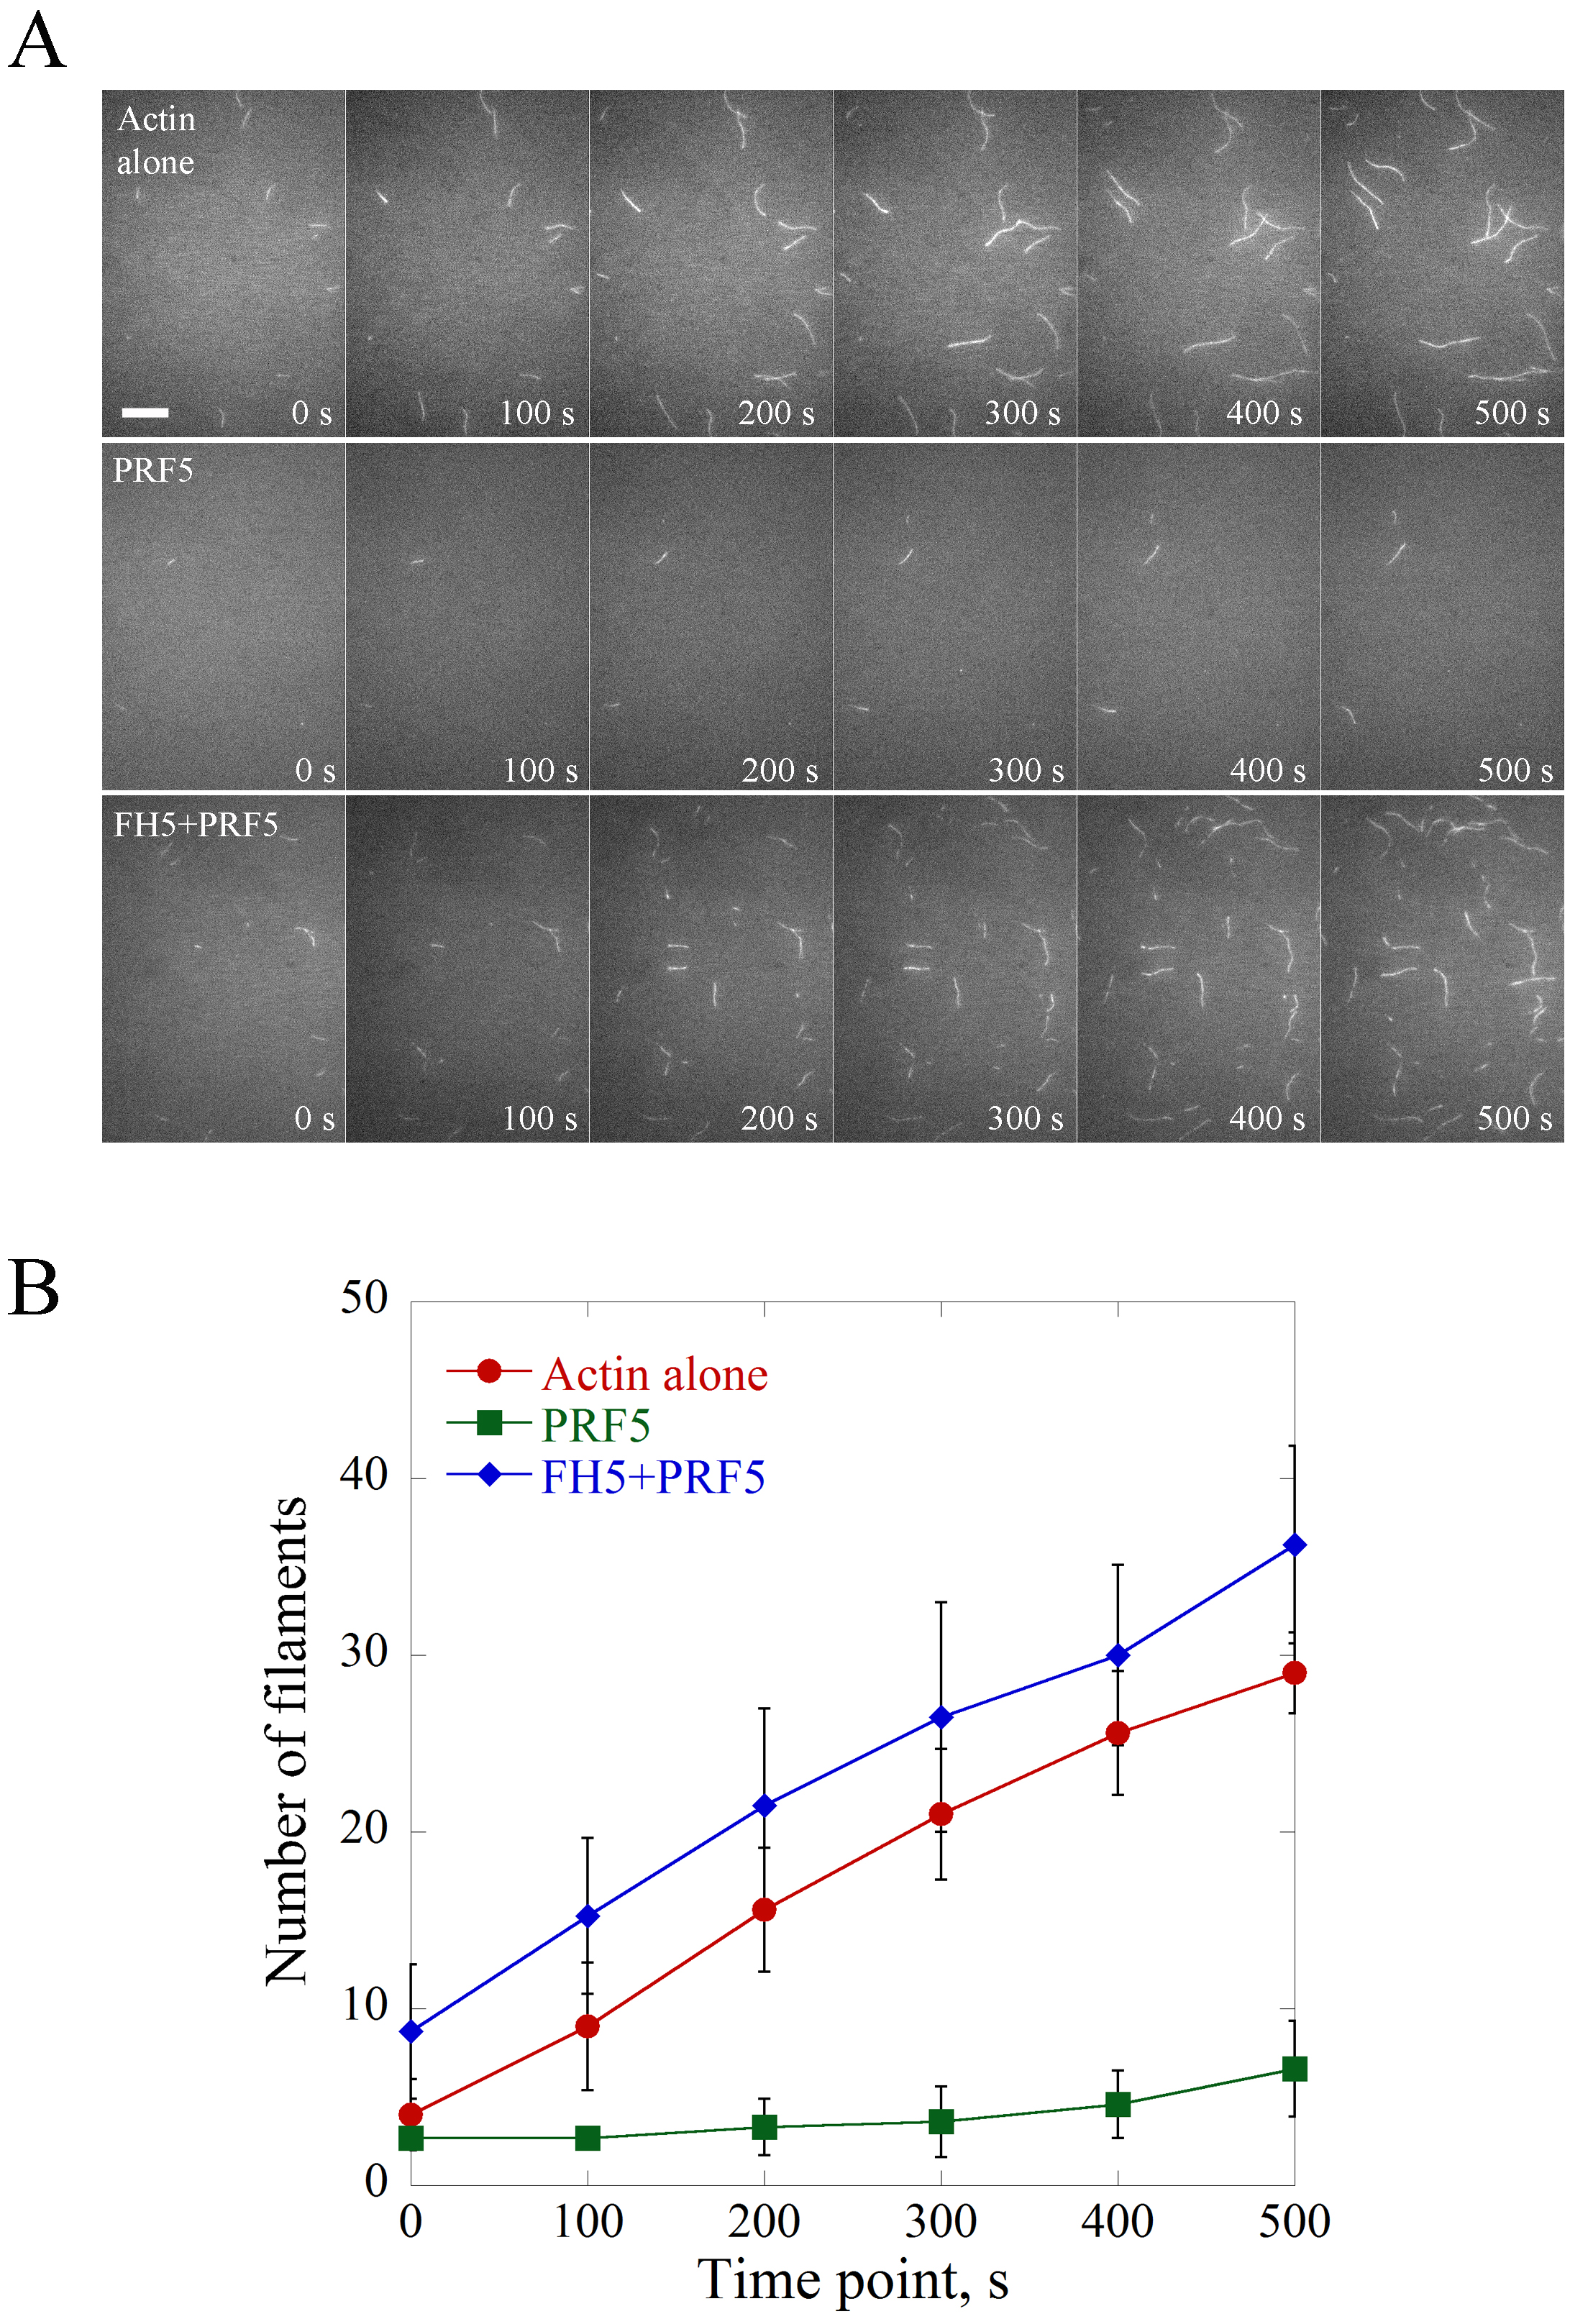
Figure 2. Direct visualization of the nucleation of individual actin filaments. A. Time-lapse images of spontaneous actin assembly with or without various ABPs. [Actin], 0.75 μM; [PRF5], 1.5 μM; [AtFH5], 0.9 μM. Bar = 10 μm. See also the entire series in Supplemental Videos 1-3. B. Plot of the number of actin filaments per microscopic field during actin assembly. Values represent mean ± SD, n = 3.
Figure 3 is shown as an example of calculating filament elongation rates at both barbed end and pointed end of actin filaments. The elongation rates of single actin filaments at their ends are calculated by the MultipleKymograph tool in ImageJ software. To calculate the elongation rates of actin filaments, a thin line along the growth path of a filament covering both ends in a time-lapse movie is initially drawn and a Kymograph is subsequently generated. The slope of the leading edges represents the growth rates (μm/sec). The growth rates at both ends (subunits/sec) are subsequently calculated as subunits/sec by assuming that there are 330 subunits per μm filament (Kuhn and Pollard, 2005). As shown in Figure 3, both profilins slow down the elongation rate of single actin filaments at barbed ends, whereas no obvious difference between the effect of PRF4 and PRF5 on filament elongation is observed.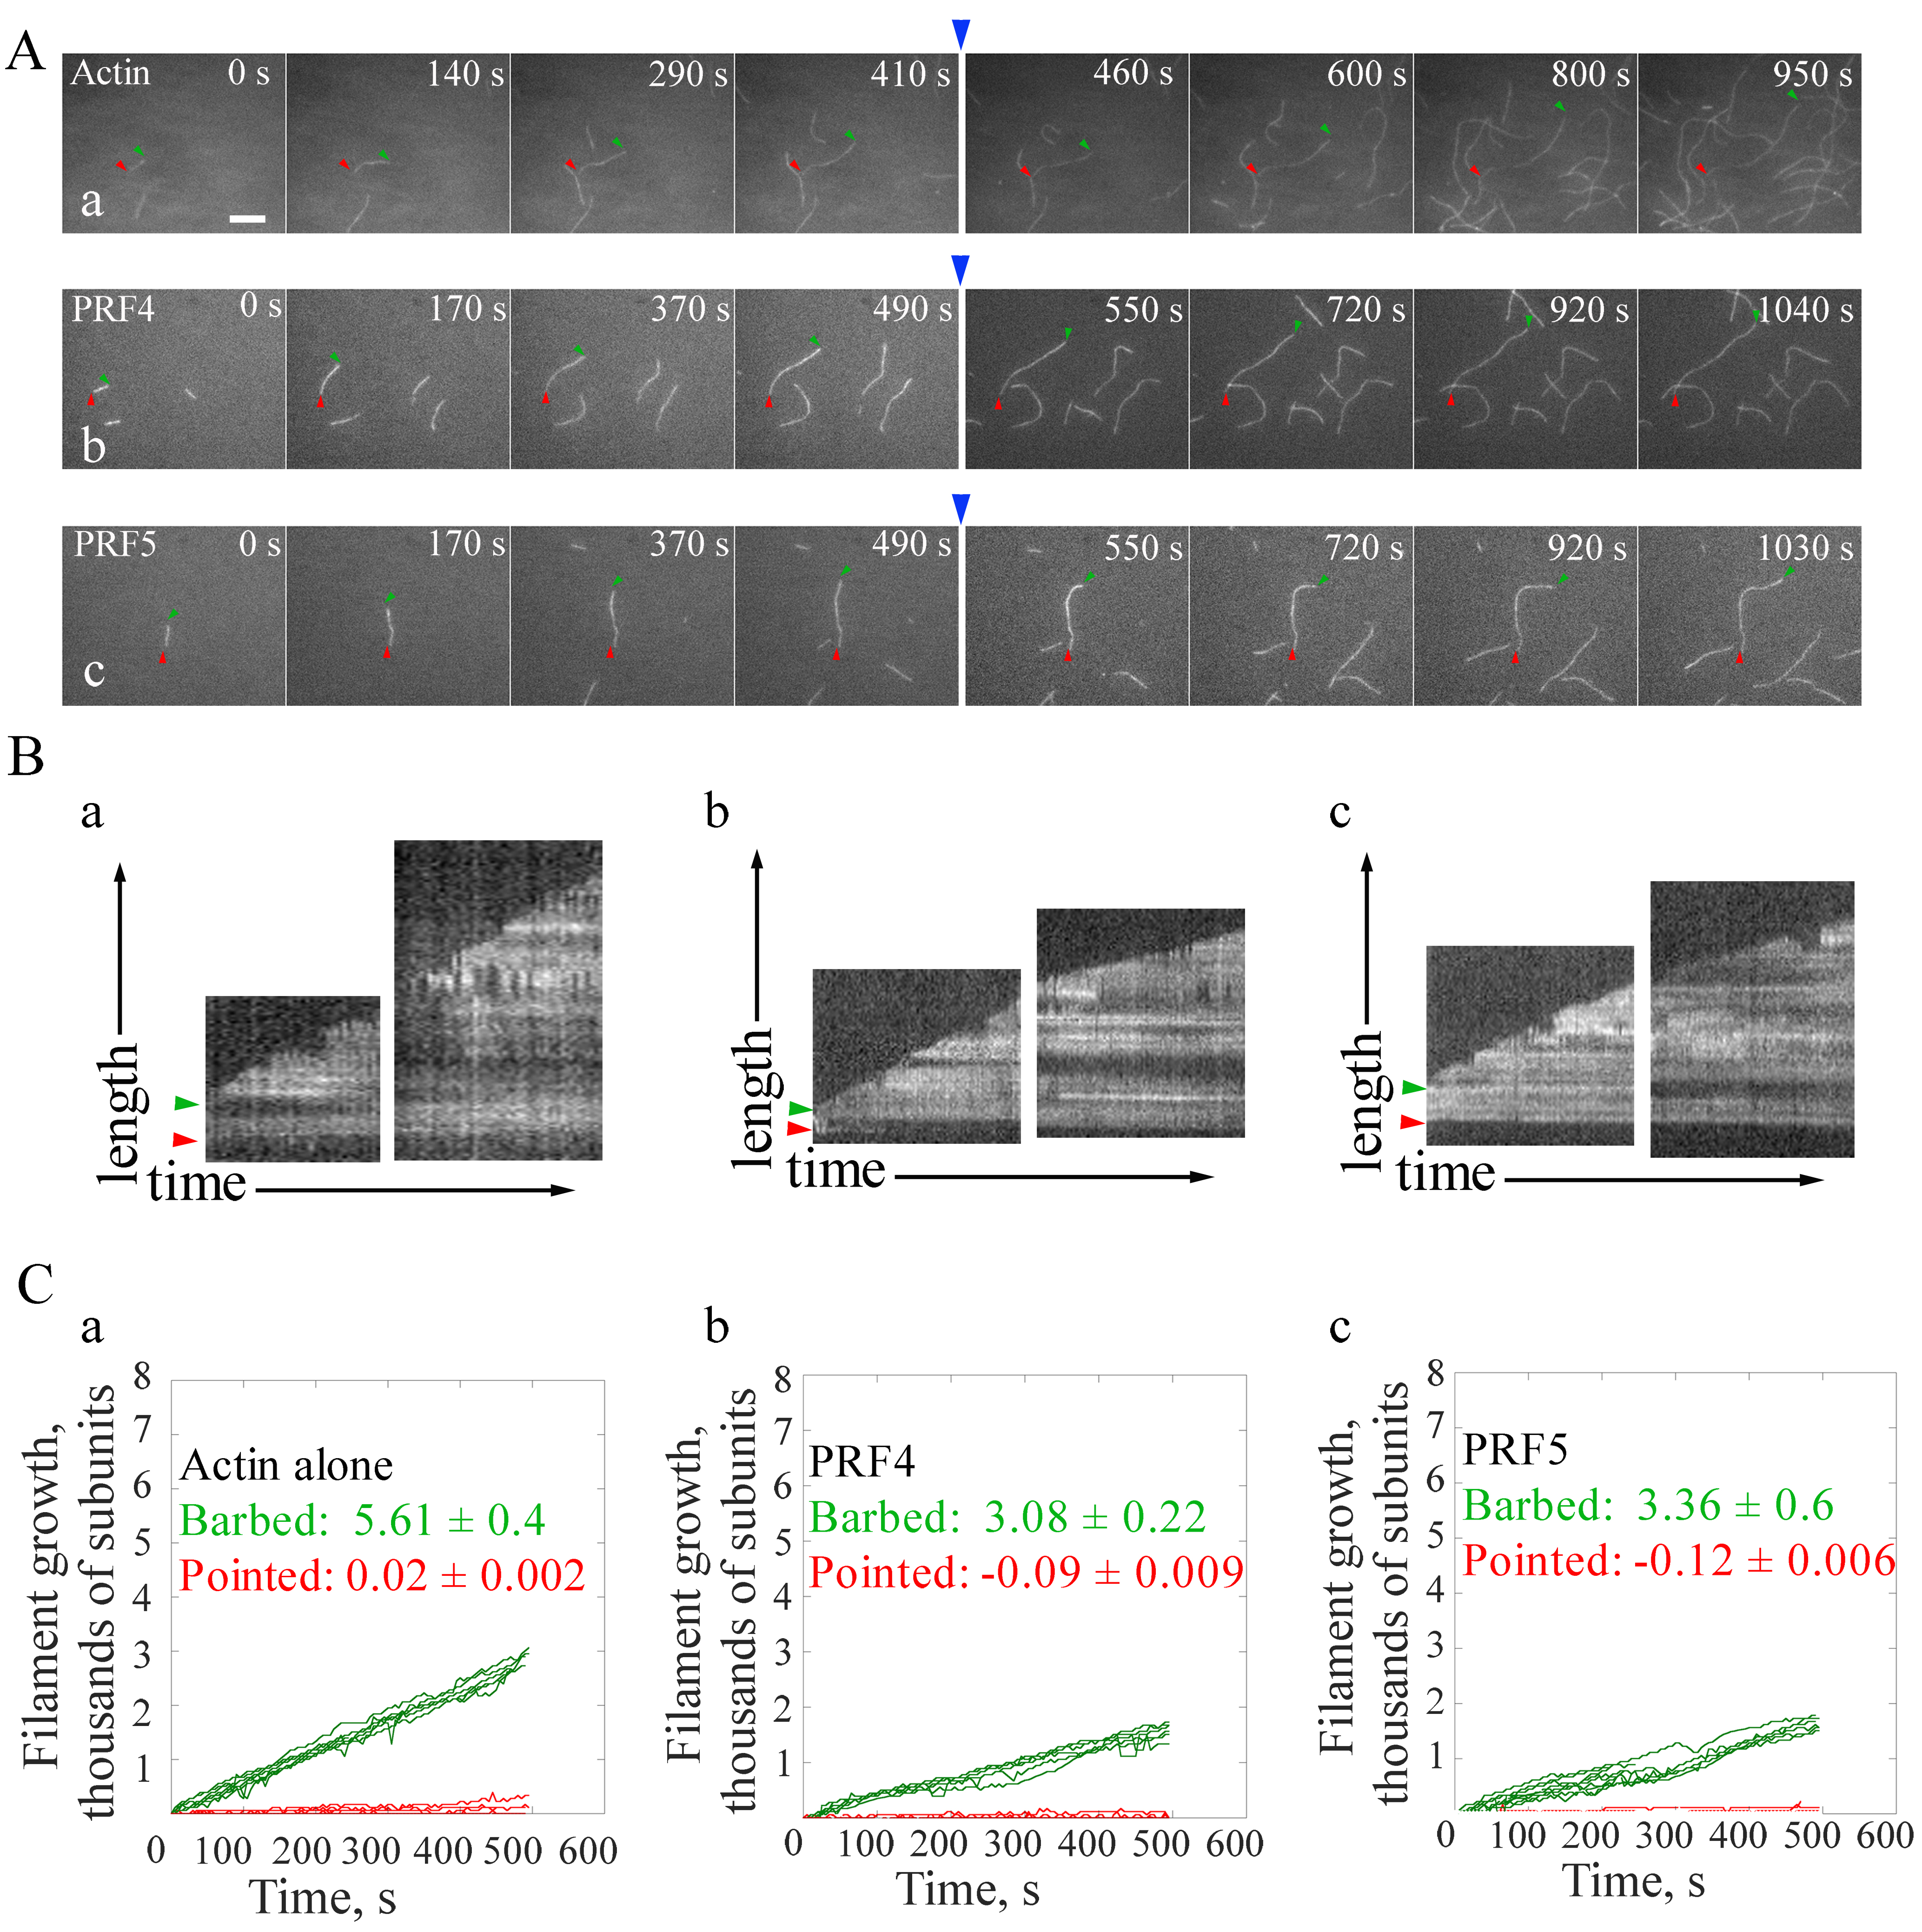
Figure 3. Direct visualization of the elongation of individual actin filaments. A. Time-lapse images of spontaneous actin assembly in the presence or absence of profilins (PRFs). Blue arrows indicate the time point of the addition of actin monomers in the presence or absence of PRFs. [Actin], 0.75 μM; [PRF4], 0.75 μM; [PRF5], 0.75 μM. B. Kymograph analysis of single filament growth in the absence (a) or presence of profilins (b, c). Green and red arrow heads indicate the barbed end and pointed end, respectively. Kymographs of the length (y-axis) of the filaments marked to the left versus time (x-axis, 500 sec). Bar = 5 μm. See also the entire series in Supplemental Videos 4-6. C. Statistics of the filament growth rates at both ends. More than ten individual filaments were used for each analysis. Values represent mean ± SD.
Notes
- When pipetting out the supernatant of OG-actin after centrifugation (see step 2a), DO suck from the surface layer of the liquid carefully, DO NOT put pipette deep into the base of the tube because actin monomers at the base are lack of viability.
- The 1x TIRFM buffer is very viscous, so DO mix the components thoroughly before use (see Recipes).
- Change for fresh 1x TIRFM buffer every 3 h for keeping the reducing circumstance. It is very important for keeping the brightness of fluorescence molecules (Oregon-green).
- High laser power or long time exposure will cause the break of actin filaments. The laser power should not be too high. Usually 10-20% will be OK for 50 mW laser. Also the exposure time should not be too long, 300-600 msec will be OK (see step 7).
Recipes
- 10x KMEI
10 mM EGTA
10 mM MgCl2
500 mM KCl
100 mM imidazole, pH 7.0 - 10x ME
10 mM EGTA
1 mM MgCl2 - Buffer G
5 mM Tris-HCl, pH 8.0
0.2 mM CaCl2
0.2 mM ATP
0.2 mM DTT
0.02% NaN3 - 1x TIRFM buffer
10 mM imidazole, pH 7.0
50 mM KCl
1 mM MgCl2
1 mM EGTA
50 mM DTT
0.2 mM ATP
50 mM CaCl2
15 mM glucose
20 μg/ml catalase
100 μg/ml glucose oxidase
0.5% methylcellulose - HS-TBS
50 mM Tris-HCl, pH 7.5
600 mM NaCl - HS-BSA
50 mM Tris-HCl, pH 7.5
600 mM NaCl
1% BSA - LS-BSA
50 mM Tris-HCl, pH7.5
150 mM NaCl
1% BSA
Acknowledgments
This protocol was adapted from our previously published work (Yang et al., 2011; Liu et al., 2015). We thank the former members from the Huang lab for their efforts on optimizing the protocol and Dr. David Kovar (University of Chicago) for the suggestions on running this assay at the beginning. The research in the Huang lab was supported by grants from Ministry of Science of Technology of China (2013CB945100) and National Natural Science Foundation of China (31671390 and 31471266).
References
- Amann, K. J. and Pollard, T. D. (2001). Direct real-time observation of actin filament branching mediated by Arp2/3 complex using total internal reflection fluorescence microscopy. Proc Natl Acad Sci U S A 98(26): 15009-15013.
- Kuhn, J. R. and Pollard, T. D. (2005). Real-time measurements of actin filament polymerization by total internal reflection fluorescence microscopy. Biophys J 88(2): 1387-1402.
- Liu, X., Qu, X., Jiang, Y., Chang, M., Zhang, R., Wu, Y., Fu, Y. and Huang, S. (2015). Profilin regulates apical actin polymerization to control polarized pollen tube growth. Mol Plant 8(12): 1694-1709.
- Scott, B. J., Neidt, E. M. and Kovar, D. R. (2011). The functionally distinct fission yeast formins have specific actin-assembly properties. Mol Biol Cell 22(20): 3826-3839.
- Yang, W., Ren, S., Zhang, X., Gao, M., Ye, S., Qi, Y., Zheng, Y., Wang, J., Zeng, L., Li, Q., Huang, S. and He, Z. (2011). BENT UPPERMOST INTERNODE1 encodes the class II formin FH5 crucial for actin organization and rice development. Plant Cell 23(2): 661-680.
Article Information
Copyright
© 2017 The Authors; exclusive licensee Bio-protocol LLC.
How to cite
Jiang, Y. and Huang, S. (2017). Direct Visualization and Quantification of the Actin Nucleation and Elongation Events in vitro by TIRF Microscopy. Bio-protocol 7(5): e2146. DOI: 10.21769/BioProtoc.2146.
Category
Plant Science > Plant biochemistry > Protein > Activity
Biochemistry > Protein > Labeling
Biochemistry > Protein > Activity
Do you have any questions about this protocol?
Post your question to gather feedback from the community. We will also invite the authors of this article to respond.