- Protocols

- Articles and Issues
- For Authors
- About
- Become a Reviewer

Sulforhodamine B (SRB) Assay in Cell Culture to Investigate Cell Proliferation
Published: Vol 6, Iss 21, Nov 5, 2016 DOI: 10.21769/BioProtoc.1984 Views: 49507
Reviewed by: HongLok LungChunjing QuAnonymous reviewer(s)
Original research article
The authors used this protocol in:

Jul 2015
Advertisement


Protocol Collections
Comprehensive collections of detailed, peer-reviewed protocols focusing on specific topics


Abstract
The SRB assay has been used since its development in 1990 (Skehan et al., 1990) to inexpensively conduct various screening assays to investigate cytotoxicity in cell based studies (Vichai and Kirtikara, 2006). This method relies on the property of SRB, which binds stoichiometrically to proteins under mild acidic conditions and then can be extracted using basic conditions; thus, the amount of bound dye can be used as a proxy for cell mass, which can then be extrapolated to measure cell proliferation.
The protocol can be divided into four main steps: preparation of treatment, incubation of cells with treatment of choice, cell fixation and SRB staining, and absorbance measurement. This assay is limited to manual or semiautomatic screening, and can be used in an efficient and sensitive manner to test chemotherapeutic drugs or small molecules in adherent cells. It also has applications in evaluating the effects of gene expression modulation (knockdown, gene expression upregulation), as well as to study the effects of miRNA replacement on cell proliferation (Kasinski et al., 2015).
Background
The SRB assay has been widely used to investigate cytotoxicity in cell based studies and it is the method of choice for high cost-effective screenings (Vichai and Kirtikara, 2006). Since this method does not rely on measuring metabolic activity [e.g., 3-(4,5-dimethylthiazol-2-yl)-2,5-diphenyltetrazolium bromide, MTT], the steps required to optimize the protocol for a specific cell line are substantially simplified.
The protocol described here has been optimized for medium throughput screening of miRNAs with tumor suppressive properties in adherent lung cancer cells in 96-well format and 384-well format (Kasinski et al., 2015). Particularly the SRB assay in 384-well format offers the advantage of screening a large number of miRNA mimics or compounds in a single plate (> 60 per plate, 6 replicates) using inexpensive equipment and reagents.
Materials and Reagents
- 96-well clear flat-bottom polystyrene tissue-culture plates (Corning, catalog number: 3596 )
- 384-well clear flat-bottom polystyrene tissue-culture plates (Corning, catalog number: 3701 )
- 96-well PCR plates (Corning, Axygen®, catalog number: PCR-96-FS-C )
- 100 mm tissue-culture plates (Corning, catalog number: 430167 )
- 1.5 ml Eppendorf tubes (VWR, catalog number: 89000-028 )
- 15 ml Falcon tubes (Corning, Falcon®, catalog number: 352097 )
- Pipette tips (Mettler-Toledo International, catalog numbers: RT-L10FLR )
- Pipette tips (Mettler-Toledo International, catalog numbers: RT-L200F )
- Pipette tips (Mettler-Toledo International, catalog numbers: RT-L1000F )
- MatrixTM pipette tips (1,250 μl) (Thermo Fisher Scientific, Thermo ScientificTM, catalog numbers: 8245 )
- MatrixTM pipette tips (125 μl) (Thermo Fisher Scientific, Thermo ScientificTM, catalog numbers: 7445 )
- Adherent cell line of interest
- Appropriate culture medium
- Reagent reservoir sterile (Corning, Costar®, catalog number: 4870 )
- Reagent reservoir non sterile (VWR, catalog number: 89094-684 )
- Opti-MEM® (Thermo Fisher Scientific, GibcoTM, catalog number: 31985070 ) or serum free medium (SFM, appropriate culture medium before adding fetal bovine serum)
- Phosphate buffered saline (PBS) (GE Healthcare, catalog number: SH30256 )
- Trypsin solution (2.5%, wt/vol) (GE Healthcare, catalog number: SH30042.01 )
- Fatal bovine serum (FBS) (Sigma-Aldrich, catalog number: F2442 )
- Trypan blue (Sigma-Aldrich, catalog number: T9154 )
- Trichloroacetic acid (TCA) (Sigma-Aldrich, catalog number: 91228 )
- Sulforhodamine B sodium salt (SRB) (Sigma-Aldrich, catalog number: S1402 ) in 1% (vol/vol) acetic acid
- Acetic acid (Thermo Fisher Scientific, Fisher Scientific, catalog number: S25118 )
- 10 mM unbuffered Tris base solution (Sigma-Aldrich)
- DNAse/RNase free water (Thermo Fisher Scientific, AmbionTM, catalog number: AM9932 )
- Lipofectamine RNAimax (Thermo Fisher Scientific, InvitrogenTM, catalog number: 13778150 )
- Mirvana miRNA mimics (Thermo Fisher Scientific, AmbionTM)
- miRNA precursor molecules - negative control #2 (non-targeting scramble miRNA) (Thermo Fisher Scientific, AmbionTM, catalog number: AM17111 )
Equipment
- Pipettes (Mettler-Toledo International, catalog numbers: L-1000XLS )
- Pipettes (Mettler-Toledo International, catalog numbers: L200-XLS )
- Pipettes (Mettler-Toledo International, catalog numbers: L20-XLS )
- Pipettes (Mettler-Toledo International, catalog numbers: L2-XLS )
- Multichannel pipettes (Mettler-Toledo International, catalog numbers: L12-200XLS )
- Multichannel pipettes (Mettler-Toledo International, catalog numbers: L12-20XLS )
- MatrixTM multichannel electronic pipette (384-well format) (Thermo Fisher Scientific, Thermo ScientificTM, catalog numbers: 2011 )
- MatrixTM multichannel electronic pipette (96-well format) (Thermo Fisher Scientific, Thermo ScientificTM, catalog numbers: 2004 )
- CO2 incubator (Panasonic Biomedical Sales Europe, model: MCO-230AIC-UV )
- Inverted microscope (Nikon, model: TS100 )
- Multiwell microplate reader (Glomax, Promega)
- Hematocytometer (Hausser Scientific, Bright-LineTM, catalog number: 1492 )
Software
- Statistical analysis software (GraphPad Prism, SPSS)
Procedure
- Treatment solution preparation
- Volumes of treatment of choice should be enough for triplicates in 96-well plates (50 μl per replicate; final volume in well 100 μl) or six replicates in 384-well plates (10 μl per replicate; final volume in well 20 μl) and also account for pipetting variation.
- Treatment can be prepared in aqueous solution (Opti-MEM for transfections) or solvent of choice (e.g., DMSO).
- Volumes of treatment of choice should be enough for triplicates in 96-well plates (50 μl per replicate; final volume in well 100 μl) or six replicates in 384-well plates (10 μl per replicate; final volume in well 20 μl) and also account for pipetting variation.
- Cell preparation
- Remove medium from cell monolayers and wash the cells once with sterilized PBS.
- Remove PBS and add 1 ml (100 mm plates) 0.25% (wt/vol) trypsin to evenly cover the cell-growth surface.
- Incubate at 37 °C for 5 min or until cells start to dissociate.
- Next inactivate trypsin with 10 volumes of culture medium containing FBS, and mix up and down to obtain a homogeneous single cell suspension.
- Transfer the cell suspension to a sterile Falcon tube. Determine the cell concentration by counting in a hematocytometer chamber under a microscope using a 1:1 mixture of cell suspension and 0.4% (wt/vol) trypan blue solution to determine cell viability prior cell seeding. Optional: before counting, spin down cells in order to wash trypsin and resuspend in growth medium.
Note: Only proceed to next steps if cells in solution look healthy by checking trypan blue staining (Figure1).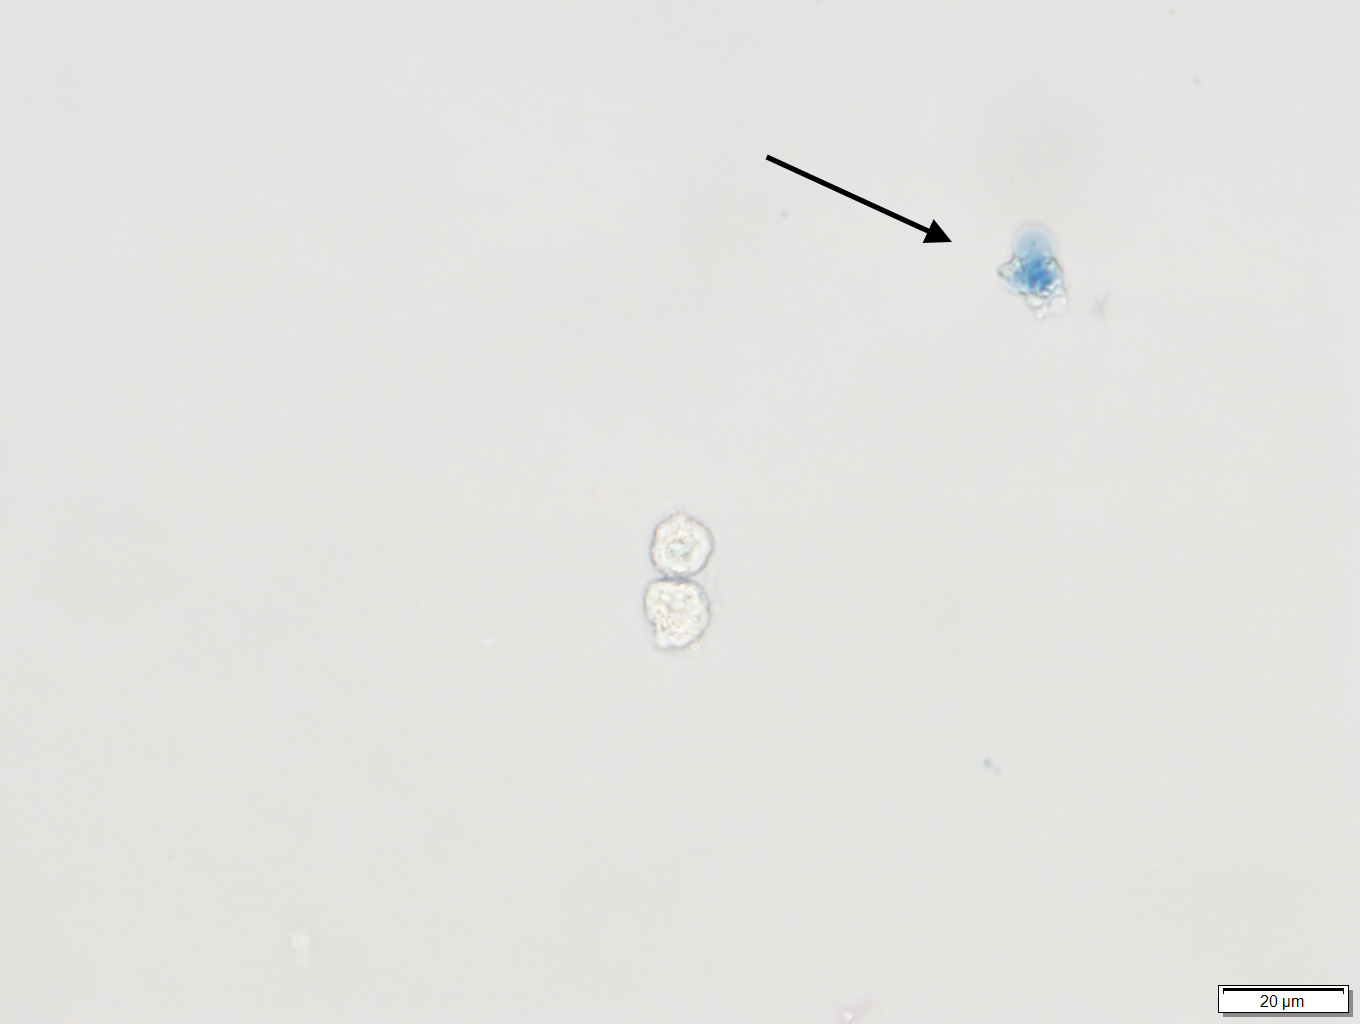
Figure 1. Trypan blue staining of human bronchial epithelial cells (HBEC). The arrow points to a colored cell indicating that the cell is dead. The live cell underneath it, has an intact membrane and thus is not colored. - Adjust the cell concentration with growth medium (10% FBS) to obtain an appropriate cell seeding density per well in a volume of 50 μl (96-well format) or 10 μl (384-well format).
Note: Initial cell seeding density will depend on two main factors: 1) doubling time of the cell line used and 2) the day the plate will be read. Cells are typically at 70-80% confluency (2 x 10⁴ for 96-well format and 8 x 10³ for 384-well format) by the end of the experiment (day 5). - Transfer the cell suspension into a sterile reagent reservoir to make it easier to pipette with a multichannel pipette.
- Remove medium from cell monolayers and wash the cells once with sterilized PBS.
- Treatment exposure
- Mix the treatment solutions prepared in step A by pipetting. Dispense 50 μl (96-well format) or 10 μl (384-well format) of solution into each well.
- Mix cell suspension prepared in step B thoroughly and add 50 μl (96-well format) or 10 μl (384-well format) to each well already containing treatment solutions.
Note: Ensure even cell distribution in the bottom of the plate and avoid shaking the plate to avoid 'ring effects'. The best way to achieve this is to add the cell solution directly to the bottom of the well, avoiding touching the walls. We also recommend performing a short spin of the plate (20 sec, 10 x g) before placing it in the incubator. - Set aside three wells in the plate containing only Opti-MEM or solvent of choice and cell suspension for an untreated or vehicle control. Also, leave three wells in the plate containing only medium for background subtraction.
- Incubate the plate at 37 °C in a humidified incubator with 5% CO2 until plate is to be read.
Note: The incubation time will depend on the type of compound being tested and has to be experimentally determined. For example, in our hands we observe the biggest difference in cell proliferation between negative control and a tumor suppressive miRNA 5 days following transfection.
- Mix the treatment solutions prepared in step A by pipetting. Dispense 50 μl (96-well format) or 10 μl (384-well format) of solution into each well.
- Cell fixation and staining
- Gently add 25 μl (96-well format) or 5 μl (384-well format) cold 50% (wt/vol) TCA to each well directly to medium supernatant, and incubate the plates at 4 °C for 1 h. Mixing is not required, as this could lead to some cells detaching from the bottom of the well.
Wash the plates four times by submerging the plate in a tub with slow-running tap water and remove excess water by gently tapping the plate into a paper towel. After the last wash allow the plate to air-dry at room temperature.
Note: Cell monolayer detachment can occur if water is forced into the wells. We recommend letting the plate dry completely before continuing to next step. If necessary, dried plates can be stored at room temperature indefinitely. - Add 50 μl (96-well format) or 20 μl (384-well format) of 0.04% (wt/vol) SRB solution to each well.
Note: Ensure that the solution is in direct contact with the bottom of the well and that there are no bubbles in between. SRB solution is not light sensitive thus plate does not need to be covered during incubation. - Leave at room temperature for 1 h and then quickly rinse the plates four times with 1% (vol/vol) acetic acid (200 μl for 96-well format or 30 μl for 384-well format) to remove unbound dye. Allow the plate to air-dry at room temperature.
Note: Non-homogeneous washes are a major source of error in this assay. Washes must be done quickly and homogeneously across the entire plate. This is particularly important for 384-well format. The small area of the wells leads to high superficial tension sometimes making it difficult to wash the plates uniformly. Visually check that all the wells in the plate have been injected with 1% (vol/vol) acetic acid and that there are no bubbles preventing the washes. We recommend washing with multi-channel pipet and injecting the solution indirectly into the wells using the walls of the wells.
- Gently add 25 μl (96-well format) or 5 μl (384-well format) cold 50% (wt/vol) TCA to each well directly to medium supernatant, and incubate the plates at 4 °C for 1 h. Mixing is not required, as this could lead to some cells detaching from the bottom of the well.
- Absorbance measurement
- Add 50 μl to 100 μl of 10 mM Tris base solution (pH 10.5) to each well and shake the plate on an orbital shaker for 10 min to solubilize the protein-bound dye (approximately 10 min).
- Measure the absorbance at 510 nm in a microplate reader.
- Add 50 μl to 100 μl of 10 mM Tris base solution (pH 10.5) to each well and shake the plate on an orbital shaker for 10 min to solubilize the protein-bound dye (approximately 10 min).
Data analysis
Subtract background absorbance from all wells. Calculate the percentage of cell-growth inhibition normalizing treatments to miRNA negative control using the following formula:
% cell growth = Absorbance sample/Absorbance negative control or untreated x 100 (Figure 2B)
% growth inhibition = 100 - % cell growth
SRB assay results can only be used if the data falls within the linearity limit of the assay. We recommend performing a cell number titration experiment to determine the linear dynamic range of the assay with the cell line used (Figure 2A). Generally, O.D. of > 2 are not within the linear range of the assay.
Statistical tests for this type of assay can include t-tests for two group comparisons or ANOVA for multiple group comparisons.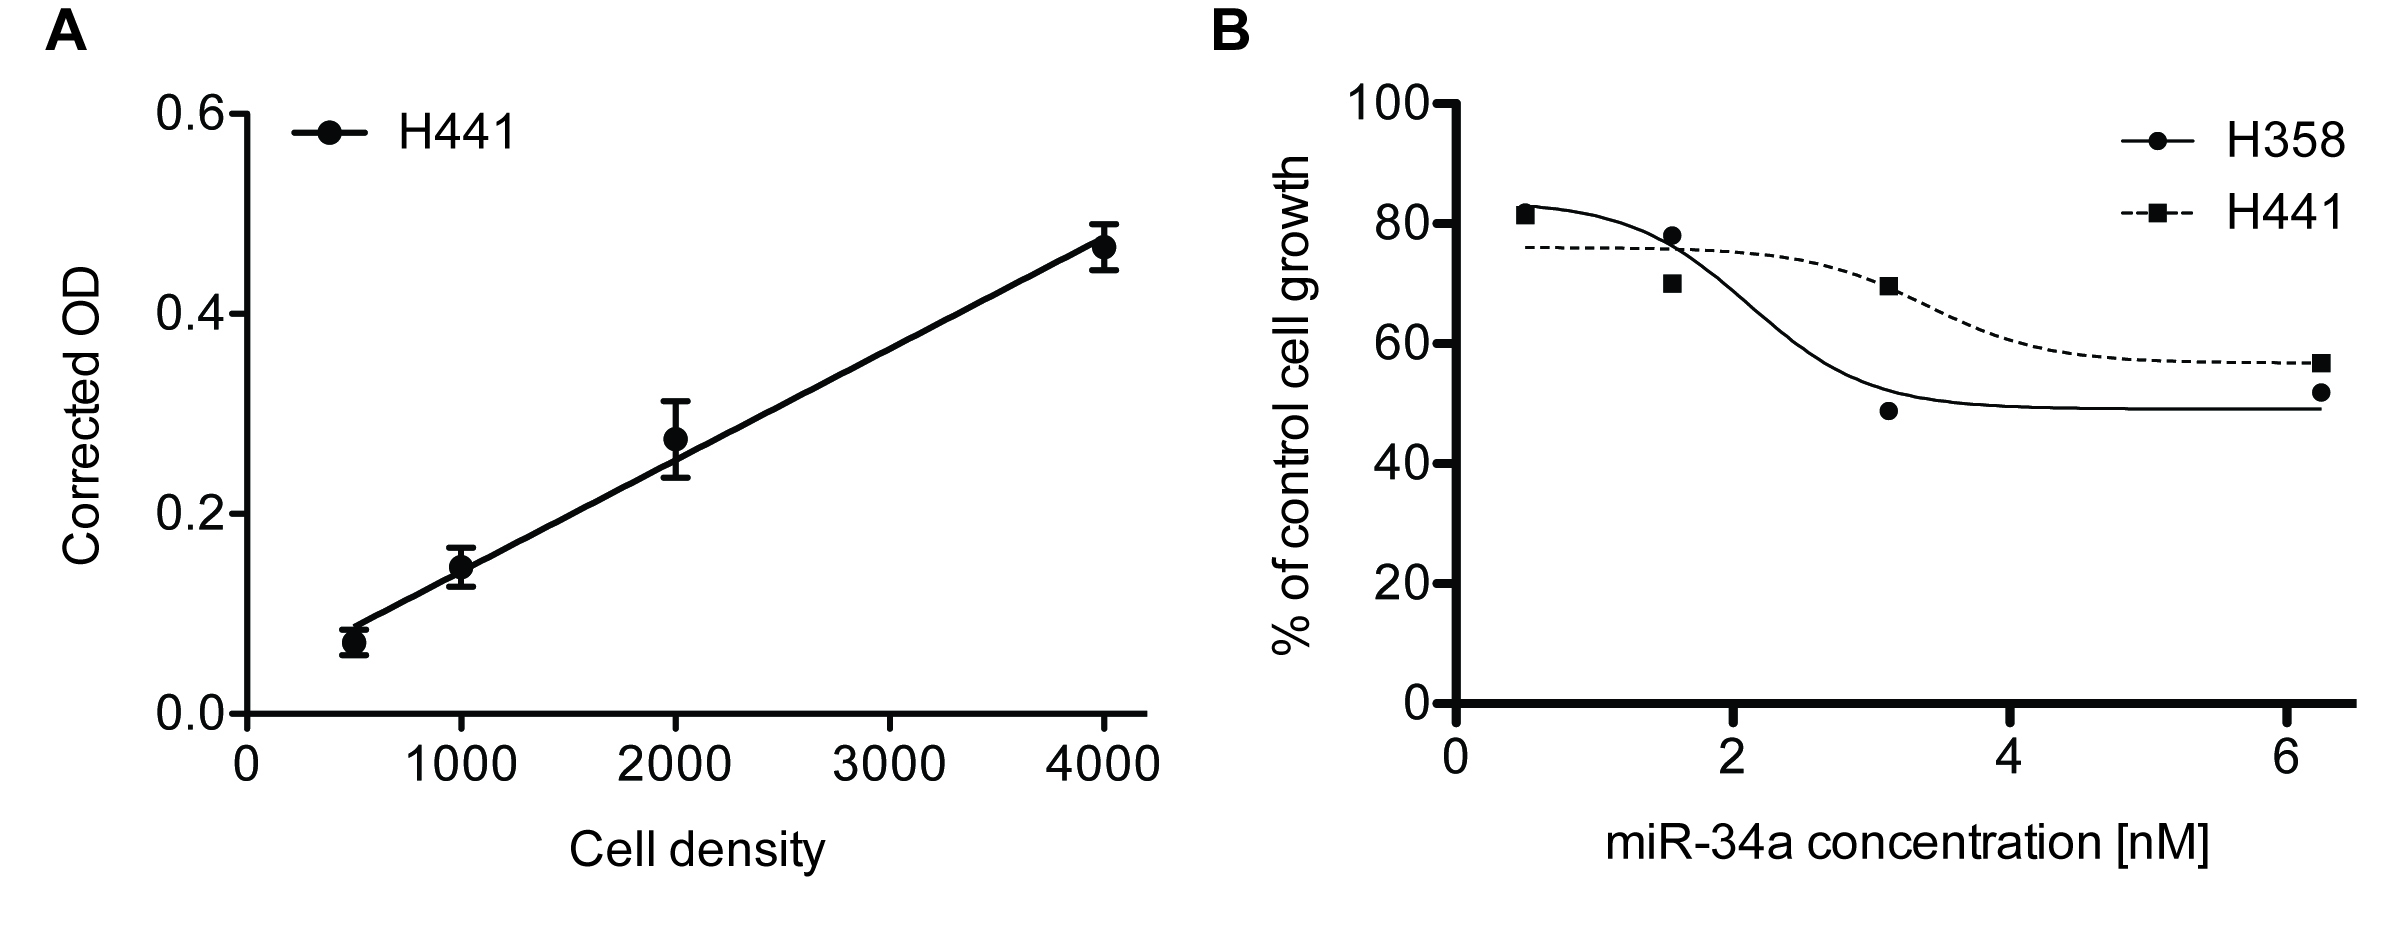
Figure 2. Sulforhodamine B colorimetric assay in cell culture to analyze cell proliferation. A. Cell number titration (H441) using the SRB assay 384-well format, n = 6, error bars = SD. B. miR-34a dose response analysis in lung cancer cell lines H441 and H358 using SRB 96-well format, n = 3.
Notes
- In our experience, the use of multichannel electronic pipettes for 384-well format assays reduces variation due to pipetting errors. For that purpose it is highly recommended that miRNA-liposomal complexes to be prepared in 96-well PCR plates, which will allow the use of multichannel pipette.
- Seeding density will depend on the doubling time of the cell line to be used as well as the day of the readout. As a rule of thumb, cells should not be allowed to reach 100% confluency by the day of the readout. From our experience, a final confluency of 80% provides satisfactory results with non-small cell lung cancer cell lines (e.g., H441, A549, EKVX).
- The day of fixation after treatment must also be determined empirically. In our experience, 4-6 days after transfection of miRNA mimics provides satisfactory results in non-small cell lung cancer cell lines showing maximal growth inhibition compared to controls.
- For miRNA transfections:
- MiRNA-liposomal complexes can be prepared in serum free/antibiotic free medium.
- The amount of Lipofectamine RNAimax must be empirically determined for each cell line to be used in order to identify the amount of reagent that provides the maximum transfection efficiency and minimal cell toxicity. This eliminates the need of changing media after transfection, which is a common source of variation in these types of assays.
- In our hands, we determined that 0.12 μl (for 96-well plastes - 100 μl) or 0.05 μl (for 96-well plates - 20 μl) of Lipofectamine RNAimax was enough to transfect 6 nM of miRNA mimic with minimal toxicity in a panel of non-small cell lung cancer cells. Each transfection should be replicated in the same plate (we recommend at least 3 replicates in a 96-well plate or 6 in a 384-well plate).
- From our experience, reverse transfection reduces the time of the assay and at the same time reduces sources of variation during changes of media before transfection, washing steps and replacement of Opti-MEM after transfection.
Acknowledgments
The protocol presented herein was adapted from Kasinski et al. (2015). This work was supported by an NIH grant (R00CA178091 and P30CA023168).
References
- Kasinski, A. L., Kelnar, K., Stahlhut, C., Orellana, E., Zhao, J., Shimer, E., Dysart, S., Chen, X., Bader, A. G. and Slack, F. J. (2015). A combinatorial microRNA therapeutics approach to suppressing non-small cell lung cancer. Oncogene 34(27): 3547-3555.
- Skehan, P., Storeng, R., Scudiero, D., Monks, A., McMahon, J., Vistica, D., Warren, J. T., Bokesch, H., Kenney, S. and Boyd, M. R. (1990). New colorimetric cytotoxicity assay for anticancer-drug screening. J Natl Cancer Inst 82(13): 1107-1112.
- Vichai, V. and Kirtikara, K. (2006). Sulforhodamine B colorimetric assay for cytotoxicity screening. Nat Protoc 1(3): 1112-1116.
Article Information
Copyright
© 2016 The Authors; exclusive licensee Bio-protocol LLC.
How to cite
Orellana, E. A. and Kasinski, A. L. (2016). Sulforhodamine B (SRB) Assay in Cell Culture to Investigate Cell Proliferation. Bio-protocol 6(21): e1984. DOI: 10.21769/BioProtoc.1984.
Category
Cancer Biology > General technique > Cell biology assays
Cell Biology > Cell viability > Cell proliferation
Do you have any questions about this protocol?
Post your question to gather feedback from the community. We will also invite the authors of this article to respond.