- Protocols

- Articles and Issues
- For Authors
- About
- Become a Reviewer

Reporter Assay for Semen-mediated Enhancement of HIV-1 Infection


Published: Vol 6, Iss 14, Jul 20, 2016 DOI: 10.21769/BioProtoc.1871 Views: 11336
Reviewed by: Yannick DebingVamseedhar RayaproluValeria Lulla
Original research article
The authors used this protocol in:

Sep 2015
Advertisement


Protocol Collections
Comprehensive collections of detailed, peer-reviewed protocols focusing on specific topics


Related protocols

Abstract
Semen contains amyloid fibrils that enhance HIV-1 infection (Münch et al., 2007; Kim et al., 2010; Roan et al., 2011; Arnold et al., 2012; Usmani et al., 2014; Roan et al., 2014). Positively charged semen amyloids capture negatively charged viral particles and increase their attachment rates to the cell surface resulting in enhanced fusion and infection (Roan et al., 2009). Since semen is highly cytotoxic, we developed an assay that allows quantification of the infection enhancing activity of semen while minimizing its cell damaging activity. Here, we describe two protocols that allow the quantification of the infectivity enhancing activity of semen using a reporter cell line (TZM-bl cells) or peripheral blood mononuclear cells (PBMCs).
Keywords: HIVMaterials and Reagents
- Flat-bottom 96-well plates (Sarstedt AG, catalog number: 83.3924 )
- White 96-well polystyrene plates (Thermo Fisher Scientific, NuncTM, catalog number: 136101 )
- Round-bottom 96-well plates (Sarstedt AG, catalog number: 83.3925 )
- V-bottom 96-well plates (Sarstedt AG, catalog number: 83.3926 )
- Peripheral blood mononuclear cells (PBMCs)
Note: These cells were isolated from healthy blood donor buffy coats by Ficoll (Biocoll) gradient centrifugation (see: http://www.bio-protocol.org/e323), and stimulated with 1 µg/ml phytohaemagglutinin (PHA) and 10 ng/ml IL-2 for 3 days. - TZM-bl/JC53bl-13 (HeLa CD4+ CCR5+ LTR-luciferase and LTR-lacZ) cells (Wei et al., 2002) (National Institutes of Health AIDS Research and Reference Reagent Program, catalog number: 8129 )
- β-Galactosidase Reporter Gene Assay System for mammalian cells (Thermo Fisher Scientific, Gal-ScreenTM, catalog number: T1027 )
- Biocoll separating solution (Merck Millipore, Biochrom, catalog number: L6115 )
- Dulbecco's modified Eagle medium (DMEM) (Thermo Fisher Scientific, catalog number: 41965039 )
- Luminescent Cell Viability Assay (Promega, CellTiter-Glo®, catalog number: G7571 )
- Fetal bovine/calf serum (FCS) (Thermo Fisher Scientific, catalog number: 10270106 ) (inactivated for 30 min at 56 °C in a water bath)
- Gentamicin (Thermo Fisher Scientific, catalog number: 15710049 )
- HIV-1 stock generated by HEK293T cells transfected with proviral DNA (e.g., pBRHIV-1 NL4-3 or pBRHIV-1 NL4-3 92TH014-2, see Münch et al., 2007 and Kim et al., 2010) or from infected cells)
- HIV-1_firefly-luciferase stock [e.g., NL4-3 HIV-1_Luciferase (e.g., similar to Hiebenthal-Millow and Kirchhoff, 2002)] generated by HEK293T cells transfected with a proviral DNA encoding firefly-luciferase
- Human Interleukin-2 (IL-2) (Miltenyi Biotec, catalog number: 130-097-745 )
- L-glutamine (Thermo Fisher Scientific, catalog number: 25030081 )
- Luciferase Assay System (Promega, catalog number: E1501 )
- Penicillin-Streptomycin (PenStrep) (Thermo Fisher Scientific, catalog number: 15140122 )
- Phosphate buffered saline (PBS), no calcium, no magnesium (Thermo Fisher Scientific, catalog number: 14190094 )
- Phytohaemagglutinin (PHA) (Thermo Fisher Scientific, RemelTM, catalog number: R30852801 )
- RPMI-1640 (Thermo Fisher Scientific, catalog number: 21875034 )
- Semen (fresh or frozen)
Note: Ejaculates are collected from healthy individuals with informed consent. To minimize inter-donor variations, semen derived from > 10 individual donors are pooled and aliquoted. Before pooling (on ice) the ejaculates are allowed to liquefy for 20-30 min at room temperature. Pooled semen samples can be stored at -20 °C or -80 °C in 250 to 1,000 µl aliquots. In all experiments, semen aliquots need to be rapidly thawed, diluted, and mixed with virus. The remaining sample is discarded. - Complete medium for adherent TZM-bl cells (see Recipes)
- Complete medium for suspension primary PBMCs (see Recipes)
Equipment
- 96-well plate centrifuge (Eppendorf, model: 5804 R ) equipped with A-2-MTP rotor
- CO2 humidified incubator
- 5-50 µl 12-channel pipette (HTL, Discovery comfort, model: DV-12-50 )
- 20-200 µl 12-channel pipette (HTL, Discovery comfort, model: DV-12-200 )
- Orion II Microplate Luminometer (Titertek Berthold, catalog number: 11300010 )
Software
- Microsoft Excel (Microsoft)
- Simplicity 4.02 (Berthold Detection Systems)
Procedure
- Seed target cells
- TZM-bl cells: Seed 10,000 TZM-bl cells per well in 96-well flat-bottom plates containing 100 µl complete medium.
- PBMCs: Seed 200,000 stimulated PBMCs (1 µg/ml PHA + 10 ng/ml IL-2 for 3 days) per well in 96-well flat-bottom plates containing 100 µl complete medium.
- Culture 18-24 h at 37 °C in a 5% CO2 humidified incubator.
- The next day, without removing the medium, add 180 µl fresh complete medium containing 100 µg/ml gentamicin (and 10 ng/ml IL-2 for PBMCs).
Note: Gentamicin prevents the outgrowth of bacteria that may have contaminated the semen collection container. - Dilute HIV-1 stock in the complete medium to achieve a MOI < 1 (e.g., 0.1, 0.01, 0.001).
Note: The HIV-1 enhancing activity of semen cannot be observed at high MOIs as all target cells have been already infected in the absence of semen. - Thaw semen samples quickly in a 37 °C water bath and immediately dilute in PBS to achieve semen concentrations of 0, 0.8, 4, 20, and 100% (v/v) in a 96-well round-bottom plate.
Note: Semen’s enhancing activity is lost over time. Avoid long room temperature exposure. - Add 40 µl of respective HIV-1 dilutions to 40 µl semen dilutions (1:1) in a 96-well round-bottom plate to achieve semen concentrations of 0, 0.4, 2, 10, and 50% (v/v).
- Resuspend HIV-1/semen mixture; add 20 µl to 280 µl (1 to 15) cells in triplicates; the final cell culture concentrations of semen are 0, 0.027, 0.134, 0.67, 3.33% (v/v) (Figure 1).
Note: The low semen concentrations on the cells reduce its cytotoxic effect. - Incubate for 2-3 h at 37 °C in a 5% CO2 humidified incubator.
- Thereafter, remove the medium and add 200 µl fresh complete medium containing 100 µg/ml gentamicin.
- TZM-bl cells: Simple medium change is sufficient.
- PBMCs: Centrifuge for 5 min at 300 x g at room temperature, discard 100 µl (of 300 µl) supernatant (without cells), resuspend cells and transfer the entire sample (200 µl) into a 96-well V-bottom plate. Centrifuge for 5 min at 300 x g at room temperature, discard supernatant, resuspend cells in 200 µl of fresh complete medium with 100 µg/ml gentamicin and 10 ng/ml IL-2 and transfer into 96-well F-bottom plates.
- Incubate at 37 °C in a 5% CO2 humidified incubator.
- After 2 and 3 days, analyze all samples by light microscopy to detect the cytopathic effects (CPE) caused by HIV-1 infection, and the possible cytotoxic effects of semen.
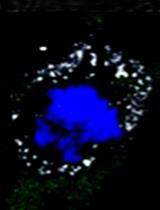
Notes: - For TZM-bl cells: In this cell line, massive HIV-1 infection results in the formation of syncytia (see Figure 2 or supplementary Figure 1 in Kim et al., 2010). If syncytia are detectable at Day 2, determine the cellular β-galactosidase activities in all samples. Continued incubation of cultures that already show CPE for another 24 h may lead to over-infection and cell loss and should be avoided. If no CPE is detectable at Day 2, incubate cells for another 24 h, and determine reporter gene activities at Day 3 post infection. Final cell culture concentrations of semen of 3.33% are sometimes cytotoxic. Therefore, we greatly recommend running cytotoxicity assay in the absence of virus in parallel.
- For PBMC: In PBMC, the HIV-1 induced CPE is less pronounced. If syncytia are detectable, determine the luciferase activities in all samples at Day 2. If no CPE is detectable at Day 2, incubate cells for another 24 h, and determine the reporter gene activities at Day 3 post infection. Note that PBMC are more susceptible to the cytotoxic effects of semen (Supplementary Figure 17 in Münch et al., 2007). Therefore, we greatly recommend running cytotoxicity assay in the absence of virus in parallel.
- Determine reporter gene activities:
- For TZM-bl cells (Figures 3 and 4) using the Gal-ScreenTM β-Galactosidase Reporter Gene Assay System
- Remove supernatant.
- Add 40 µl of lysis buffer together with substrate (mix according to the manufacturer’s instructions).
- Incubate for 30 min at room temperature.
- Transfer 35 µl of the lysed cells into a white 96-well luminometer plate.
- Read luminescence as relative light units/s in a luminometer.
- For PBMCs infected with an HIV-1 reporter virus encoding firefly luciferase using the Luciferase Assay System
- Resuspend PBMCs and transfer into a 96-well V-bottom plate.
- Centrifuge for 5 min, 550 x g at room temperature.
- Discard supernatant.
- Add 40 µl of 1x lysis buffer.
- Incubate for 10 min at room temperature.
- Resuspend and transfer 30 µl of the lysed sample into a white 96-well luminometer plate.
- Add 100 µl substrate.
- Immediately, read luminescence as relative light units/s in a luminometer.
- Evaluate raw data (Figures 3 and 4).
- Calculate average values obtained from non-infected cells (background) (Figure 3B).
- Subtract average background values from each sample (Figure 3B).
- Calculate average values and standard deviations of each triplicate measurement (Figures 3C and 4A).
- Calculate n-fold enhancement values by setting reporter gene activities observed in the absence of semen = 1 (Figures 3D and 4B).
Representative data

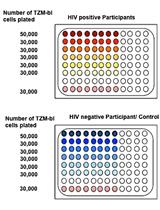
Figure 1. Typical layout of a microtiter plate used in experiments to study the effect of semen on HIV-1 infection. Cells seeded in the inner 60 wells are inoculated with HIV-1 of indicated MOIs pretreated with 0, 0.4, 2, 10 and 50 % semen, or are left uninfected. grey: PBS; white: uninfected; colored: different MOIs of HIV-1.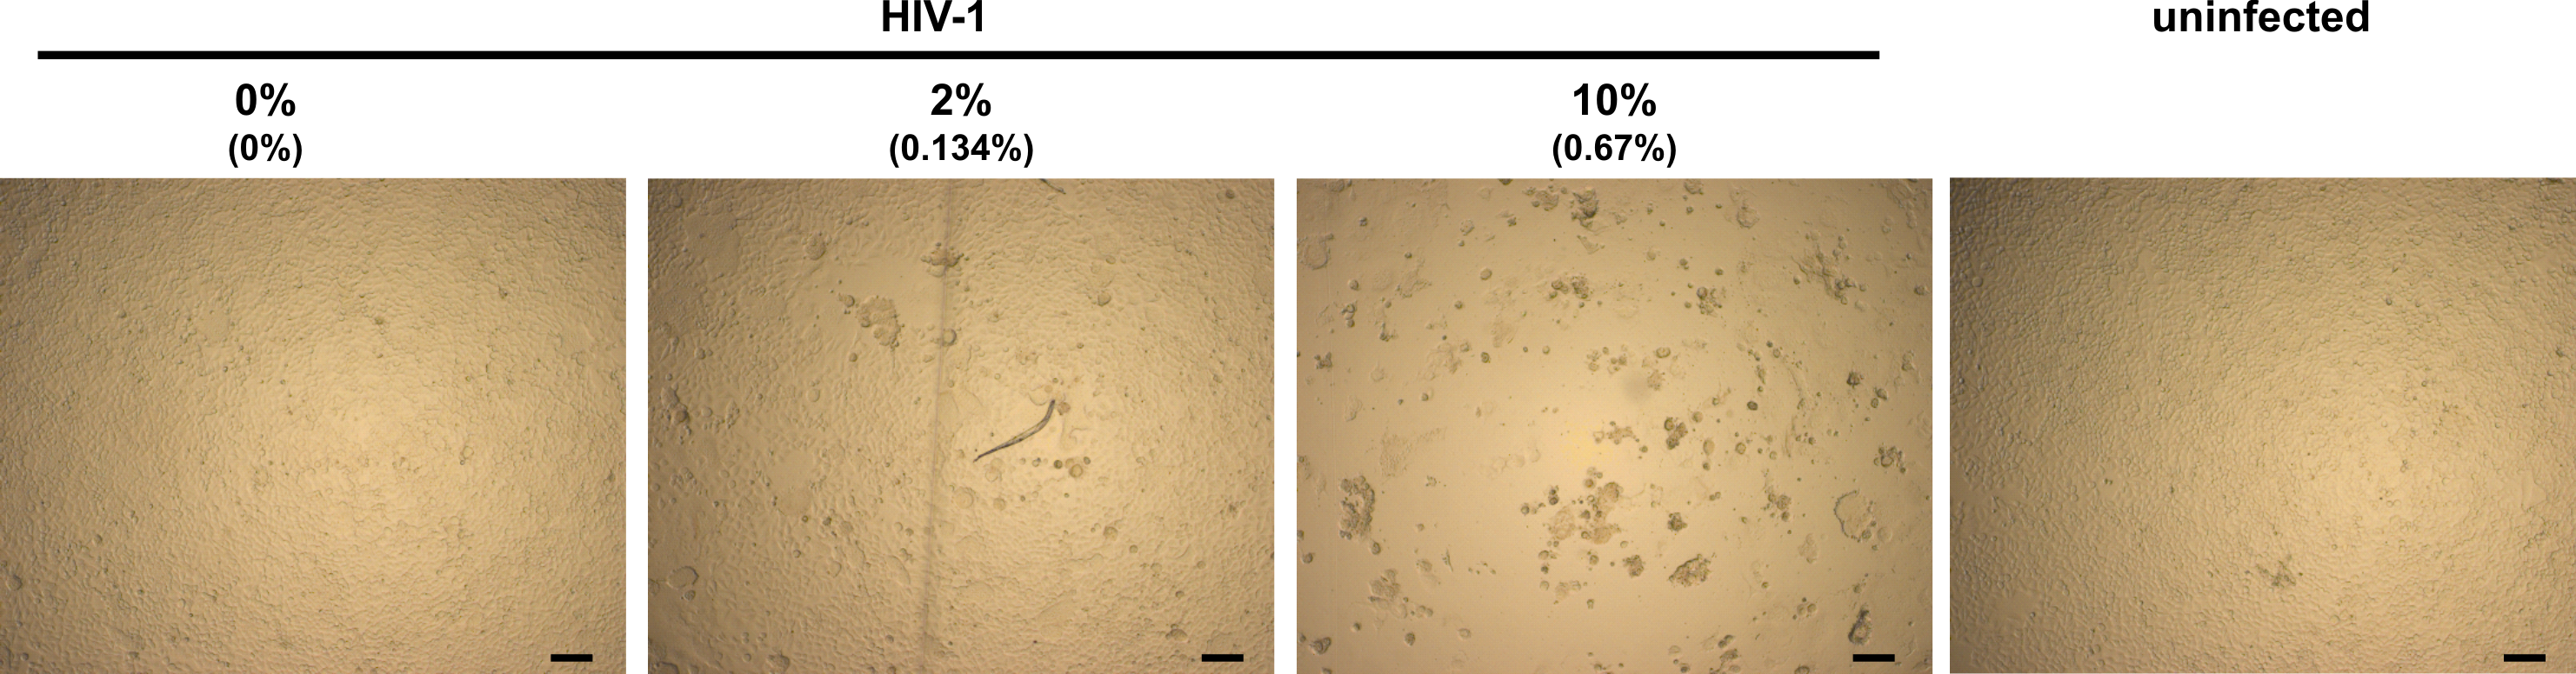
Figure 2. Light microscopy analysis of infected TZM-bl cells in presence of semen. TZM-bl cells were inoculated with PBS (uninfected) or HIV-1 that has been preincubated with indicated concentrations of semen. Final semen concentrations on cells are given in brackets. Minor (0% semen), little (2% semen) and strong (10% semen) CPE. Scale bars are 100 µm.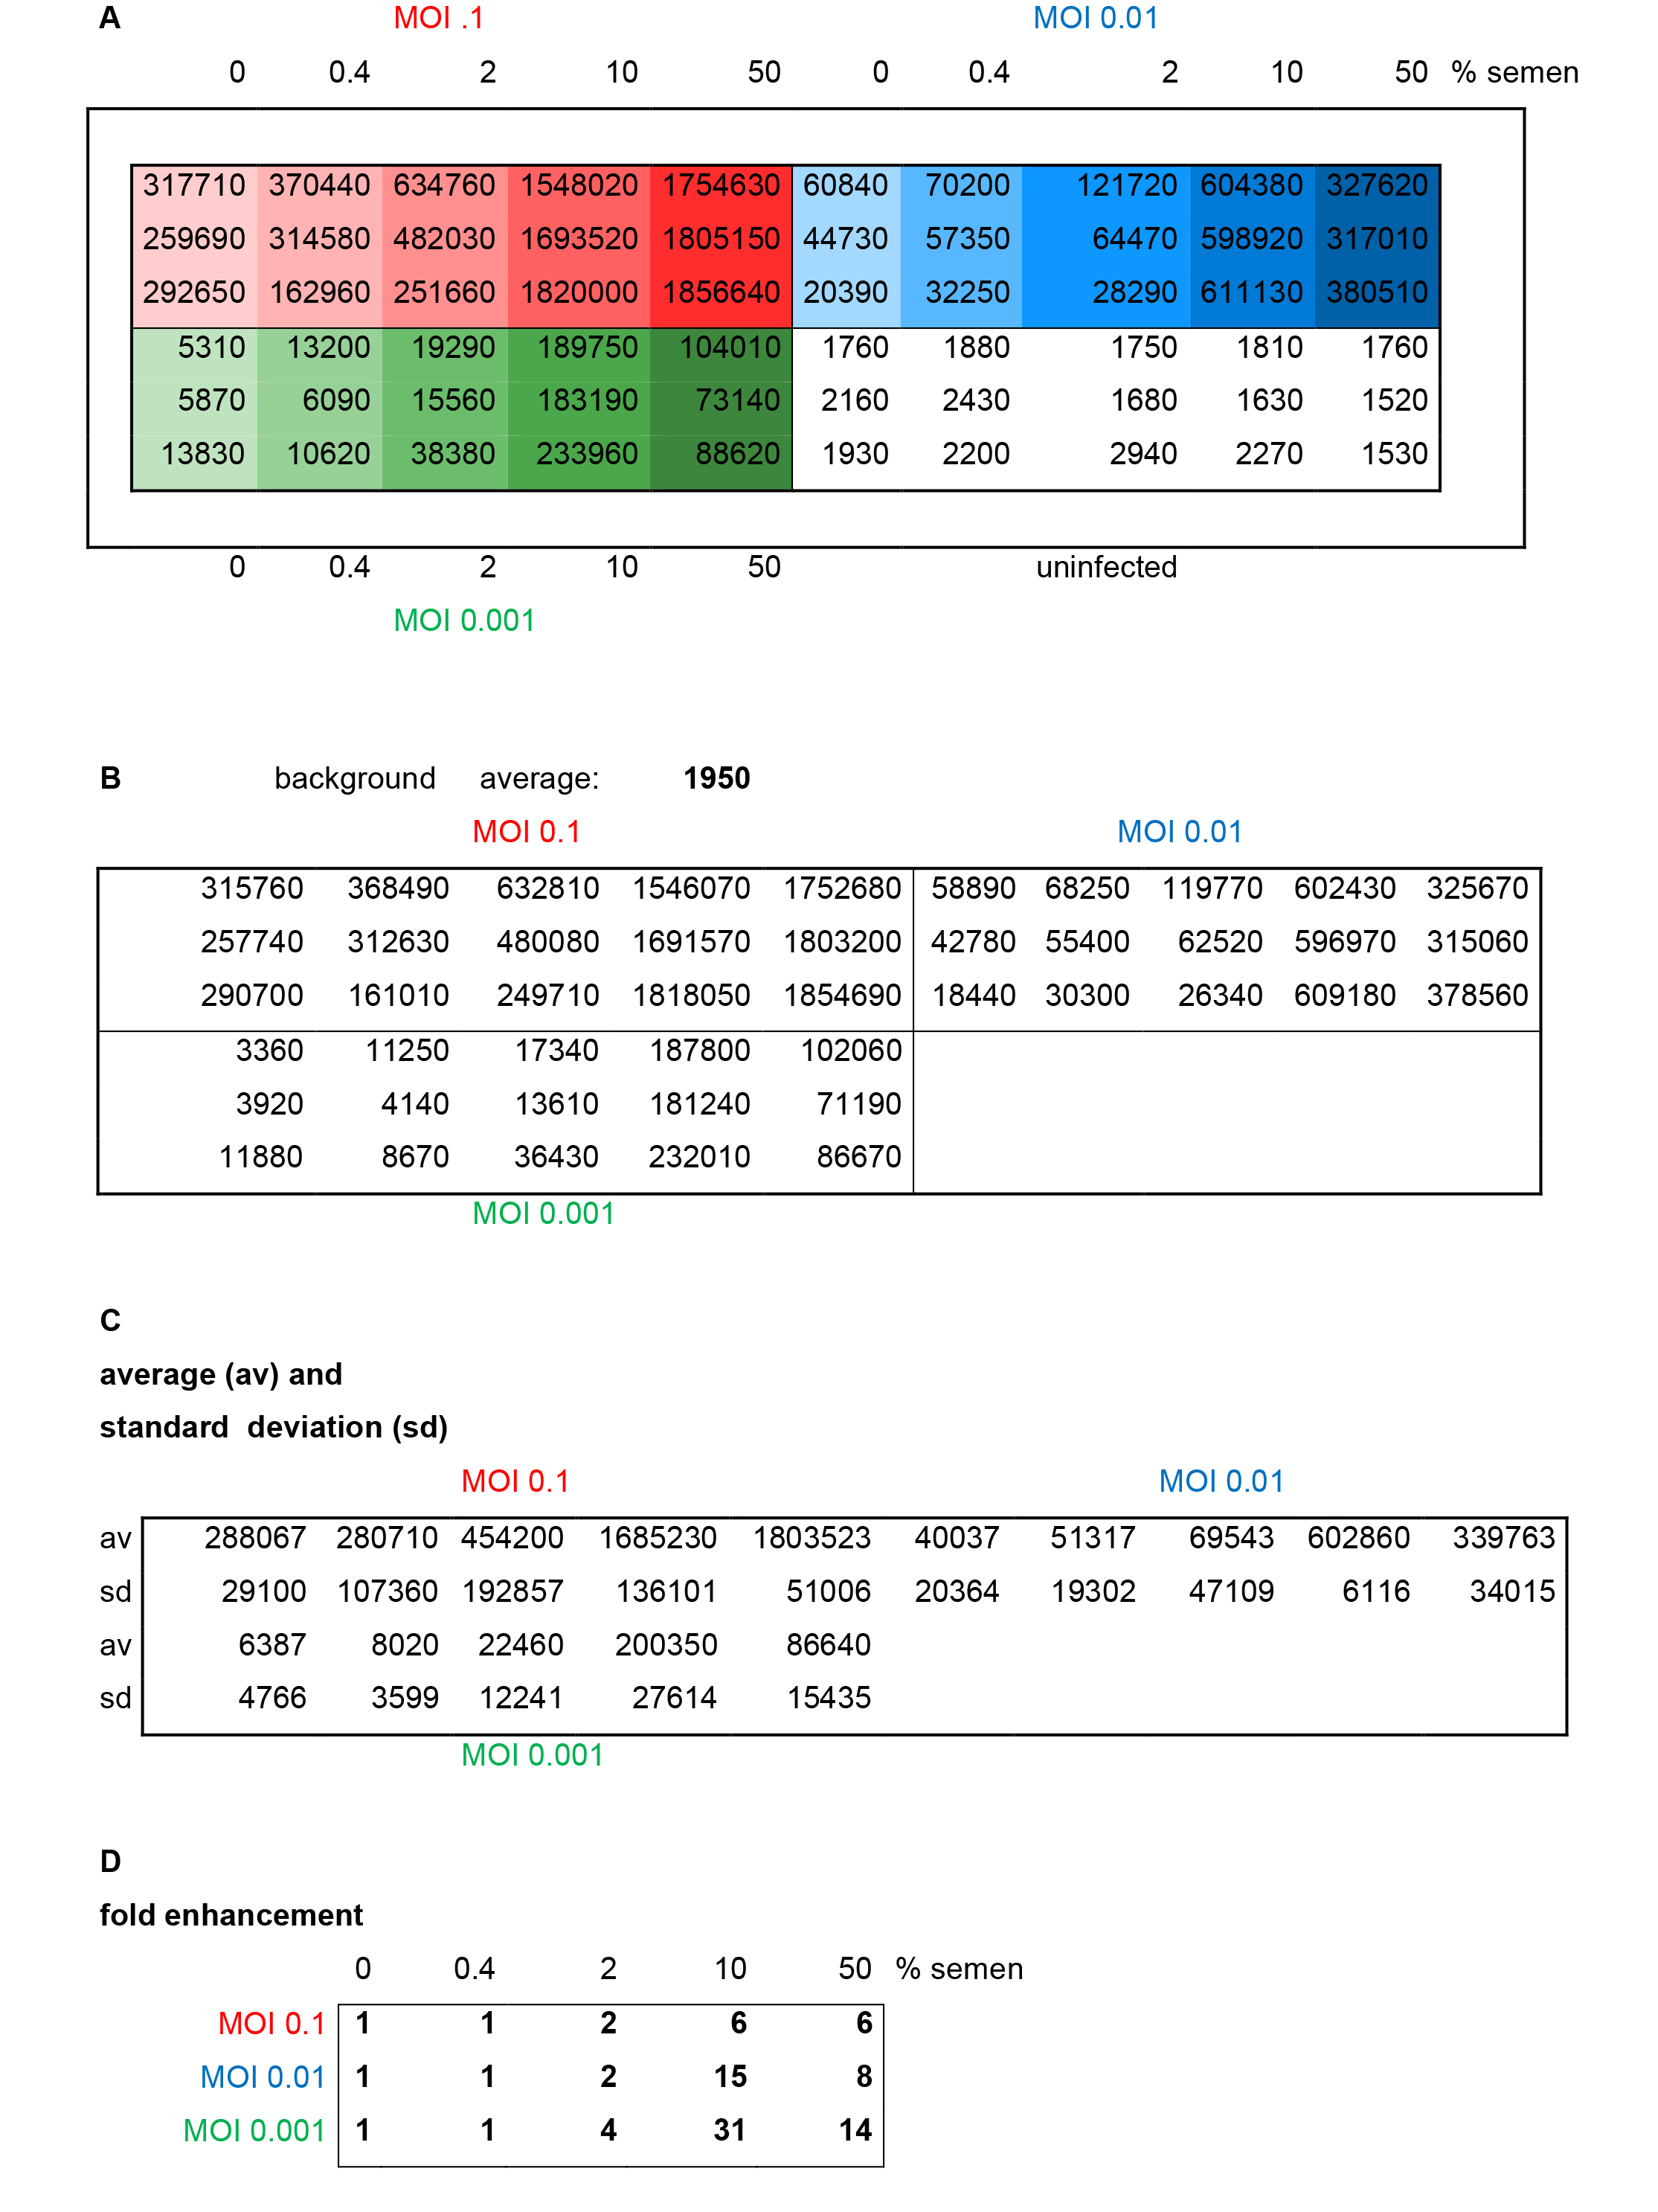
Figure 3. Results and evaluation of a representative reporter gene assay. Different MOIs (red: 0.1, blue: 0.01, green: 0.001) of HIV-1 NL4-3 92Th014-2 (R5-tropic) were preincubated with indicated concentrations of semen before infection of TZM-bl cells. A. Raw data representing relative light units/second of β-galactosidase activity measured in each well. B. Average background (uninfected cells) is calculated and subtracted. C. Average and standard deviations of triplicate infections are calculated. D. Fold enhancement is calculated by setting 0% semen sample = 1.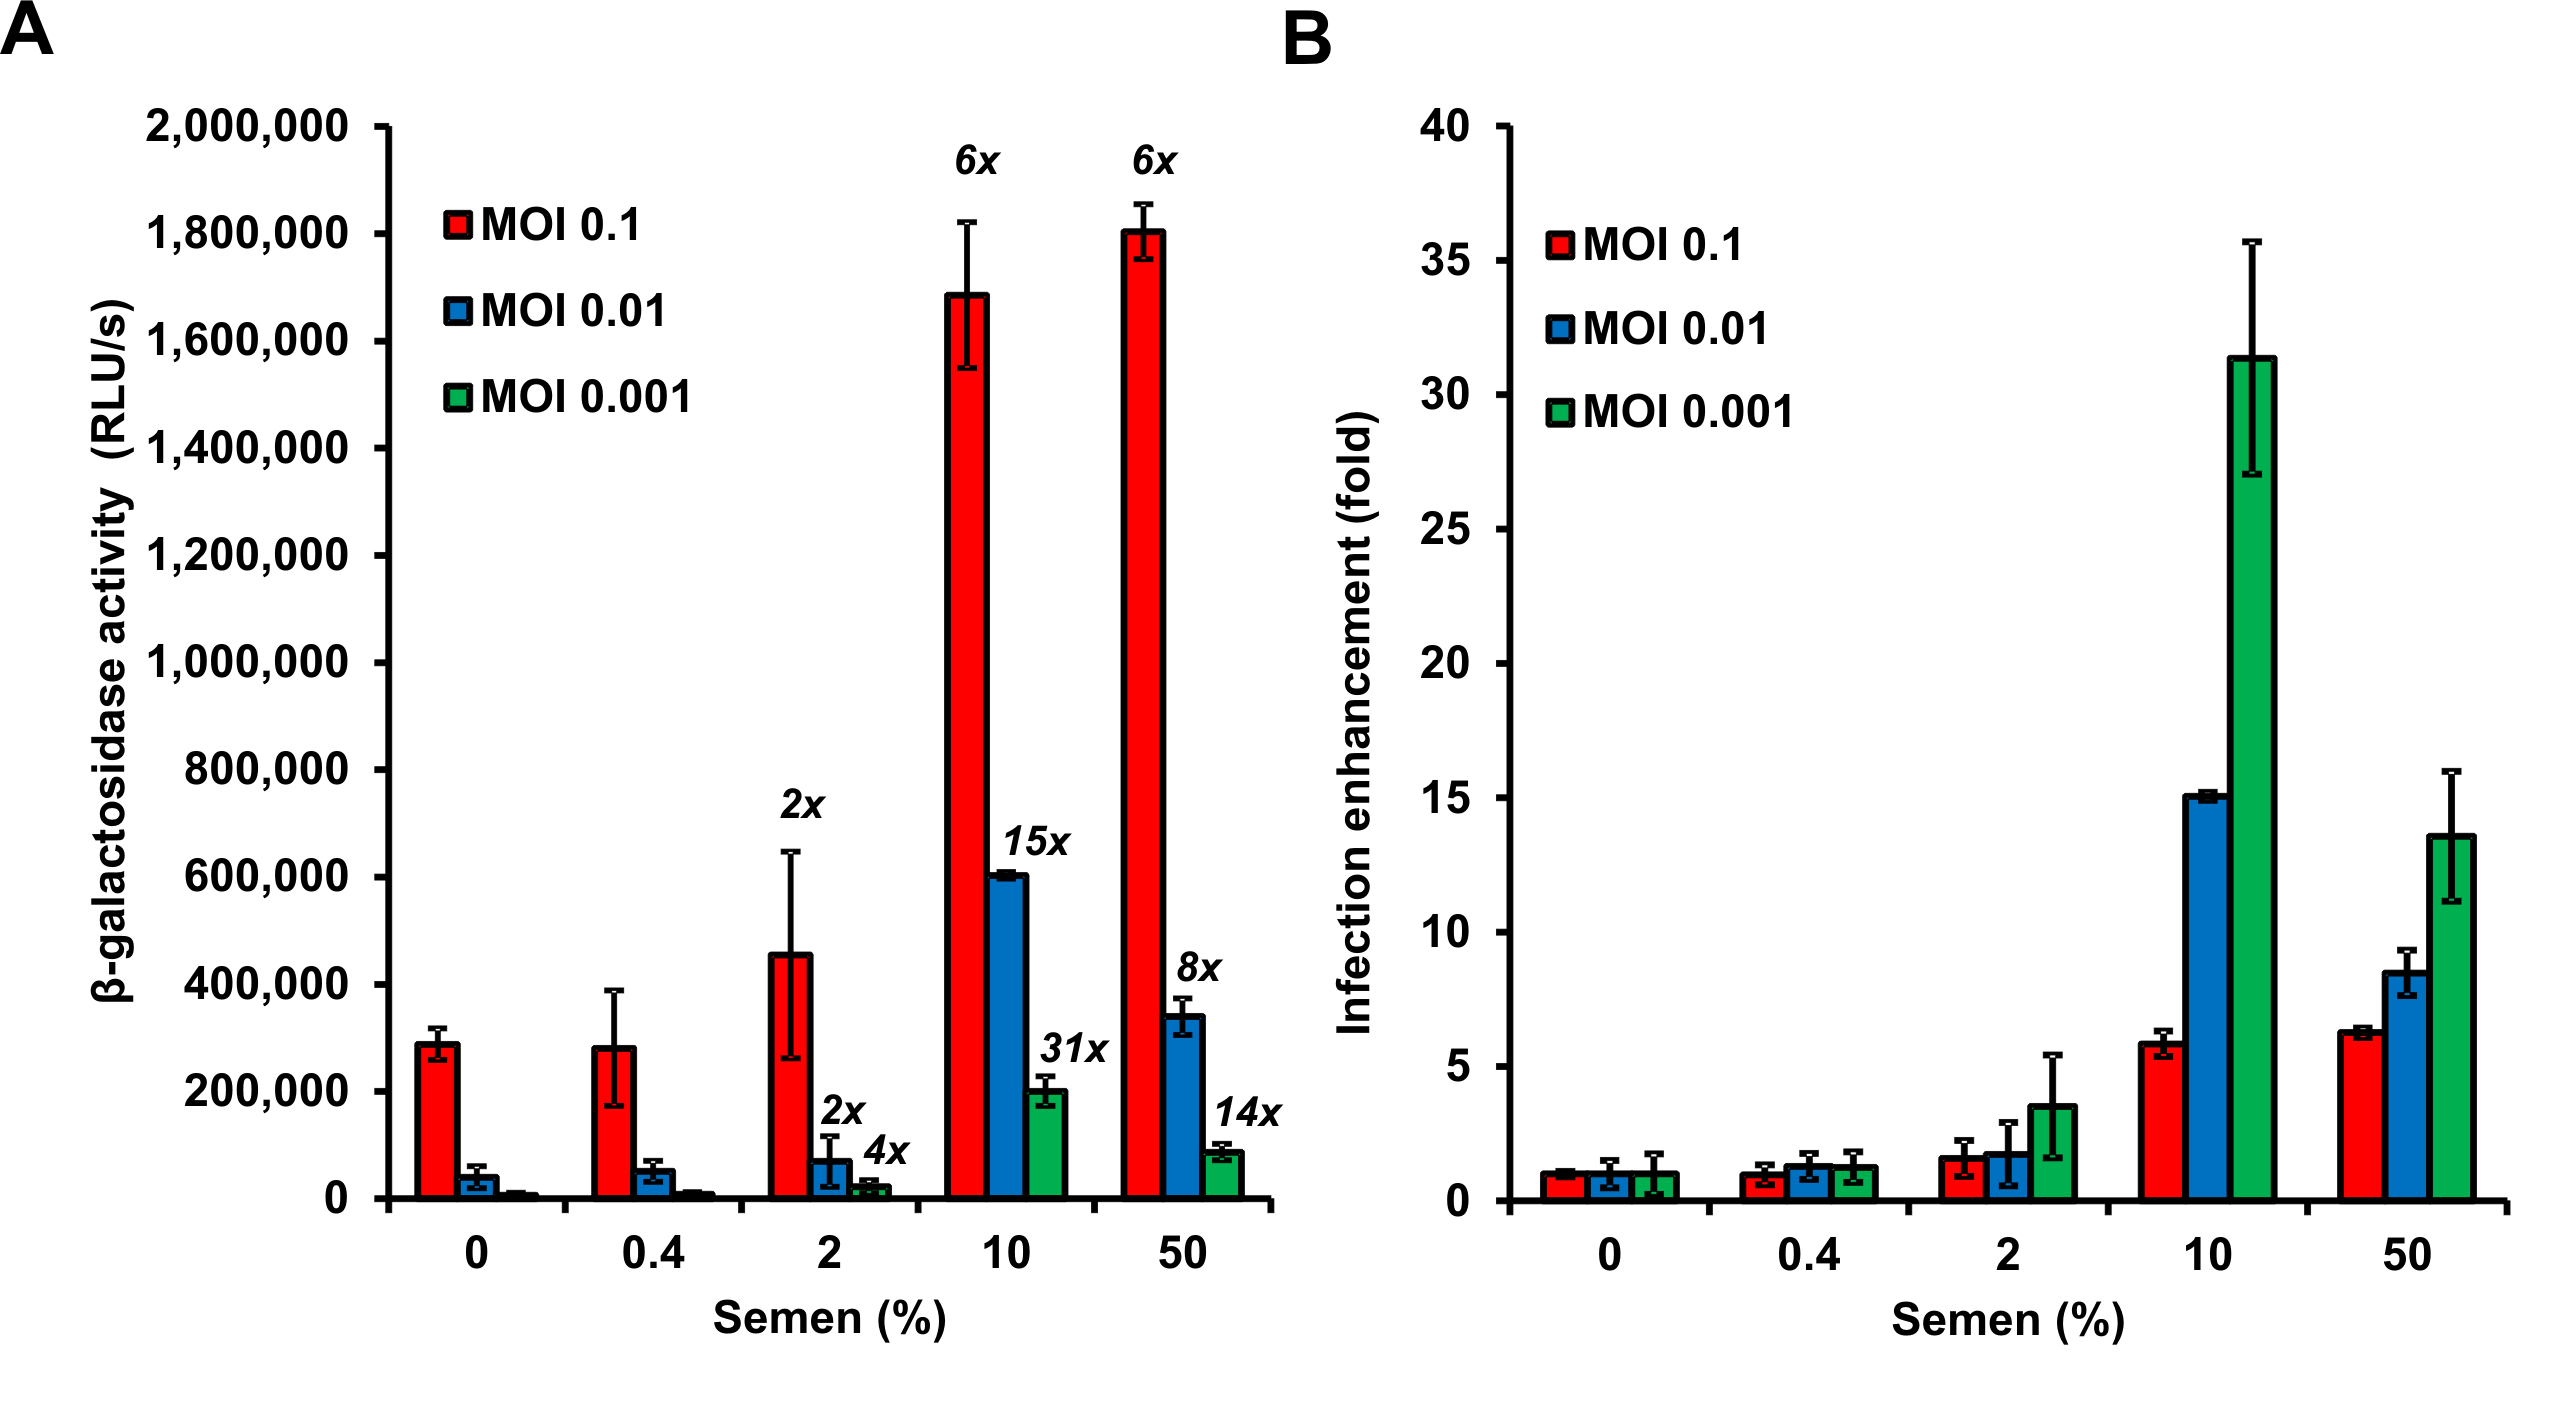
Figure 4. Graphical presentation of data described above. A. Shown are average β-galactosidase activities (n = 3) measured 3 days after virus exposure. RLU/s: relative light units per sec. The numbers above the bars give n-fold enhancement of HIV infection by semen relative to that measured for the corresponding PBS control. B. n-fold enhancement values represented as bar graphs. Values represent average values obtained from triplicate infection ± standard deviation. Note that 50% semen during virion treatment (corresponding to final cell culture concentrations of semen of 3.3 %) are cytotoxic resulting in reduced infection rates.
Notes
The following issues need to be carefully considered:
- Do not add DEAE-Dextran, polybrene, or other additives that are often used in TZM-bl assays to increase infection rates. Addition of separate enhancers will mask the infection enhancing activity of semen.
- Use low MOIs that are either sub-infectious in the absence of semen or result in infection rates of less than 10%. Only then, an enhancing effect of semen on viral infection can be determined. Furthermore, a low MOI resembles physiological HIV-1 concentrations during sexual transmission.
- The HIV-1 enhancing activity of semen decreases over time. Thus, semen needs to be handled quickly.
- Pre-exposure of virus to semen allows binding of seminal amyloids to viral particles as it likely also occurs in vivo.
- Semen, after collection, is often not sterile thus gentamicin needs to be added to avoid bacterial outgrowth.
- Even low semen concentrations (starting from 1% on cells) are cytotoxic. Therefore, semen concentrations need to be reduced and the exposure time shortened (e.g., by media change).
- In parallel, it is recommended to run cytotoxicity assays. [e.g., MTT assay (see Kim et al., 2010) or Luminescent Cell Viability Assay]
- Assay does not need to be performed in flat 96-well plates, but can also be scaled into different formats.
If these points are considered, the experimental set up can be adapted and modified to allow measurement of infection of different target cells with any HIV strain and reporter virus (i.e., GFP followed by a flow cytometry readout), as well as other viruses such as HCMV and HSV (Tang et al., 2013; Torres et al., 2015).
Infection enhancement by in vitro generated amyloid fibrils can be examined using the same protocol, except that the toxicity avoiding steps, i.e., addition of gentamicin, high volumes of medium, removal of toxic semen after 2-3 h can be omitted.
Recipes
- Complete medium for adherent TZM-bl cells
DMEM
10% heat-inactivated FCS
1% PenStrep
1% L-glutamine
(100 µg/ml gentamicin) - Complete medium for suspension primary PBMCs
RPMI
10% heat-inactivated FCS
1% PenStrep
1% L-glutamine
10 ng/ml IL-2
(100 µg/ml gentamicin)
Acknowledgments
This assay was first published in (Münch et al., 2007) and the protocol described in detail in (Kim et al., 2010). Thanks to Annika Röcker, Edina Lump, and Onofrio Zirafi for carefully reading and revising the protocol. Janis A. Müller is part of the International Graduate School in Molecular Medicine Ulm.
References
- Arnold, F., Schnell, J., Zirafi, O., Sturzel, C., Meier, C., Weil, T., Standker, L., Forssmann, W. G., Roan, N. R., Greene, W. C., Kirchhoff, F. and Munch, J. (2012). Naturally occurring fragments from two distinct regions of the prostatic acid phosphatase form amyloidogenic enhancers of HIV infection. J Virol 86(2): 1244-1249.
- Hiebenthal-Millow, K. and Kirchhoff, F. (2002) The most frequent naturally occurring length polymorphism in the HIV-1 LTR has little effect on proviral transcription and viral replication. Virology 292 (1), 169-75.
- Kim, K. A., Yolamanova, M., Zirafi, O., Roan, N. R., Staendker, L., Forssmann, W. G., Burgener, A., Dejucq-Rainsford, N., Hahn, B. H., Shaw, G. M., Greene, W. C., Kirchhoff, F. and Munch, J. (2010). Semen-mediated enhancement of HIV infection is donor-dependent and correlates with the levels of SEVI. Retrovirology 7: 55.
- Munch, J., Rucker, E., Standker, L., Adermann, K., Goffinet, C., Schindler, M., Wildum, S., Chinnadurai, R., Rajan, D., Specht, A., Gimenez-Gallego, G., Sanchez, P. C., Fowler, D. M., Koulov, A., Kelly, J. W., Mothes, W., Grivel, J. C., Margolis, L., Keppler, O. T., Forssmann, W. G. and Kirchhoff, F. (2007). Semen-derived amyloid fibrils drastically enhance HIV infection. Cell 131(6): 1059-1071.
- Roan, N. R., Munch, J., Arhel, N., Mothes, W., Neidleman, J., Kobayashi, A., Smith-McCune, K., Kirchhoff, F. and Greene, W. C. (2009). The cationic properties of SEVI underlie its ability to enhance human immunodeficiency virus infection. J Virol 83(1): 73-80.
- Roan, N. R., Muller, J. A., Liu, H., Chu, S., Arnold, F., Sturzel, C. M., Walther, P., Dong, M., Witkowska, H. E., Kirchhoff, F., Munch, J. and Greene, W. C. (2011). Peptides released by physiological cleavage of semen coagulum proteins form amyloids that enhance HIV infection. Cell Host Microbe 10(6): 541-550.
- Roan, N. R., Liu, H., Usmani, S. M., Neidleman, J., Muller, J. A., Avila-Herrera, A., Gawanbacht, A., Zirafi, O., Chu, S., Dong, M., Kumar, S. T., Smith, J. F., Pollard, K. S., Fandrich, M., Kirchhoff, F., Munch, J., Witkowska, H. E. and Greene, W. C. (2014). Liquefaction of semen generates and later degrades a conserved semenogelin peptide that enhances HIV infection. J Virol 88(13): 7221-7234.
- Tang, Q., Roan, N. R. and Yamamura, Y. (2013). Seminal plasma and semen amyloids enhance cytomegalovirus infection in cell culture. J Virol 87(23): 12583-12591.
- Torres, L., Ortiz, T. and Tang, Q. (2015). Enhancement of herpes simplex virus (HSV) infection by seminal plasma and semen amyloids implicates a new target for the prevention of HSV infection. Viruses 7(4): 2057-2073.
- Usmani, S. M., Zirafi, O., Muller, J. A., Sandi-Monroy, N. L., Yadav, J. K., Meier, C., Weil, T., Roan, N. R., Greene, W. C., Walther, P., Nilsson, K. P., Hammarstrom, P., Wetzel, R., Pilcher, C. D., Gagsteiger, F., Fandrich, M., Kirchhoff, F. and Munch, J. (2014). Direct visualization of HIV-enhancing endogenous amyloid fibrils in human semen. Nat Commun 5: 3508.
- Wei, X., Decker, J. M., Liu, H., Zhang, Z., Arani, R. B., Kilby, J. M., Saag, M. S., Wu, X., Shaw, G. M. and Kappes, J. C. (2002). Emergence of resistant human immunodeficiency virus type 1 in patients receiving fusion inhibitor (T-20) monotherapy. Antimicrob Agents Chemother 46(6): 1896-1905.
Article Information
Copyright
![]() Müller and Münch. This article is distributed under the terms of the Creative Commons Attribution License (CC BY 4.0).
Müller and Münch. This article is distributed under the terms of the Creative Commons Attribution License (CC BY 4.0).
How to cite
Readers should cite both the Bio-protocol article and the original research article where this protocol was used:
- Müller, J. A. and Münch, J. (2016). Reporter Assay for Semen-mediated Enhancement of HIV-1 Infection . Bio-protocol 6(14): e1871. DOI: 10.21769/BioProtoc.1871.
- Lump, E., Castellano, L. M., Meier, C., Seeliger, J., Erwin, N., Sperlich, B., Stürzel, C. M., Usmani, S., Hammond, R. M., von Einem, J., Gerold, G. 6., Kreppel, F., Bravo-Rodriguez, K., Pietschmann, T., Holmes, V. M., Palesch, D., Zirafi, O., Weissman, D., Sowislok, A., Wettig, B., Heid, C., Kirchhoff, F., Weil, T., Klärner, F. G., Schrader, T., Bitan, G., Sanchez-Garcia, E., Winter, R., Shorter, J. and Münch, J. (2015). A molecular tweezer antagonizes seminal amyloids and HIV infection. eLife 4: 05397.
Category
Microbiology > Microbe-host interactions > Virus
Microbiology > Microbial cell biology > Cell-based analysis > Reporter assay
Do you have any questions about this protocol?
Post your question to gather feedback from the community. We will also invite the authors of this article to respond.