- Protocols

- Articles and Issues
- For Authors
- About
- Become a Reviewer

Chromosome Dosage Analysis in Plants Using Whole Genome Sequencing


Published: Vol 6, Iss 13, Jul 5, 2016 DOI: 10.21769/BioProtoc.1854 Views: 13096
Reviewed by: Arsalan DaudiRainer MelzerAnonymous reviewer(s)
Original research article
The authors used this protocol in:

May 2015
Advertisement


Protocol Collections
Comprehensive collections of detailed, peer-reviewed protocols focusing on specific topics


Related protocols
Abstract
Relative chromosome dosage, i.e., increases or decreases in the number of copies of specific chromosome regions in one sample versus another, can be determined using aligned read-counts from Illumina sequencing (Henry et al., 2010). The following protocol was used to identify the different classes of aneuploids that result from uniparental genome elimination in Arabidopsis thaliana, including chromosomes that have undergone chromothripsis (Tan et al., 2015). Uniparental genome elimination results in the production of haploid progeny from crosses to specific strains called “haploid inducers” (Ravi et al., 2014). On the other hand, chromothripsis, which was first discovered in cancer genomes, is a phenomenon that results in clustered, highly rearranged chromosomes. In plants, chromothripsis has been observed as a result of genome elimination (Tan et al., 2015). Detecting variation in chromosome dosage has multiple applications beside those linked to genome elimination. For example, a dosage variant population of poplar hybrids was created by gamma-irradiation of pollen grains. Hundreds of dosage lesions, insertions and deletions, were identified using this technique and provide a way to associate loci with the phenotypic consequences observed in this population (Henry et al., 2015).
This method has been successfully used to detect changes in chromosome dosage in many different species, including Arabidopsis thaliana (Tan et al., 2015), Arabidopsis suecica (Ravi et al., 2014), rice (Henry et al., 2010) and poplar (Henry et al., 2015). It is important to note that dosage plots always indicate dosage variation relative to the control sample used (Note 1). Therefore, this approach is not suitable to detect ploidy variants (diploid vs triploid, for example). Similarly, this technique does not allow the detection of balanced chromosomal rearrangements such as reciprocal translocations.
Materials and Reagents
- 96 microTUBE plate (Covaris Inc., catalog number: 520078 )
- Genomic DNA
- Illustra Nucleon Phytopure kit (GE Healthcare, catalog number: RPN8511 )
- KAPA Hyper Prep kit (KAPA Biosystems, catalog number: KK8504 )
- NextFlex-96 adapters (Bioo Scientific, catalog number: 514106 )
- Agencourt AMPure XP (Beckman Coulter, catalog number: A63882 )
- Fresh 80% ethanol (Sigma-Aldrich, catalog number: E7023 )
- DEPC water (BioExpress, catalog number: G-3223-1L )
- Qubit dsDNA HS Assay Kit (Thermo Fischer Scientific, catalog number: Q32854 )
Equipment
- Ultrasonicator (Covaris, model: E220 Focused-ultrasonicator )
- PCR cycler with 96-well plate capacity
- Magnetic plate (Thermo Fischer Scientific, model: 12331D )
- Qubit 2.0 (Thermo Fisher Scientific, model: Q32866 )
- Illumina sequencing platform
- Nanodrop 2000 spectrophotometer (Thermo Fischer Scientific, model: ND-2000C )
Software
- Burrows-Wheeler aligner (Li and Durbin, 2009)
- bwa (http://bio-bwa.sourceforge.net/)
- bin-by-sam.py (http://comailab.genomecenter.ucdavis.edu/index.php/Bin-by-sam)
- allprep (http://comailab.genomecenter.ucdavis.edu/index.php/Barcoded_data_preparation_tools)
- bwa-doall (http://comailab.genomecenter.ucdavis.edu/index.php/Bwa-doall)
- Python2.6 or Python2.7
Procedure
- Genomic DNA fragmentation by Covaris
- Isolate high quality genomic DNA and determine concentration with a minimal yield of 1 μg of and a concentration of at least 20 ng/μl. Please see Note 2 for further details.
- Pipet 500 ng of DNA input into each well of the 96 microTUBE Plate and add nuclease-free water to reach 27 μl per well.
- Shear DNA in the E220 Covaris sonicator with the following settings:
Peak Incident Power (W) 175
Duty Factor 5%
Cycles per Burst 200
Treatment time 60 sec
Proceed directly to the KAPA PCR-free Hyper-Prep.
- Isolate high quality genomic DNA and determine concentration with a minimal yield of 1 μg of and a concentration of at least 20 ng/μl. Please see Note 2 for further details.
- KAPA PCR-free Hyper-Prep (Note 3)
- End repair and A-tailing
Fragmented DNA 25 μl
End repair & A-tailing buffer (Hyper-Prep kit) 3.5 μl
End repair & A-tailing enzyme mix (Hyper-Prep kit) 1.5 μl
Total volume 30 μl
a. Incubate in a Thermal Cycler at 20 °C for 30 min followed by 65 °C for 30 min.
b. Proceed to the ligation step immediately.
- Adapter ligation
End repair & A-tailing reaction 30 μl
DEPC water 3 μl
Ligation buffer (Hyper-Prep kit) 15 μl
DNA ligase (Hyper-Prep kit) 5 μl
Adapter stock (2.5 μM) 2 μl
Total volume 55 μl
a. Incubate at 20 °C for 15 min.
b. Proceed to post-ligation cleanup step immediately.
- Post-ligation cleanup
Adapter ligation reaction product 54 μl
Ampure (0.8x vol) 43 μl
Total volume 97 μl
- Mix gently and incubate at room temperature for 15 min to allow the DNA to bind to the beads.
- Place reactions on a magnetic plate to separate beads from the solution. When the liquid is clear, remove the supernatant and wash the beads twice with 200 μl 80% ethanol.
- Let the beads dry (as recommended by the manufacturer) before eluting with 25 μl DEPC water.
- Pool the samples. A typical pooling strategy for 96 samples, representing 96 individual libraries for dosage analysis, would be to subpool 3 μl from groups of 12 libraries. The concentration of the 8 subpools is determined using the Qubit dsDNA HS Assay Kit and equal amounts of DNA from each subpool are then combined into a master pool. The concentration of this master pool is determined using the Qubit dsDNA HS Assay Kit and can be submitted for PCR-free Illumina sequencing if it is at least 20 ng/μl with total DNA content of ~1 μg. An additional Ampure (0.8x) purification, followed by elution at a lower volume may be required to increase the final concentration of the master pool. Irrespective of the pooling strategy, sequencing reads from pooled samples can eventually be reassigned to their respective samples based on the index sequence present in the adapters because the libraries are pooled after adapter ligation.
- Submit the PCR-free libraries for sequencing [see (Note 3) for other options]. The Illumina sequencing platform used is typically single read 50 (Note 4). The number of reads needed per individual depends on the scope of the experiment and the genome size of the organism at hand [see (Notes 4, 5) as well as Figures 2 and 3].
- Mix gently and incubate at room temperature for 15 min to allow the DNA to bind to the beads.
- End repair and A-tailing
- Mapping and Dosage Plot
- Trim the reads for quality and align them onto the TAIR10 genome using the Burrows-Wheeler aligner (Li and Durbin, 2009). We have provided scripts called allprep.py as well as bwa-doall.py for this purpose. Detailed documentation of these scripts is available from the links provided.
- Convert .sai files to .sam files after alignment (If you are using the bwa-doall.py script, this step is automatically performed by the script.).
bwa samse [database] [filename]_aln.sai [filename].fq > [filename]_aln.sam
- Run bin-by-sam.py in a folder that contains the sam files to generate dosage plots. Highly detailed directions and examples for this script is available from on the main documentation page or can be accessed directly here: http://comailab.genomecenter.ucdavis.edu/images/3/30/README-bin-by-sam.pdf.
bin-by-sam.py -o output-bin-file.txt -s size-of-bins [-c control.sam file] [-u] [-m number of max snps, default is 5] [-b] [-r] [-p ploidy for relative percent calculation] [-C].
For help on the meaning of different parameters: bin-by-sam.py –h.
Input:
Run the script in a directory with the input _aln .sam files.
Output:
One file with a line per non-overlapping, consecutive bin along each of the reference sequences and two columns for each input .sam file: one indicating the number of reads mapping to each bin and the other indicating the corresponding dosage relative to the control.
Specific example: Recommended initial dosage plot analysis based on 1 Mb-sized bins in folder containing a group of .sam files as a starting point.
bin-by-sam.py -o 1Mb_bin.txt -s 1000000
After running this initial analysis, the obtained read counts can be used as an indication of the appropriate minimum bin size. As a rule of thumb, no less than an average of 100 read counts per bin should be used (see Figures 2 and 3).
- Parameters
Required:
-o, output file name (for example “-o Dosage_100kb_control2.txt”)
-s, bin size in bps (for example “-s 100000” for 100 kb bins)
Optional:
-c, to use a control sample for relative percent coverage calculations, specify the file name here. If no file is specified, the mean of all samples is used as control value for each bin (Note 1).
-u, to use only samtools flagged unique reads (XT: A: U), in which the read maps uniquely to only one location in the genome.
-m, to specify the maximum number of mapping mismatches allowed for a read to be used. This looks at .sam field 15. The default is 5. This option can be increased if reads are longer or a high number of polymorphisms are expected between the reference genome and the aligned reads. Of course, the most important consideration is to ensure that the same criteria are used for all samples.
-b, inserts empty lines between reference sequences in the result table for easier JMP parsing (Do not use if the reference sequence contains more than few major chromosomes or contigs).
-r, “remove file”, a file containing a list of reference sequences to ignore, in the sam header format. There is an included example file Remove-Sample.txt in the archive. This option can be useful if the organelle sequences are included in the genomic sequence for example (Note 6).
-p, ploidy, default is 2 (diploid), this is used as the multiplier in the relative dosage calculation.
-C, coverage only mode, which only outputs the read counts columns for each library, but not the relative dosage columns. This option cannot be used when a control library is specified.
- Data analysis
The [sample]/control columns are plotted as an Overlay Plot on JMP for visualization (Figure 1). Other software platforms with graphing functions such as R can also be used as an alternative to JMP for generating the overlay plots for each (sample)/control column.
- Trim the reads for quality and align them onto the TAIR10 genome using the Burrows-Wheeler aligner (Li and Durbin, 2009). We have provided scripts called allprep.py as well as bwa-doall.py for this purpose. Detailed documentation of these scripts is available from the links provided.
Representative data
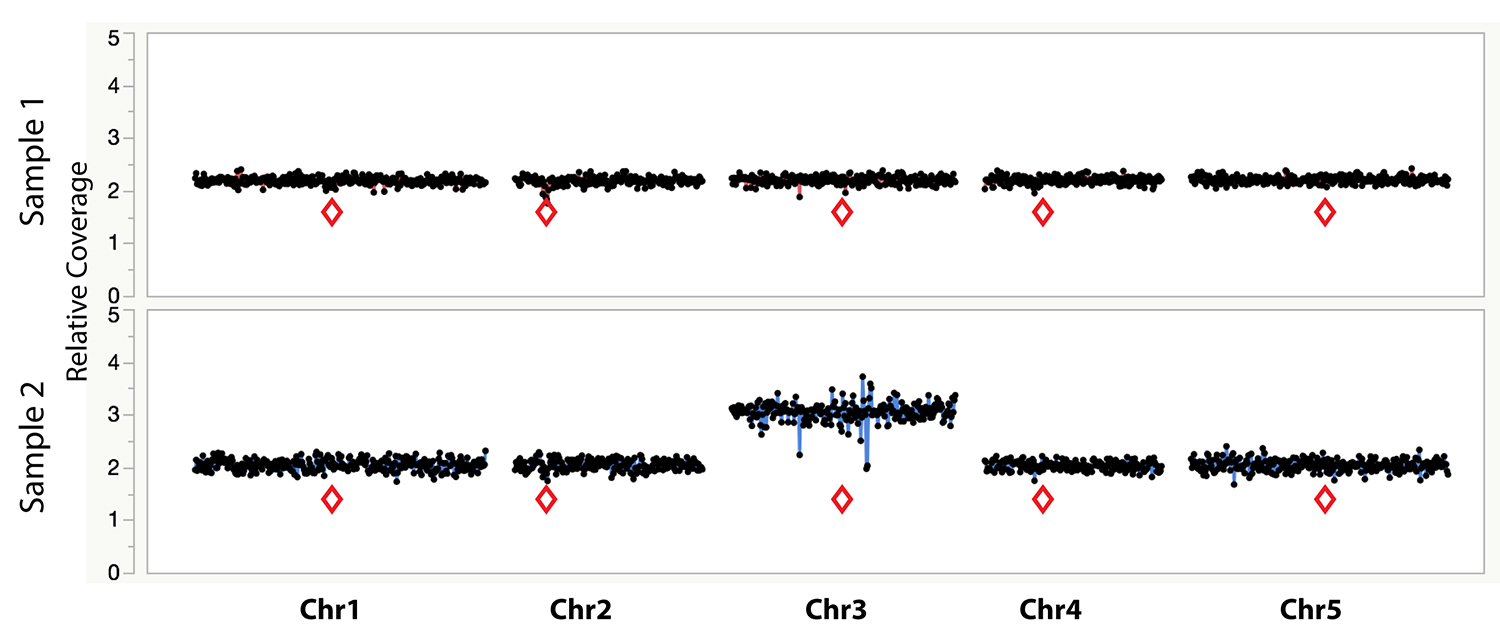
Figure 1. Example dosage plot of a diploid (Sample 1) and a primary Chr3 trisomic (2n + 1) aneuploid (Sample 2) from Arabidopsis thaliana, based on a 100 kb bin size. Relative centromere positions are indicated by red diamonds. The noisy area around the pericentromeric regions of the trisomic Chr3 is due to increased Col-0:Ler ratio (2:1) of the trisomic chromosome when normalized to a diploid control that contains 50% Col-0 (or 1:1 Col-0:Ler). This variability is absent from the 50% Col-0:Ler diploid individual (Sample 1). Reviewing multiple individuals from the same dataset can identify regions with such variation.
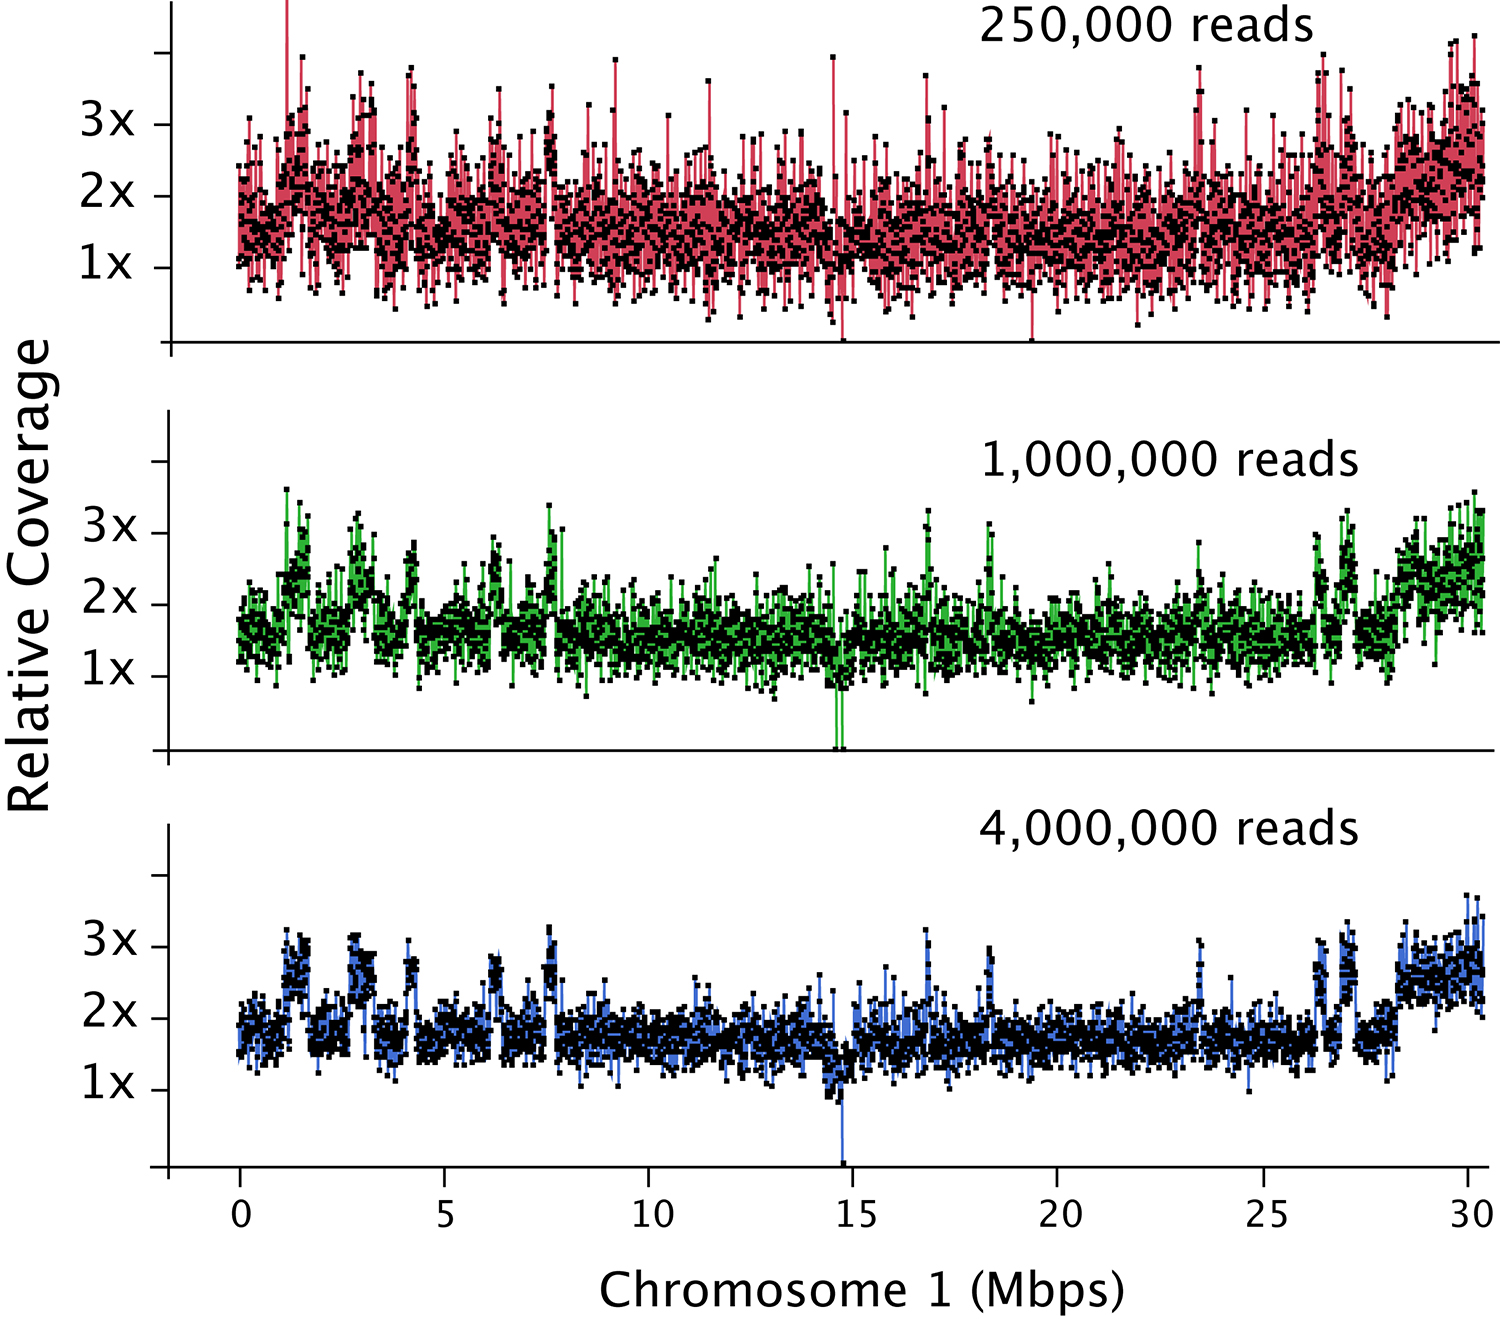
Figure 2. Dosage plot analysis on a shattered aneuploid Chr1 from Arabidopsis thaliana divided in 50 kb bins (each dot represents a bin) and using variable number of reads as input: 250,000 reads (top), 1 million reads (middle) and 4 million reads (bottom). This data illustrates how increased read count is necessary for the detection of smaller dosage variations. For species with bigger genome sizes, the number of reads necessary to obtain a similar level of detection increases accordingly. Similarly, for polyploid genomes, read coverage has to be higher to compensate for the relatively smaller increase or decrease in copy number in a higher ploidy background (Figure 3).
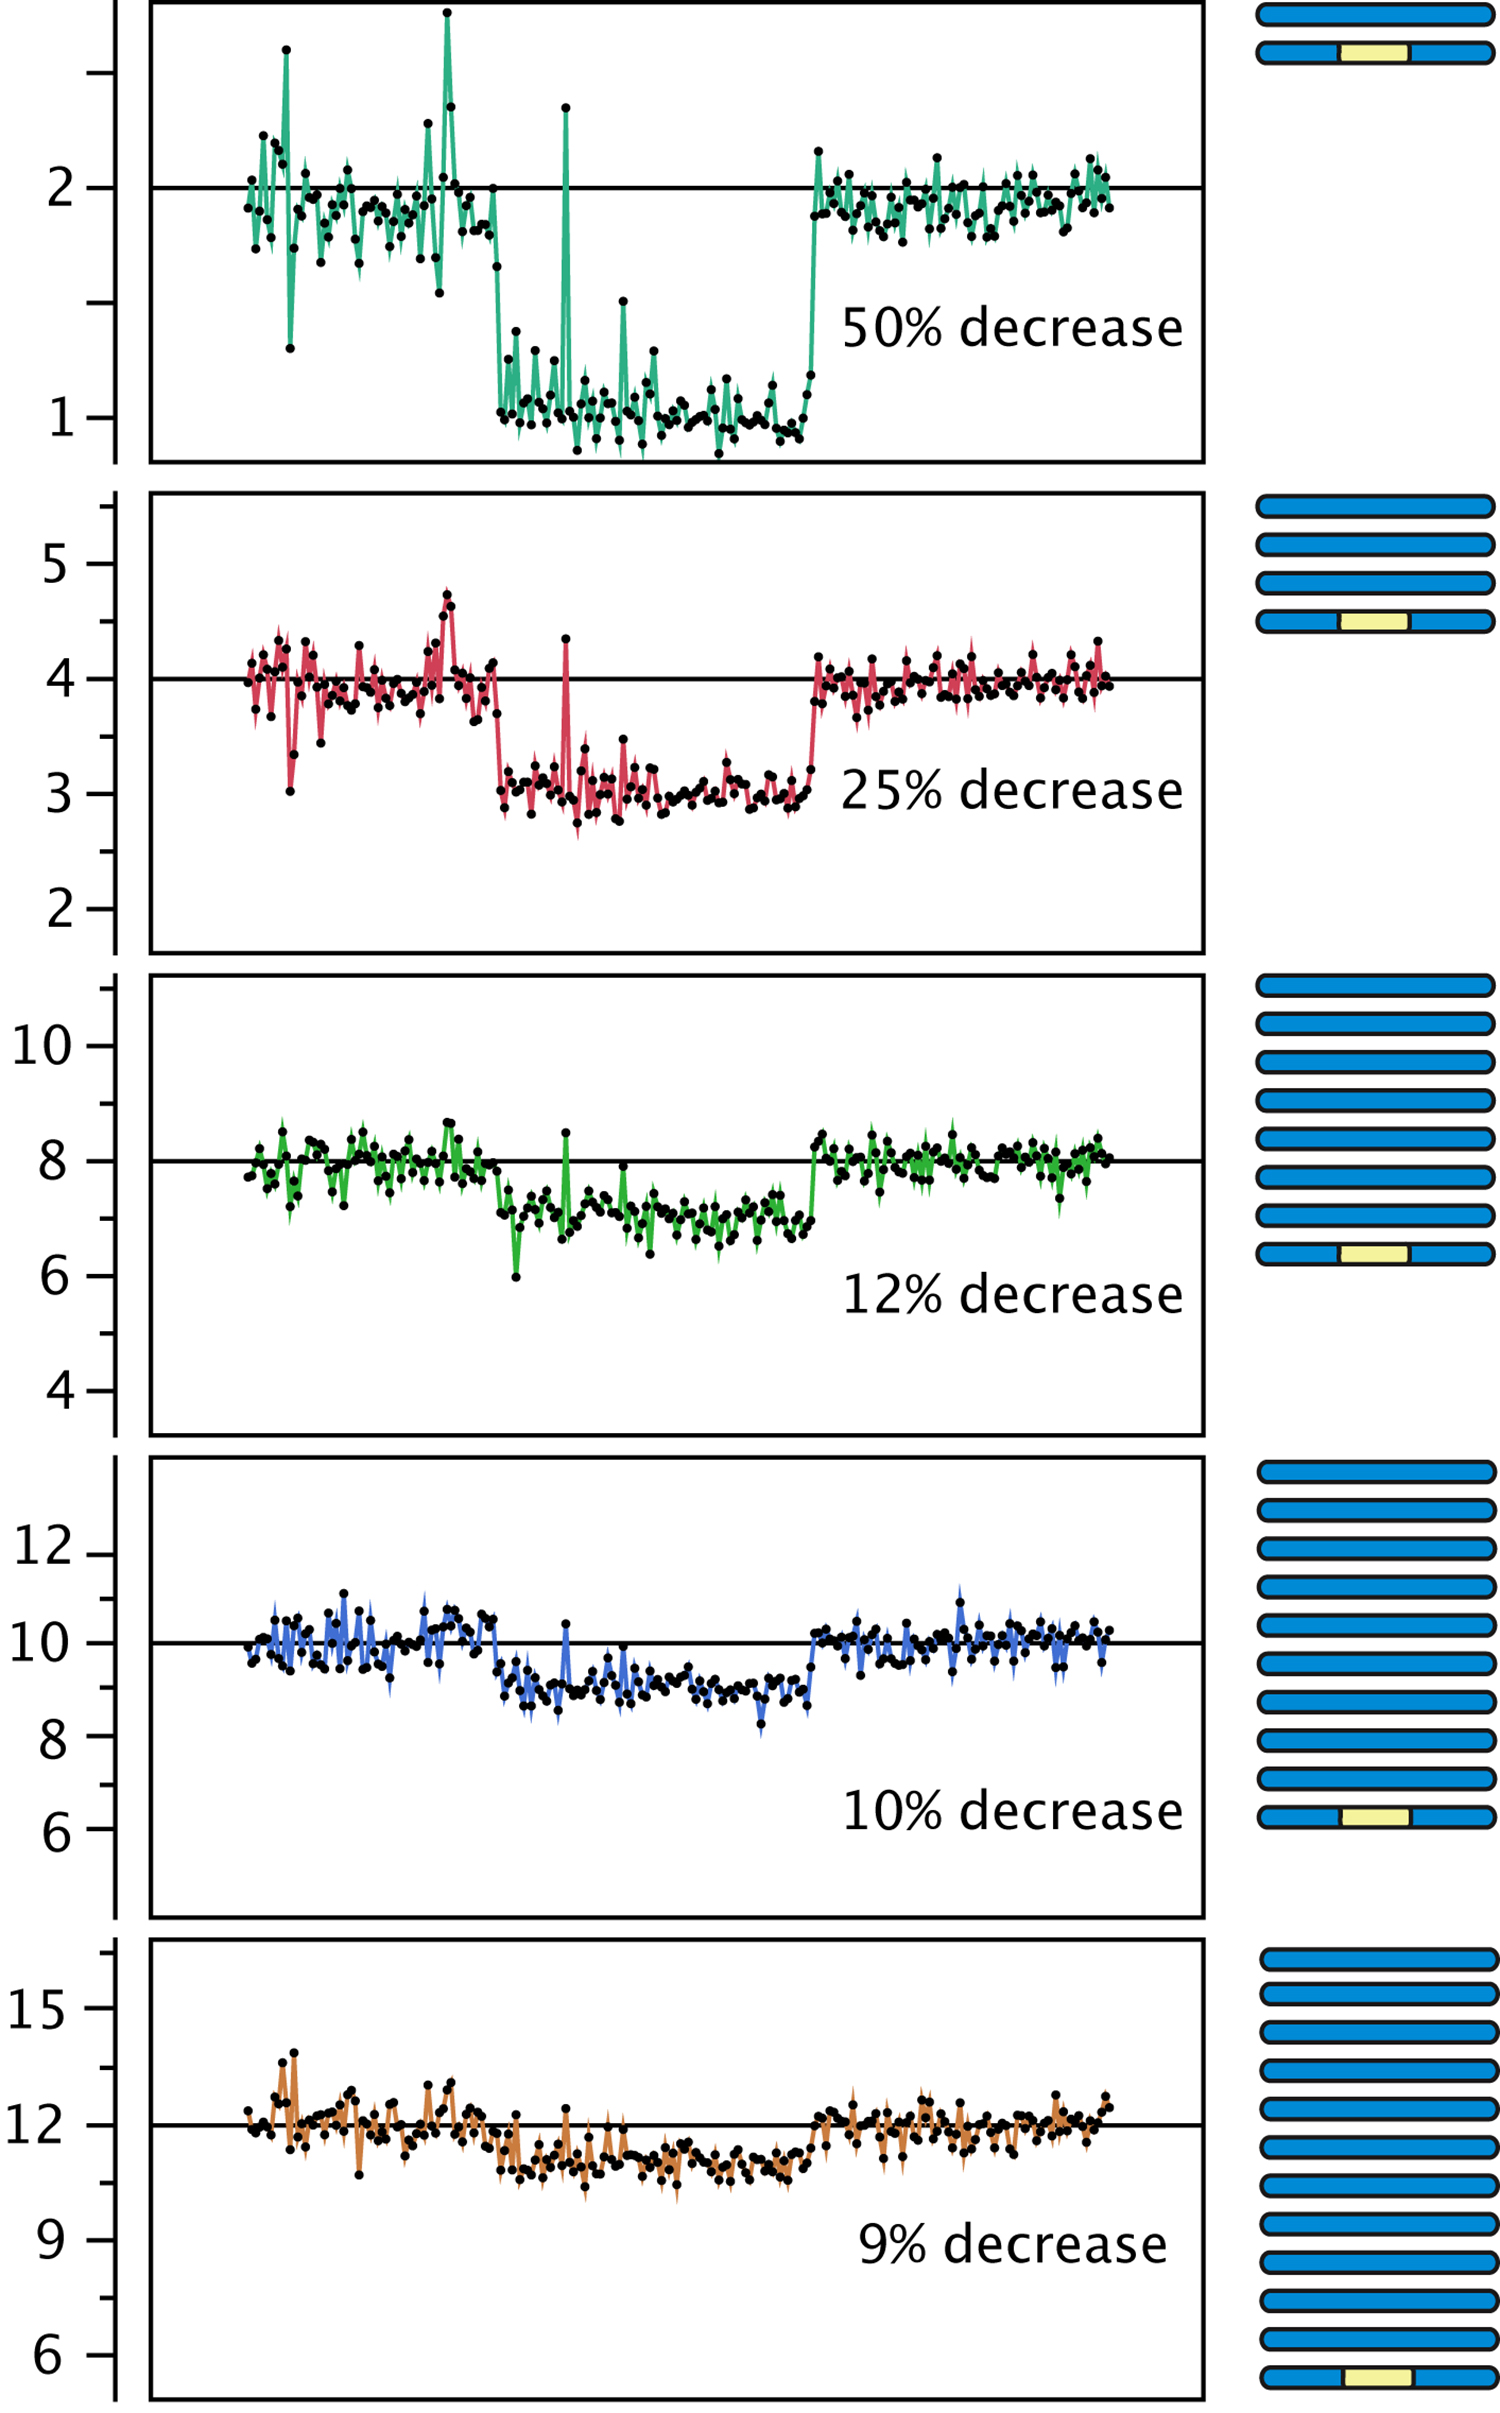
Figure 3. Effect of polyploidy on dosage variation detection. Using data from gamma-irradiated poplar, we created an in silico "dilution series" of the signal originating from a deletion event. Reads from a diploid individual carrying a heterozygous deletion were pooled with increasing numbers of reads from a control diploid individual, to model the decrease in coverage expected from the loss of one copy out of a starting ploidy-level ranging from 2 to 12 (y-axis).
Notes
- Controls for dosage plot analyses. A control euploid sequence of at least equal coverage is highly recommended for each analysis especially if there are only a few samples (less than 10). If a larger population is used or no control is available, the mean of all samples can be used as the control.
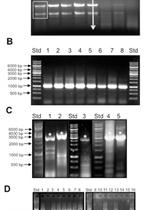
- For example, for work in Tan et al., 2015, genomic DNA was isolated using the Illustra Nucleon Phytopure Kit from 2-3 medium sized Arabidopsis leaves. The resulting DNA was analyzed on a Nanodrop 2000 to determine concentration with 260/230 absorbance ratio of around 2. For reliable results, the DNA must be free of RNA, nucleotides, or other compounds that have a spectral light absorbance similar to that of DNA. If using a different protocol for DNA isolation, running 100 ng of the resulting DNA on an electrophoresis gel should show high molecular weight bands devoid of RNA with no smearing, along with the expected 260/230 absorbance readings from Nanodrop 2000.
- Although a PCR-free method is described here, amplified genomic libraries as well as exon capture libraries have been used successfully for this analysis.
- Because of the technology used by Illumina’s sequencing platform, each sequencing read represents a single data point such that single 50 bp reads, single 100 bp reads or 100 bp paired-end reads each account for one data point in this analysis. The more expensive paired-end reads should therefore only be used if the additional sequence data is needed for mapping or other purposes, such as SNP analysis.
- The depth of sequencing determines the sensitivity of the analysis. For Arabidopsis thaliana, a read count of one hundred thousand is adequate to detect primary aneuploidies at a bin size of 150-200 kb. Finer dosage changes (10-50 kb) will require around 1 million reads (Figure 2).
- During the analysis, it is important to compare samples. In our experience, there are regions of the genome that exhibit variability in the dosage plots even in control samples, such as, for example, pericentromeric regions or other repeated regions (Figure 1). This is particularly relevant when mapping reads from one species or variety to a reference sequence from a closely-related yet different species. Additionally, in some species, regions similar to organellar sequences are sometimes included in the genomic reference sequence. Because variable amounts of organellar DNA are often co-purified with the genomic DNA, such regions exhibit wide variation in coverage. These types of variable regions are normally easy to identify as they vary in opposite directions in different samples and should be discarded from analysis. If the reference sequence fasta file contains one or two organellar genome sequences, these can be removed using the -r option, or can be omitted when plotting relative dosage.
Acknowledgments
This work was funded by HHMI and the Gordon and Betty Moore Foundation (GBMF) through grant GBMF3068 to L.C. and by the DOE Office of Science, Office of Biological and Environmental Research (BER), grants no. DE-SC0007183 (to L.C. and I.M.H.). This protocol was adapted from Tan et al. (2015).
References
- Henry, I. M., Dilkes, B. P., Miller, E. S., Burkart-Waco, D. and Comai, L. (2010). Phenotypic consequences of aneuploidy in Arabidopsis thaliana. Genetics 186(4): 1231-1245.
- Henry, I. M., Nagalakshmi, U., Lieberman, M. C., Ngo, K. J., Krasileva, K. V., Vasquez-Gross, H., Akhunova, A., Akhunov, E., Dubcovsky, J., Tai, T. H. and Comai, L. (2014). Efficient genome-wide detection and cataloging of EMS-induced mutations using exome capture and next-generation sequencing. Plant Cell 26(4): 1382-1397.
- Henry, I. M., Zinkgraf, M. S., Groover, A. T. and Comai, L. (2015). A System for Dosage-Based Functional Genomics in Poplar. Plant Cell 27(9): 2370-2383.
- Li, H. and Durbin, R. (2009). Fast and accurate short read alignment with Burrows-Wheeler transform. Bioinformatics 25(14): 1754-1760.
- Ravi, M., Marimuthu, M. P., Tan, E. H., Maheshwari, S., Henry, I. M., Marin-Rodriguez, B., Urtecho, G., Tan, J., Thornhill, K., Zhu, F., Panoli, A., Sundaresan, V., Britt, A. B., Comai, L. and Chan, S. W. (2014). A haploid genetics toolbox for Arabidopsis thaliana. Nat Commun 5: 5334.
- Tan, E. H., Henry, I. M., Ravi, M., Bradnam, K. R., Mandakova, T., Marimuthu, M. P., Korf, I., Lysak, M. A., Comai, L. and Chan, S. W. (2015). Catastrophic chromosomal restructuring during genome elimination in plants. Elife 4.
Article Information
Copyright
![]() Tan et al. This article is distributed under the terms of the Creative Commons Attribution License (CC BY 4.0).
Tan et al. This article is distributed under the terms of the Creative Commons Attribution License (CC BY 4.0).
How to cite
Readers should cite both the Bio-protocol article and the original research article where this protocol was used:
- Tan, E. H., Comai, L. and Henry, I. M. (2016). Chromosome Dosage Analysis in Plants Using Whole Genome Sequencing. Bio-protocol 6(13): e1854. DOI: 10.21769/BioProtoc.1854.
- Tan, E. H., Henry, I. M., Ravi, M., Bradnam, K. R., Mandakova, T., Marimuthu, M. P., Korf, I., Lysak, M. A., Comai, L. and Chan, S. W. (2015). Catastrophic chromosomal restructuring during genome elimination in plants. Elife 4.06516.
Category
Plant Science > Plant molecular biology > DNA > DNA sequencing
Systems Biology > Genomics > Sequencing
Systems Biology > Genomics > Functional genomics
Do you have any questions about this protocol?
Post your question to gather feedback from the community. We will also invite the authors of this article to respond.