- Protocols

- Articles and Issues
- For Authors
- About
- Become a Reviewer

Campylobacter jejuni γ-glutamyltranspeptidase Activity Assay


Published: Vol 6, Iss 5, Mar 5, 2016 DOI: 10.21769/BioProtoc.1747 Views: 8209
Reviewed by: Valentine V TrotterAnna A. ZorinaAnonymous reviewer(s)
Original research article
The authors used this protocol in:

Jul 2015
Advertisement


Protocol Collections
Comprehensive collections of detailed, peer-reviewed protocols focusing on specific topics


Abstract
The enzyme γ-glutamyltranspeptidase (GGT, EC 2.3.2.2) is highly conserved among eukaryotic and prokaryotic organisms (Heisterkamp et al., 2008) and has a key function in glutathione metabolism. Although the enzyme is highly conserved and found throughout organisms ranging from bacteria to plants and animals several major difference between eukaryotic and prokaryotic GGT can be noticed. They mainly concern the enzyme localization and posttranslational modification. Eukaryotic GGT is cell membrane anchored and highly glycosylated whereas prokaryotic GGT does not undergo this posttranslational modification and is a soluble periplasmic protein. GGT amino acids sequences of diverse origin exhibit high amino acid similarity (Ong et al., 2008). The prokaryotic GGT enzymes are produced as proenzyme, equipped with a typical prokaryotic signal sequence and transported through the inner membrane into the periplasm where the enzyme undergoes autocatalytic cleavage. This proteolysis yields a mature dimer which transfers the γ-glutamyl moieties from extracellular glutathione and related compounds to amino acids or peptides (Hanigan et al., 1998). The GGT enzyme activity can be easily measured as it catalyzes the transfer of a γ-glutamyl group from a colorless substrate, L-γ-glutamyl-3-carboxy-4-nitroanilide, to the acceptor, glycylglycine with leads to the production of yellow colored product, p-nitroaniline (Figure 1) which can be measured by a spectrophotometer (Figure 2). Here we describe a protocol to measure the GGT activity in the Gram-negative bacterium Campylobacter jejuni, with some minor modifications; this protocol also works for other Gram-negative bacterial species.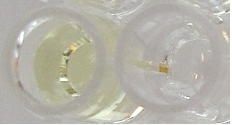
Figure 1. Yellow colored product, p-nitroaniline formed during the GGT enzyme assay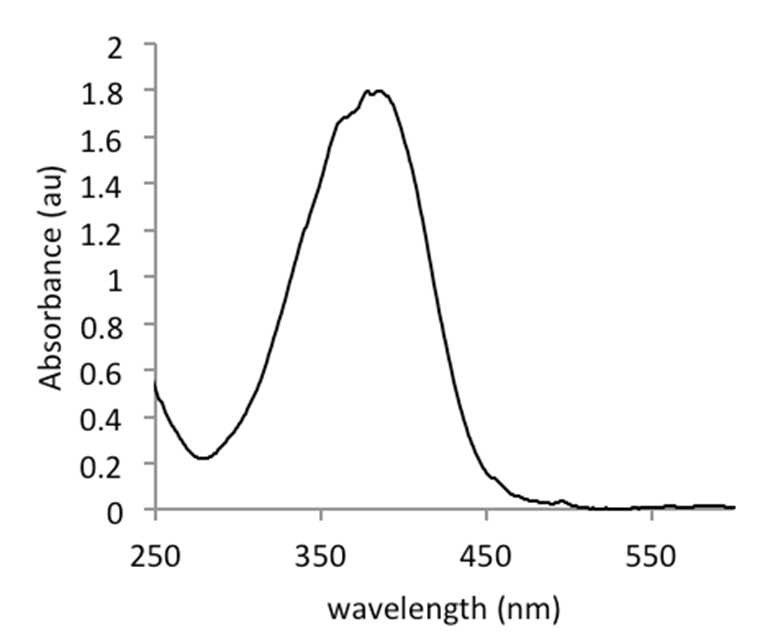
Figure 2. Spectral curve of pNA in Tris/HCl buffer, recorded on a Biodrop µLite (Isogen)
Materials and Reagents
- 25 mm culture flasks with vent cap (Corning, catalog number: 430639 )
- 96 well plate flat bottom (Corning, Costar®, catalog number: 3599 )
- Campylobacter culture
- UltraPure™ Tris Buffer (powder format) (Thermo Fisher Scientific, Invitrogen™, catalog number: 15504-020 )
- Lysozyme from chicken egg white (Sigma-Aldrich, catalog number: L-6876 )
- L-Glutamic acid γ-(3-carboxy-4-nitroanilide) ammonium salt (Sigma-Aldrich, catalog number: 49525 )
- Glycylglycine (Sigma-Aldrich, catalog number: G3915 )
- Pierce™ BCA Protein Assay Kit (Thermo Fisher Scientific, Thermo Scientific™, catalog number: 23227 )
- 4-nitroaniline (Sigma-Aldrich, catalog number: 185310 )
- Hearth Infusion medium (Thomas Scientific, Oxoid, catalog number: CM1032B )
- Tris/HCl (pH 7.6 and pH 8.2)
- Lysis buffer (see Recipes)
- Reaction buffer (see Recipes)
- pNA stock solution (see Recipes)
Equipment
- Absorbance microplate reader (such as BMG Labtech GmbH, Fluorstar Omega or equivalent)
- Vibra-Cell™ Sonicater (Sonics & Materials, model: VC40 )
- Refrigerated table top centrifuge
- The anoxomat system (MART Microbiology)
Procedure
- Dilute a Campylobacter preculture in 5 ml Heart Infusion (HI) broth to an optical density 600 nm of 0.05. Growth the culture in vertically standing 25 mm culture flasks with vent cap in a microaerobic atmosphere (MART) at 42 °C, 160 rpm in HI broth for until stationary phase ~20 h.
Note: If other bacterial species are assayed use species specific growth conditions. - Pellet ~1.109 bacteria of the bacterial culture, remove the supernatant and store the pellet at -80 °C for at least 1 h.
Note: The -80 °C freezing step will help to disrupt the cells, shorter incubation will lead to less disrupted cells. - Resuspend the pellet in ice cold 250 μl lysis buffer, and incubated for 30 min on ice.
- Sonicate 6 times (5 sec each, with 15 sec intervals on ice) at 40 mV and the output control set at 80%.
- Centrifuge the cell lysate for 10 min at 12,000 x g at 4 °C.
- Harvest the supernatant and keep on ice before use.
- Measure the protein concentration of 20 μl supernatant (BCA kit with standard) in a 96 wells plate according to the kit’s protocol.
- Make a serial dilution in a range between 0 and 200 µM of the standard pNA [4-nitroaniline (stock solution 1 mM)] in 50 mM Tris/HCl (pH 7.6).
- Mix 20 μl supernatant or standard pNA in a 96 wells plate with 180 μl of reaction buffer.
- Measure the optical density of the samples and standard in the 96 wells plate at a wavelength of 405 nm (OD405) every 60 s during an incubation period of 30 min at 37 °C (Figures 3 and 4).
- Calculate the slope of all values in a linear range of the obtained graphs (see below).
- GGT activity is expressed as nmol min-1 mg protein-1.
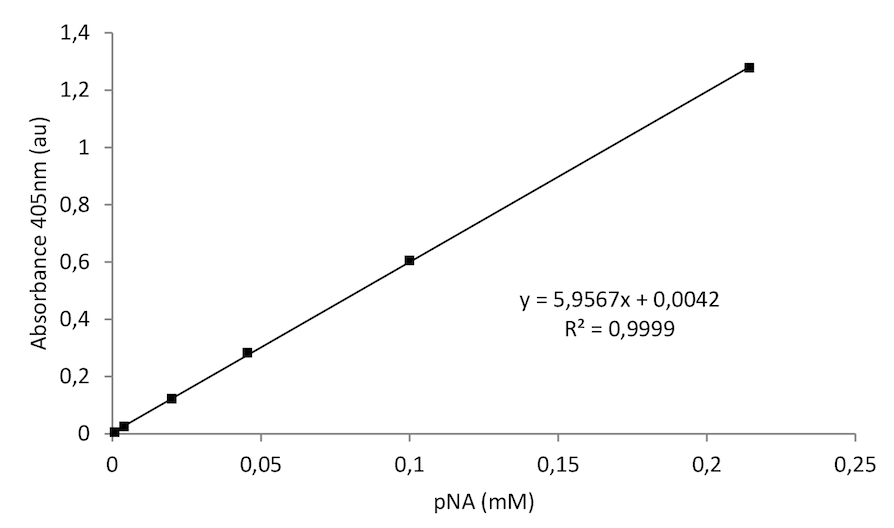
Figure 3. A typical pNA standard curve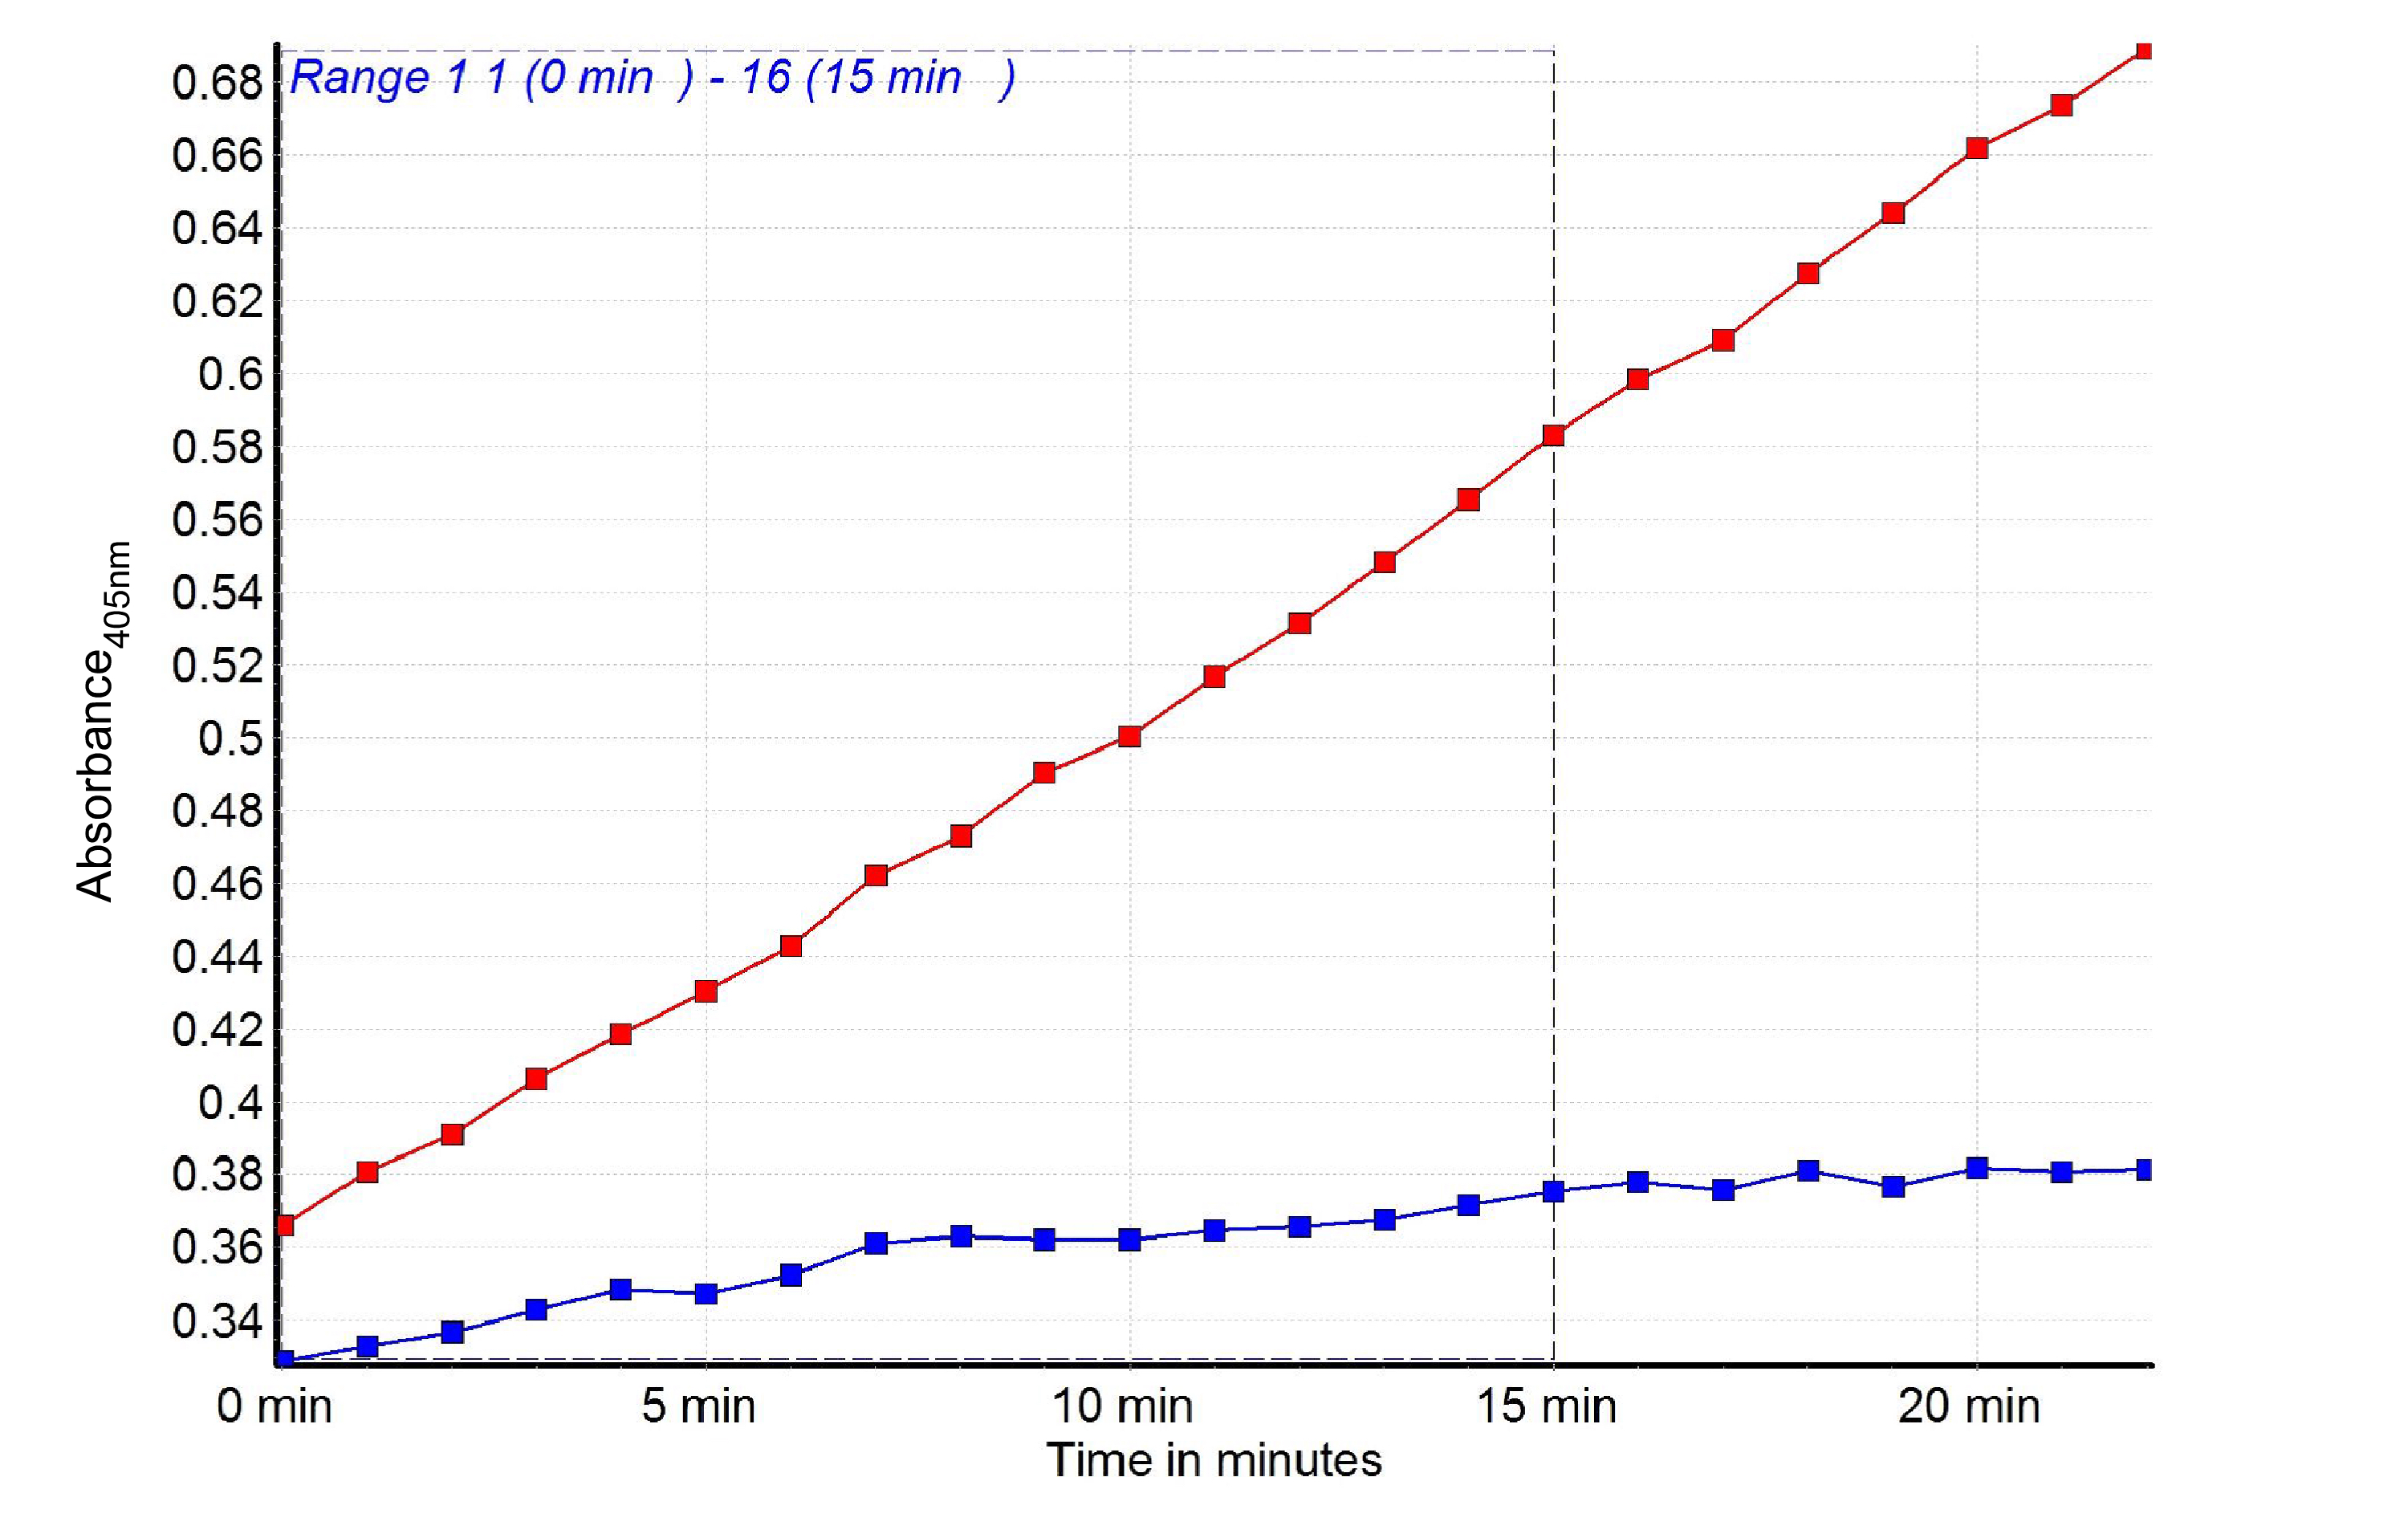
Figure 4. Graph showing in time the pNA increase in the bacterial lysates made of C.jejuni wt (red) and racRS mutant (blue)
To calculate the GGT activity first plot the pNA standard curve. Calculate the Δabsorbance (A time x - A time y) in a linear range. Next, compare the calculated Δabsorbance of each sample to the standard pNA curve to determine the amount of pNA generated between time x and time y (nmol pNA).
The GGT activity is calculated by the formula: (nmol pNA)
T x M
T = the time incubated (in min)
M = mg protein determined by BCA protein kit
GGT activity is reported as nmole/min-1/mg protein-1
Example:
Δabsorbance(wt) = 0.58 (15 min) - 0.43 (5 min)=0.15
Δabsorbance 0.15 = 40 nmole pNA
Time x - time y = 10 min
M = 0.02 mg protein
GGT activity is: 40/(10 x 0.02) = 200 nmole/min-1/mg protein-1
Recipes
- Lysis buffer
50 mM Tris/HCl (pH 7.6)
1 μg/ml lysozyme - Reaction buffer
2.9 mM L-γ-glutamyl-3-carboxy-4-nitroanilide
100 mM glycylglycine
100 mM Tris/HCl (pH 8.2) - pNA stock solution
1 mM 4-nitroaniline
50 mM Tris/HCl (pH 7.6)
Can be stored at -20 °C
Acknowledgments
The γ-glutamyltranspeptidase activity protocol described here and in, van der Stel et al. (2015), is modified from a protocol described in Chevalier et al. (1999). This work was supported by the NWO-ECHO grant 711.012.007 to MW.
References
- Chevalier, C., Thiberge, J. M., Ferrero, R. L. and Labigne, A. (1999). Essential role of Helicobacter pylori γ-glutamyltranspeptidase for the colonization of the gastric mucosa of mice. Mol Microbiol 31(5): 1359-1372.
- Hanigan, M. H. (1998). gamma-Glutamyl transpeptidase, a glutathionase: its expression and function in carcinogenesis. Chem Biol Interact 111-112: 333-342.
- Heisterkamp, N., Groffen, J., Warburton, D. and Sneddon, T. P. (2008). The human gamma-glutamyltransferase gene family. Hum Genet 123(4): 321-332.
- Ong, P. L., Yao, Y. F., Weng, Y. M., Hsu, W. H. and Lin, L. L. (2008). Residues Arg114 and Arg337 are critical for the proper function of Escherichia coli gamma-glutamyltranspeptidase. Biochem Biophys Res Commun 366(2): 294-300.
- van der Stel, A. X., van Mourik, A., Laniewski, P., van Putten, J. P., Jagusztyn-Krynicka, E. K. and Wosten, M. M. (2015). The Campylobacter jejuni RacRS two-component system activates the glutamate synthesis by directly upregulating gamma-glutamyltranspeptidase (GGT). Front Microbiol 6: 567.
Article Information
Copyright
© 2016 The Authors; exclusive licensee Bio-protocol LLC.
How to cite
van der Stel, A. and Wösten, M. M. S. M. (2016). Campylobacter jejuni γ-glutamyltranspeptidase Activity Assay. Bio-protocol 6(5): e1747. DOI: 10.21769/BioProtoc.1747.
Category
Microbiology > Microbial biochemistry > Protein > Activity
Biochemistry > Protein > Activity
Do you have any questions about this protocol?
Post your question to gather feedback from the community. We will also invite the authors of this article to respond.