- Protocols

- Articles and Issues
- For Authors
- About
- Become a Reviewer

Isolation of Persister Cells from Biofilm and Planktonic Populations of Pseudomonas aeruginosa

Published: Vol 5, Iss 18, Sep 20, 2015 DOI: 10.21769/BioProtoc.1590 Views: 13232
Reviewed by: Maria SinetovaAlexander B. WestbyeEsteban Paredes-Osses
Original research article
The authors used this protocol in:

Nov 2014
Advertisement


Protocol Collections
Comprehensive collections of detailed, peer-reviewed protocols focusing on specific topics


Related protocols


Abstract
Persister cells are a stochastically produced sub-population of non-growing bacterial cells. Recently these cells have been more widely studied due to the recognition that they are tolerant to antimicrobials and thus, play a major role in the resilience of bacterial populations to antimicrobials, particularly in chronic biofilm infections. The following protocol describes the isolation/selection of persister cell sub-populations of Pseudomonas aeruginosa present in biofilms (sessile) and planktonic populations (free-living).
Keywords: Persister cellsMaterials and Reagents
- Bacterial culture [Pseudomonas aeruginosa PA14]. This method has also been performed for Escherichia coli (BW25113) and Staphylococcus aureus (ATCC, catalog number: 6538)]
- LB broth Lennox (BD, catalog number: 240230 )
- Ciprofloxacin hydrochloride (Corning Incorporated, catalog number: 61-277-RF )
- Agar (BD, catalog number: 214040 )
- MgCl2.7H2O (VWR International, BDH®, catalog number: 0288-VBD )
- DI water (distilled water)
- Sodium chloride (VWR International, BDH®, catalog number: 0241-VBD )
- Spooled Masterflex peroxide-cured silicone tubing, L/S 14, 250 ft. (Cole-Parmer, catalog number: UX-96407-14 )
- Masterflex Norprene tubing (A60 G), L/S 13, 50 ft. (Cole-Parmer, catalog number: UX-06404-13 )
- PVDF barbed Y connector, 3/8" ID, 1/4", 2-3/8", 1-3/4"; Pack Of 10 (Cole-Parmer, catalog number: WU-30703-93 )
- Barbed fittings, Straight Connector, Clear PP,1/16" ID, 1/32", 25/32", 1/4" (Cole-Parmer, catalog number: WU-30506-00 )
- Barbed fittings, Reducing Connector, Clear PP,1/8" x 1/16" ID, 3/32", 13/16", 1/8" (Cole-Parmer, catalog number: WU-30506-06 )
- Barbed fittings, T connector, Kynar, 1/4" ID, 1/8", 1-15/16", 1-5/16"; 10/pack (Cole-Parmer, catalog number: WU-30703-75 )
- Sterile Petri dishes
- Microfuge tubes
- Syringe 60 ml
- Syringe needle (Gauge 21G)
- Micropipettes (P1000, P200, P20)
- Aluminum Foil
- Saline (see Recipes)
- Saline with Mg2Cl4.7H2O (see Recipes)
- LB agar with Mg2Cl4.7H2O (see Recipes)
Equipment
- Peristaltic pump (Cole-Parmer, catalog number: EW-07553-80 ) with an 8 channel, 6 rollers, 3-stop Ismatec minicartridge pump head (Cole-Parmer, catalog number: EW-78002-50 )
- Inoculation ports (VWR® Sleeve Stoppers) (VWR International, catalog number: 89097-534 )
- GeneMate Incubated Shakers (BioExpress, catalog number: H-2000-M )
- General Purpose Laboratory Incubators, SHEL LAB (BioExpress, catalog number: G-1400-1 )
- Nalgene® Carboys with Handles, Polypropylene, Thermo Scientific (VWR International, catalog number: 16101-084 )
- Nalgene® Top WorksTM Aseptic Closure System, Silicone, for Bottles and Carboys, Thermo Scientific (VWR International, catalog number: 2135-8303 )
- Acro® 50 Vent Filters, Pall Laboratory (VWR International, catalog number: 28143-616 )
- Erlenmeyer Flasks (150 ml)
- Homogenizer (PRO SCIENTIFIC, model: Bio-Gen Pro200 )
- Table top refrigerated Centrifuge (Eppendorf, catalog number: 5418R )
- Spectrophotometer (BD, catalog number: DU700 series )
Procedure
The procedure for persister cell isolation relies on activation of the SOS response together with stringent response, through the use of ciprofloxacin as an antibiotic of choice (Keren et al., 2004; Sufya et al., 2003; Dörr et al., 2009) and saline as carrier solution (Sufya et al., 2003). The presence of ciprofloxacin activates the SOS DNA damage response via a mechanism that involves both recA and lexA and all non-persister cells are killed, while at the same time, persister cell formation occurs when a specific high or low level of SOS function is expressed (Dörr et al., 2009). The use of saline as a carrier for ciprofloxacin leads to an absence of nutrients and activates the stringent response where activation of relA and spoT results in increased levels of ppGpp that inhibit rRNA synthesis and lead to a decrease of the cell’s metabolism and a higher number of persister cells (Bernier et al., 2013, Potrykus and Cashel, 2008). Following isolation of persister cells from planktonic or biofilm cell populations, the persister cell state must be confirmed by performing the part C.
- Persister cell isolation from planktonic stationary phase cells.
- Prepare a streak plate on LB agar of a frozen stock of the bacteria of interest, and incubate under static conditions at 37 °C, for 24 h.
- Remove 1-2 colonies from the streak plate and inoculate a broth culture of 5 ml LB broth.
- Incubate at 37 °C with agitation (220 rpm) for a period of 12 h (overnight culture).
- Dilute the overnight culture to 1% in 50 ml of fresh LB medium in an Erlenmeyer flask. Note 2 describes problems that might arise with inoculum variability.
- Incubate at 37 °C with agitation (220 rpm) for a period of 24 h.
- Collect cells by centrifugation at 16,000 x g for 5 min, at 4 °C.
- Resuspend in 50 ml of cold (refrigerated and kept on ice) saline (0.85% NaCl).
- Repeat steps A6-7.
- Measure cell turbidity at a wavelength of 600 nm (OD600).
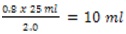
- Calculate how much culture (now in saline) will be needed to have a final OD600 of 0.8 in 25 ml.
- Example: Initial OD600 is 2.0
- Final OD600 needed is 0.8
- Final volume needed is 25 ml
- So, culture volume needed is
- Example: Initial OD600 is 2.0
- In duplicate, remove 10 ml (as per example) of culture into a fresh centrifuge tube.
- Collect cells by centrifugation at 16,000 x g for 5 min, at 4 °C.
- Resuspend in 25 ml of cold (refrigerated) saline.
- Add ciprofloxacin at 20x the minimum inhibitory concentration (MIC) (treated sample) or saline containing acetic acid at the appropriate concentration, to account for the acetic acid present in the ciprofloxacin stock solution (control). For P. aeruginosa PA14, we used ciprofloxacin at a concentration of 20 μg/ml (original stock solution of ciprofloxacin was 4 mg/ml in saline with 0.1% acetic acid).
Note: MIC was calculated using the methodology described by Andrews (2001). Different bacterial strains and the same strain in another laboratory can have different MICs thus, the MIC needs to be calculated for each individual bacterial strain. - Incubate at 37 °C with agitation (220 rpm) for a period of 24 h.
- Perform sampling (500 μl) at time points 0, 1, 3, 5, 7, 9, 12, 15 and 24 h.
- For each time point, perform a set of 10 - Fold serial dilution series from 0 to 10-6.
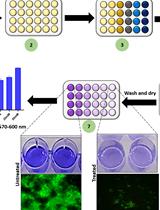
- Drop plate 10 μl of each sample dilution onto a LB agar plate (100 x 15 mm) containing 1% MgCl2.7H2O (to neutralize ciprofloxacin) and allow the drop to slide on the agar surface, to form a line, so that the drop spreads and colonies have a higher surface area to grow. Each plate can have a maximum of 5 drops. Perform triplicate sample plates to ensure accuracy.
- Incubate plates at 37 °C for a period of 24-48 h.
- Count colonies between 10-100.
- Calculate the CFU/ml:
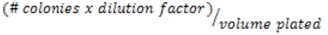
- Example # colonies (50) in the 10-2 dilution, the CFU/ml would be: 50 x 102/0.01 = 5 x 10⁵ CFU/ml.
- Plot results as % viable cells vs time. Viable cells % is calculated based on the CFU/ml obtained for time 0, which is considered as 100% viable cells.
- Perform experiments in quadruplicate, this will allow for calculation of whether the results obtained are statistical significant when comparing controls to treated samples using ANOVA, followed by the Tukey’s comparison test.
- Prepare a streak plate on LB agar of a frozen stock of the bacteria of interest, and incubate under static conditions at 37 °C, for 24 h.
- Persister cell isolation from biofilms
Biofilms were cultured on tube reactors as described in the references below (Sauer et al., 2002; Davies and Marques, 2009; Marques et al., 2014), and briefly in Note 1.- Repeat steps A1-5 in the above procedure for persister cell isolation from planktonic cultures.
- Measure the OD600 of the overnight culture, and standardize the culture to have an OD600 of 0.8 in 50 ml of LB media.
- Aspirate the culture with a 60 ml syringe with a needle and then cap the needle. Perform all this under aseptic conditions.
- Inoculate each tube reactor (Figure 2) with 2 ml of culture.
- Following 1 h incubation at room temperature - to allow the bacteria to attach to the silicone tubing (this time can vary, depending on the bacterial strain) - initiate the flow.
- Allow biofilms to develop for a period of 6 days.
- Expose biofilms to saline or 150 μg/ml of ciprofloxacin (150x MIC) in saline, for a period of 24 h. Monitor viability at 0, 1, 3, 5, 7, 9, 12 and 24 h.
- At each time point, for each sample (one control and one treated), one biofilm tube needs to be sacrificed and its contents need to be harvested using the rolling pin method (Sauer et al., 2002; Davies and Marques, 2009; Marques et al., 2014). The silicone tube containing the biofilms (Figure 2) is disconnected from the inoculation port and from the waste and placed onto a lab bench, after which, the pin is rolled on top of the tube to extrude out the liquid and the biofilm paste into centrifuge tubes containing 1 ml of saline with 1% MgCl2.7H2O (to neutralize ciprofloxacin).
- Homogenize samples using a homogenizer at speed 4 (approximately 20,000 rpm) for a period of 20 sec. Disinfect homogenizer between samples with 70% ethanol for a period of 1 min, followed by sterile water. Keep samples on ice during this step.
- Perform a set of 10 - Fold serial dilution series from 0 to 10-8.
- Drop plate 10 μl of sample onto a LB agar plate containing 1% MgCl2.7H2O. Each plate can have a maximum of 5 drops. Perform at least duplicate plates to ensure accuracy.
- Incubate plates at 37 °C for a period of 24-48 h.
- Count colonies between 10-100.
- Calculate the CFU/cm2:

- Example # colonies (50) in the 10-2 dilution, the CFU/ml would be: 50 x 102/0.01 = 5 x 10⁵ CFU/ml.
- If sample was collected into 1 ml, then the total CFUs would be 5 x 10⁵ CFU.
- If the internal volume of the tube is 2 cm2, then CFU/cm2 would be: 5 x 10⁵/2 = 2.5 x 10⁵ CFU/cm2.
- Example # colonies (50) in the 10-2 dilution, the CFU/ml would be: 50 x 102/0.01 = 5 x 10⁵ CFU/ml.
- Plot results as % of viable cells vs time. Viable cells % is calculated based on the CFU/ml obtained for time 0, which is considered as 100% viable cells.
- Perform experiments in quadruplicate, this will allow for calculation of whether the results obtained are statistical significant, when comparing controls to treated samples using ANOVA followed by the Tukey’s comparison test.
- Repeat steps A1-5 in the above procedure for persister cell isolation from planktonic cultures.
- Confirmation of the persister cell state.
- Isolate persister cells as described above in A and B.
- At 18 h of ciprofloxacin exposure:
- In planktonic persister cell isolation experiments (Part A above), collect all cells present in the Erlenmeyer flask, for each treatment (ciprofloxacin or saline) by centrifugation at 16,000 x g for 5 min, at 4 °C and resuspend each original sample, in 12.5 ml of saline and 12.5 ml of ciprofloxacin (20 mg/L) in saline. Refer to Note 3 in regards to separation of dead cells from sample.
- In biofilm persister cell isolation experiments (Part B above) switch the ciprofloxacin exposure to either saline or further ciprofloxacin.
- In planktonic persister cell isolation experiments (Part A above), collect all cells present in the Erlenmeyer flask, for each treatment (ciprofloxacin or saline) by centrifugation at 16,000 x g for 5 min, at 4 °C and resuspend each original sample, in 12.5 ml of saline and 12.5 ml of ciprofloxacin (20 mg/L) in saline. Refer to Note 3 in regards to separation of dead cells from sample.
- Monitor viability at 0, 1, 3, 5, 7, 9, 12 and 24 h and process the data as described above.
- Isolate persister cells as described above in A and B.
Representative data
Using this methodology, persister cells are isolated using the SOS response, as a standard procedure (Keren et al., 2004; Dörr et al., 2009; Moker et al., 2010; Keren et al., 2004; Pan et al., 2012; Niepa et al., 2012; Hong et al., 2012). When performing persister cell isolation, either in planktonic or biofilm cultures, a typical biphasic killing curve should be observed, in the presence of ciprofloxacin (Figure 1A). Where in the first 3-6 h an exponential decrease of cell number is observed, followed by a killing plateau where no further decrease of cell viability is observed. Cells present in this plateau are considered to be the persister cell sub-population within a bacterial culture and can be from 0.0001 to 0.1% of the total population.
Once persister cells are isolated, confirmation of a persister cell state is determined by exposing the isolated cells to ciprofloxacin (20 mg/L) or saline for further 24 h. If cells are truly in a persister state, then no reduction of cell viability is observed (Figure 1B).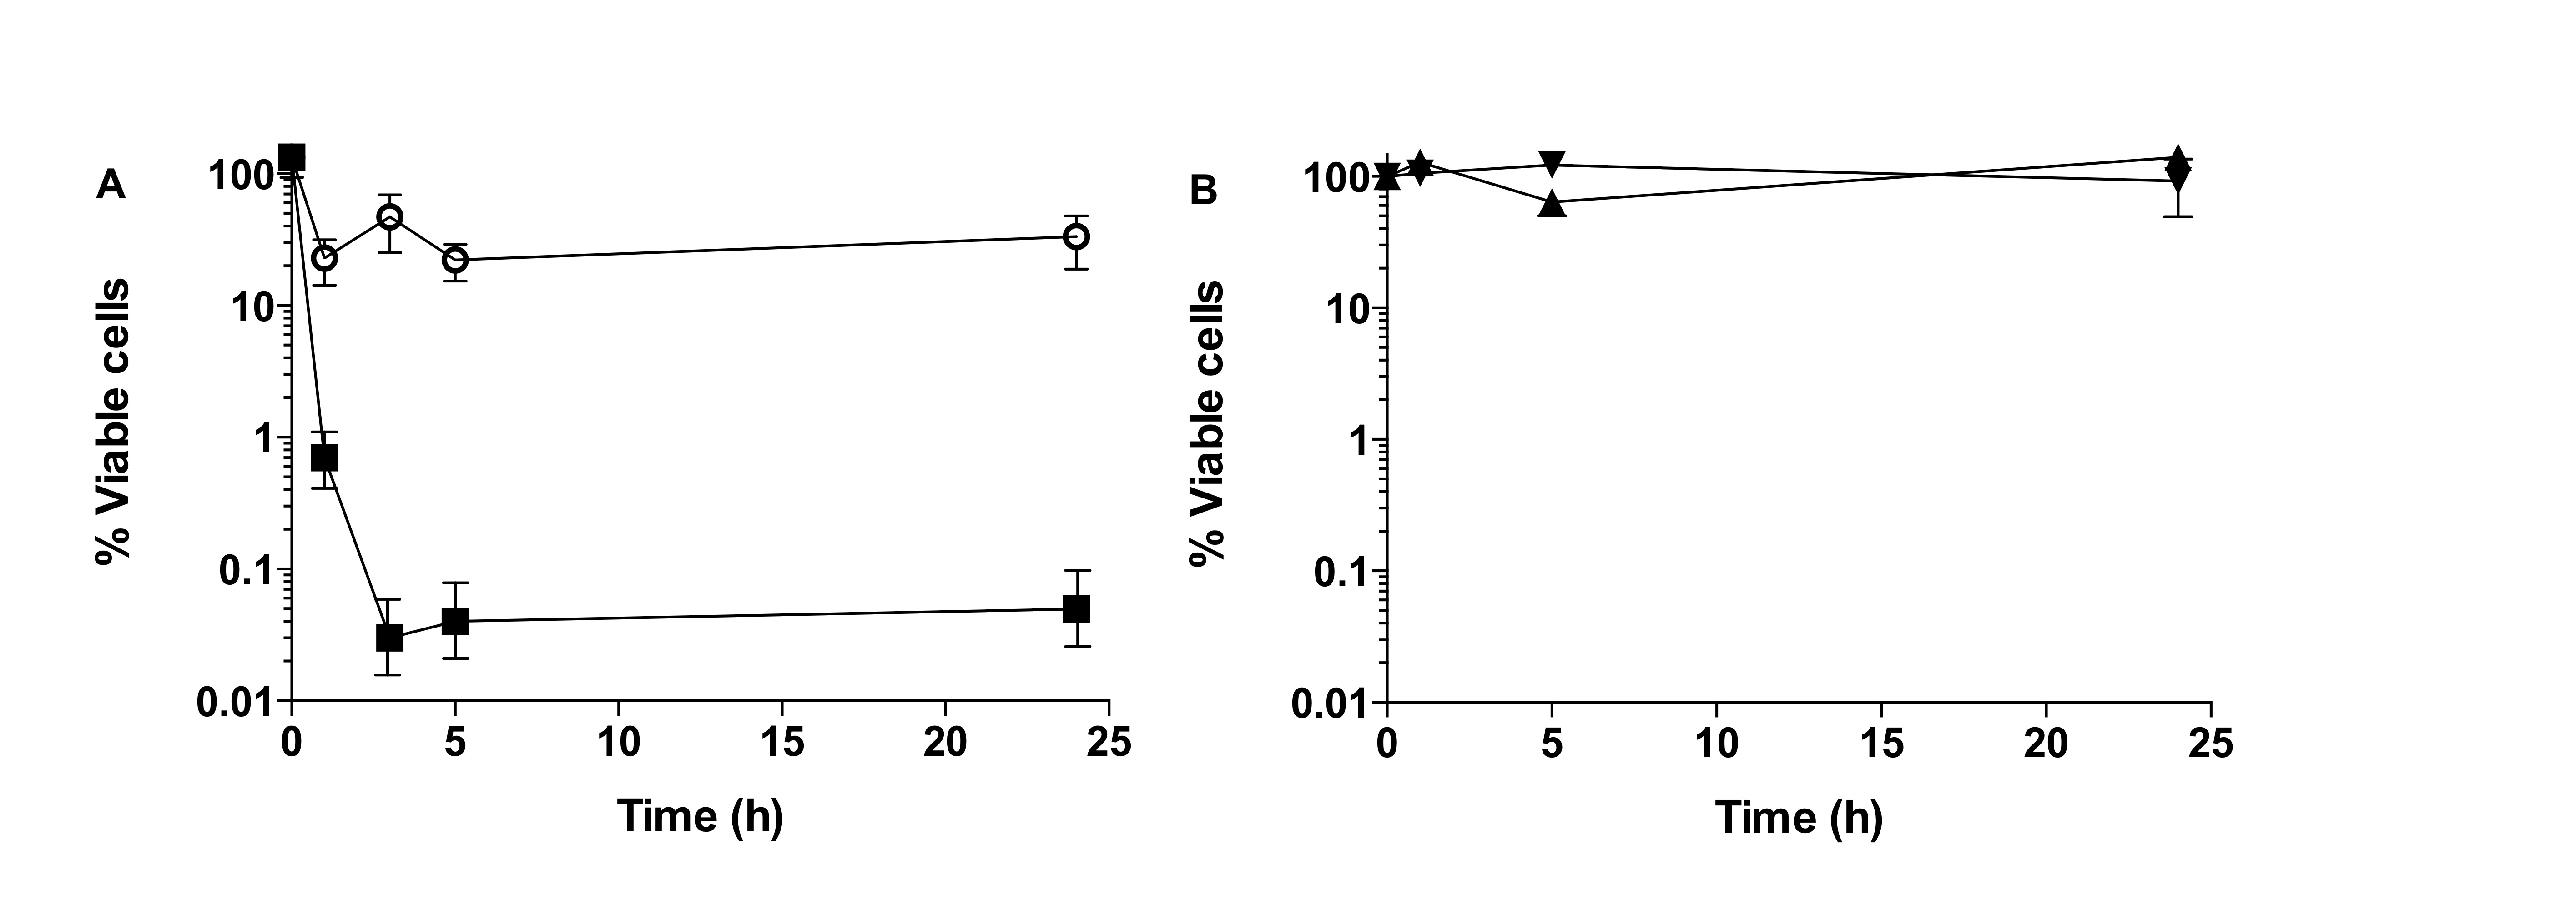
Figure 1. Isolation of persister cells from biofilm populations of P. aeruginosa. A. Biphasic curve observed upon exposure of P. aeruginosa biofilms to ciprofloxacin (squares) together with control, biofilms exposed to saline (open circles). B. Confirmation of persister cell state, exposure of persister cells to ciprofloxacin (black triangle) does not result in decrease of cell viability compared to control (inverted triangle). (Copyright© 2014, American Society for Microbiology ( Marques et al., 2014).
Notes
- In this work, biofilms were cultured in a tube reactor system (Figure 2) consisting of L/S 14 Masterflex peroxide-cured silicone tubing with 5% LB pumped through at a rate of 10.8 ml/h (Sauer et al., 2002; Davies and Marques, 2009; Marques et al., 2014). Each tube reactor was inoculated with 2 ml of a standardized overnight culture (OD600 of 0.8) and incubated, under static conditions, for a period of 1 h to facilitate cell attachment.
- When performing persister cell isolation in planktonic populations, the inoculum needs to be processed identically between experiments or the number of persister cells will change, creating variability. Thus, with a low bacterial cell inoculum, an absence of colonies might be present in the persister cell population, this will not be due to the absence of persister cells but to the low cell numbers and the detection levels of viable cell assessment using CFU determinations.
- When confirming persister cell state in planktonic populations, the cell pellet will present a gradient due to the present of dead cells. The dead cells will readily resuspend onto the liquid, and will be removed when removing the supernatant, while the live cells will remain in the pellet.
A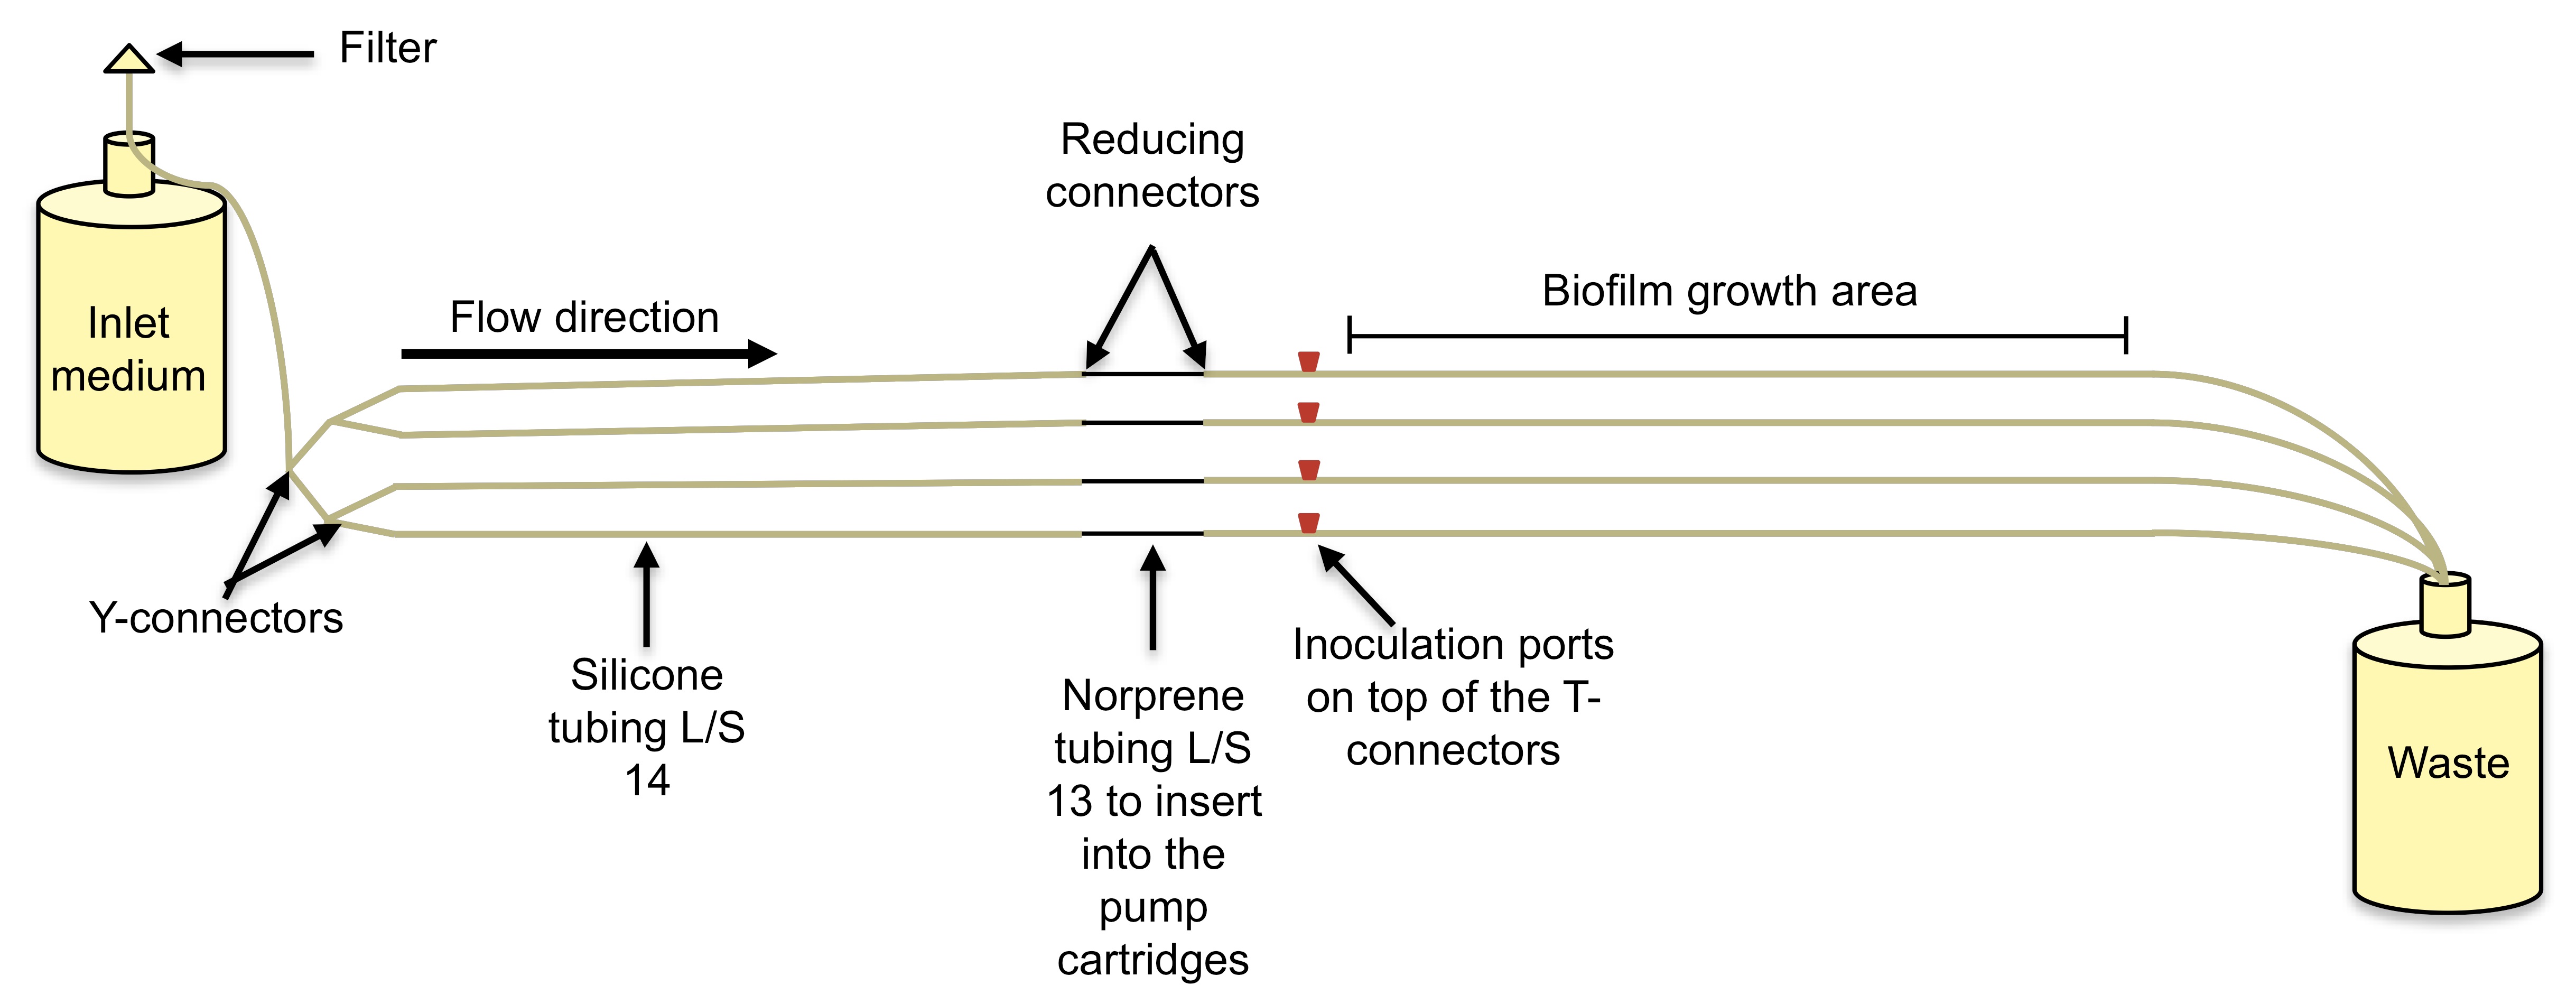
B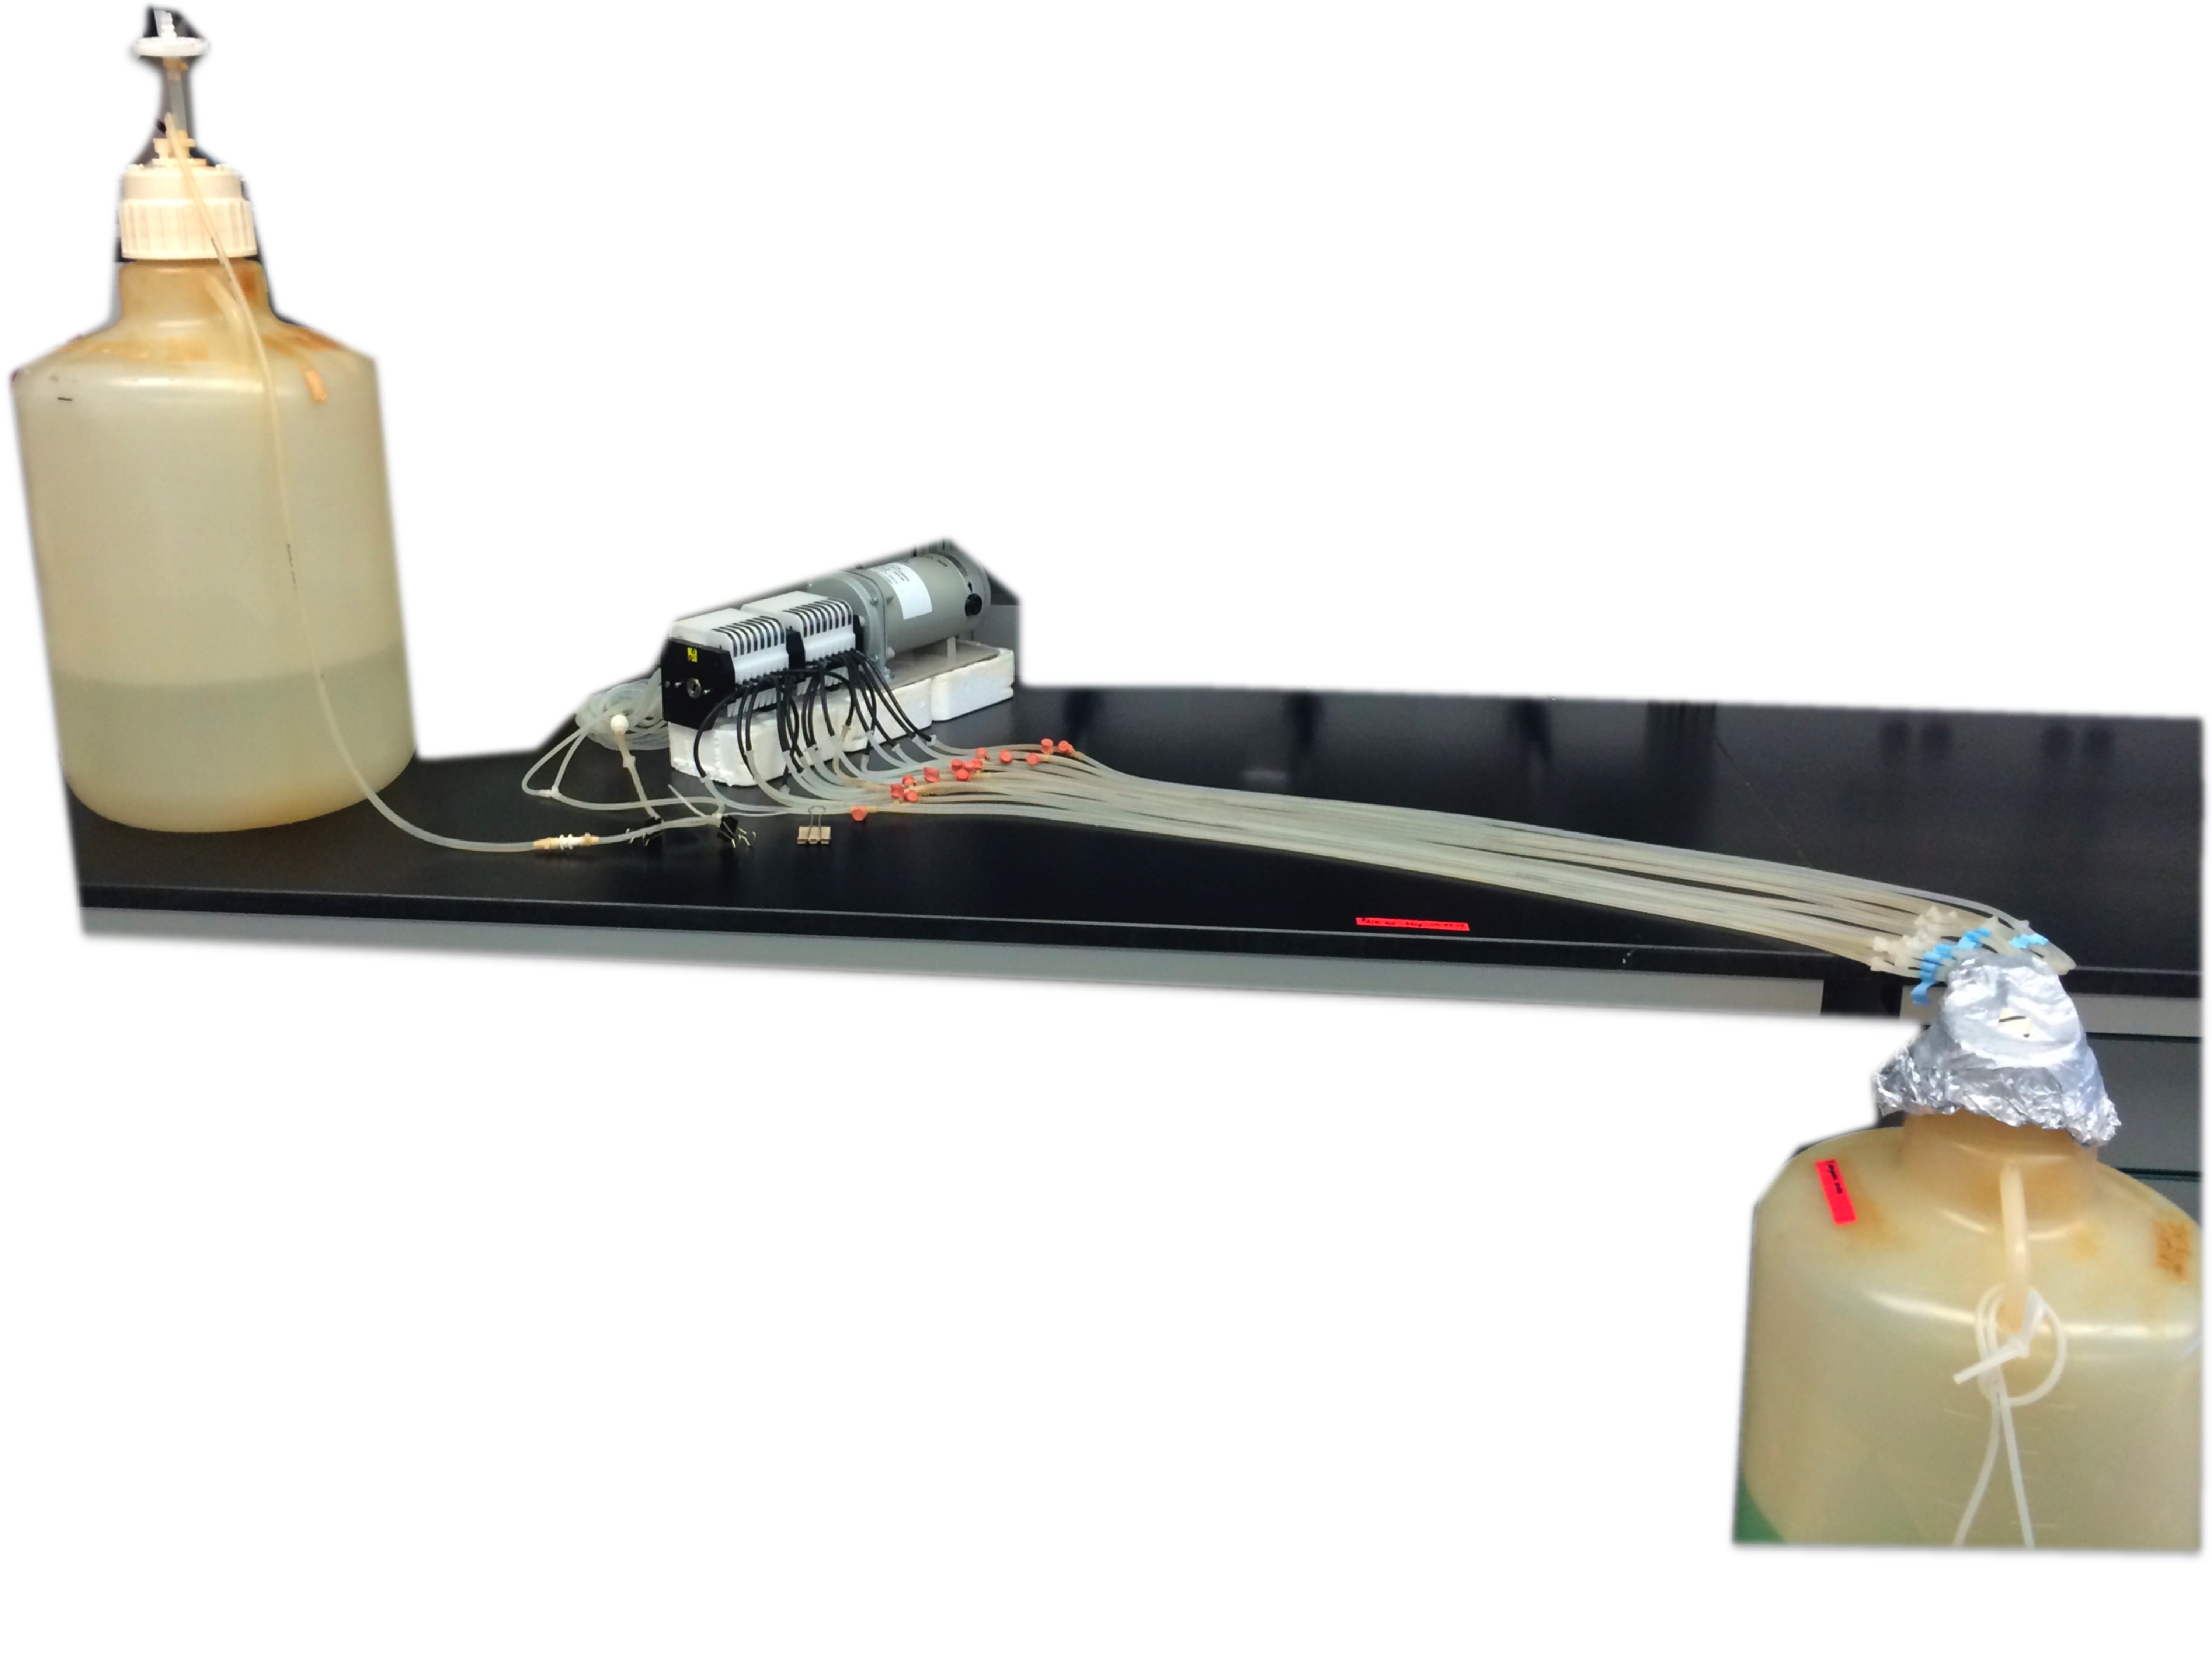
Figure 2. Biofilm tube reactor system. This is a once through continuous culture system where biofilms develop inside silicone tubes. The bacterial culture is inoculated on the inoculation port and biofilms develop downstream from the pump. A. Schematic of a tube reactor system containing 4 silicone tubes. B. An assembled tube reactor system containing 16 silicone tubes where the cultures will run in tandem.
Recipes
- Saline
8.5 g sodium chloride
1 L of DI water - Saline with MgCl2.7H2O
8.5 g sodium chloride
10 g MgCl2.7H2O
1 L of DI water - LB agar with MgCl2.7H2O
20 g LB broth Lennox
15 g agar
10 g MgCl2.7H2O
1 L of DI water
Acknowledgments
Persister isolation is a modification of previously published protocols (Keren et al., 2004; Sufya et al., 2003). This work was supported by SUNY structural funds.
References
- Andrews, J. M. (2001). Determination of minimum inhibitory concentrations. J Antimicrob Chemother 48 Suppl 1: 5-16.
- Bernier, S. P., Lebeaux, D., DeFrancesco, A. S., Valomon, A., Soubigou, G., Coppee, J. Y., Ghigo, J. M. and Beloin, C. (2013). Starvation, together with the SOS response, mediates high biofilm-specific tolerance to the fluoroquinolone ofloxacin. PLoS Genet 9(1): e1003144.
- Davies, D. G. and Marques, C. N. (2009). A fatty acid messenger is responsible for inducing dispersion in microbial biofilms. J Bacteriol 191(5): 1393-1403.
- Dörr, T., Lewis, K. and Vulic, M. (2009). SOS response induces persistence to fluoroquinolones in Escherichia coli. PLoS Genet 5(12): e1000760.
- Hong, S. H., Wang, X., O'Connor, H. F., Benedik, M. J. and Wood, T. K. (2012). Bacterial persistence increases as environmental fitness decreases. Microb Biotechnol 5(4): 509-522.
- Keren, I., Kaldalu, N., Spoering, A., Wang, Y. and Lewis, K. (2004). Persister cells and tolerance to antimicrobials. FEMS Microbiol Lett 230(1): 13-18.
- Keren, I., Shah, D., Spoering, A., Kaldalu, N. and Lewis, K. (2004). Specialized persister cells and the mechanism of multidrug tolerance in Escherichia coli. J Bacteriol 186(24): 8172-8180.
- Marques, C. N., Morozov, A., Planzos, P. and Zelaya, H. M. (2014). The fatty acid signaling molecule cis-2-decenoic acid increases metabolic activity and reverts persister cells to an antimicrobial-susceptible state. Appl Environ Microbiol 80(22): 6976-6991.
- Niepa, T. H., Gilbert, J. L. and Ren, D. (2012). Controlling Pseudomonas aeruginosa persister cells by weak electrochemical currents and synergistic effects with tobramycin. Biomaterials 33(30): 7356-7365.
- Pan, J., Bahar, A. A., Syed, H. and Ren, D. (2012). Reverting antibiotic tolerance of Pseudomonas aeruginosa PAO1 persister cells by (Z)-4-bromo-5-(bromomethylene)-3-methylfuran-2(5H)-one. PLoS One 7(9): e45778.
- Potrykus, K. and Cashel, M. (2008). (p)ppGpp: still magical? Annu Rev Microbiol 62: 35-51.
- Sauer, K., Camper, A. K., Ehrlich, G. D., Costerton, J. W. and Davies, D. G. (2002). Pseudomonas aeruginosa displays multiple phenotypes during development as a biofilm. J Bacteriol 184(4): 1140-1154.
- Sauer, K., Cullen, M. C., Rickard, A. H., Zeef, L. A., Davies, D. G. and Gilbert, P. (2004). Characterization of nutrient-induced dispersion in Pseudomonas aeruginosa PAO1 biofilm. J Bacteriol 186(21): 7312-7326.
- Sufya, N., Allison, D. G. and Gilbert, P. (2003). Clonal variation in maximum specific growth rate and susceptibility towards antimicrobials. J Appl Microbiol 95(6): 1261-1267.
Article Information
Copyright
© 2015 The Authors; exclusive licensee Bio-protocol LLC.
How to cite
Marques, C. N. H. (2015). Isolation of Persister Cells from Biofilm and Planktonic Populations of Pseudomonas aeruginosa. Bio-protocol 5(18): e1590. DOI: 10.21769/BioProtoc.1590.
Category
Microbiology > Microbial biofilm > Biofilm culture
Microbiology > Microbial biofilm > Killing assay
Microbiology > Microbial cell biology > Cell isolation and culture
Do you have any questions about this protocol?
Post your question to gather feedback from the community. We will also invite the authors of this article to respond.