- Protocols

- Articles and Issues
- For Authors
- About
- Become a Reviewer

Quantification of Sodium Accumulation in Arabidopsis thaliana Using Inductively Coupled Plasma Optical Emission Spectrometery (ICP-OES)


Published: Vol 5, Iss 16, Aug 20, 2015 DOI: 10.21769/BioProtoc.1570 Views: 9369
Reviewed by: Tie LiuDušan VeličkovićAnonymous reviewer(s)
Original research article
The authors used this protocol in:

Apr 2014
Advertisement


Protocol Collections
Comprehensive collections of detailed, peer-reviewed protocols focusing on specific topics


Related protocols

Abstract
Salt stress is a major issue for plants growing in both natural and agricultural settings (Deinlein et al., 2014). For example, irrigation can lead to the build up of salts in the soil as the irrigation water evaporates, leading to salinization, inhibition of plant growth, reduced productivity and eventually to loss of agriculturally usable land. One key element in trying to understand how salt stress impacts plant growth and development, in defining plant salt sensing and response mechanisms and eventually in the breeding or engineering of plants resistant to this stress is monitoring their salt uptake and redistribution. Methods such as imaging Na-sensitive fluorescent probes (Kader and Lindberg, 2005) and use of Na-ion selective microelectrodes (Shabala et al., 2005) offer the potential to follow Na levels in the plant in a non-destructive manner but are technically demanding and not applicable to field, or even many laboratory, conditions. However, tissue sampling followed by inductively coupled plasma spectroscopy (ICP) represents a simple, quantitative assay to monitor total Na levels in plant samples. ICP analysis is also applicable to plants in any environment where samples can be harvested. The approach uses tissue digestion in acid solutions, followed by injection of the resulting sample into an inductively coupled plasma spectrometer and monitoring the characteristic emitted spectrum from Na. As Na is stable, no complex sample preservation is required. Care needs to be taken with possible Na contamination in standards and samples from the water used for sample preparation and from glassware but otherwise, the approach is simple and robust.
Materials and Reagents
- Plant tissues
- 60% (vol/vol) Perchloric acid (HClO4) (Sigma-Aldrich, catalog number: 244252 )
- Nitric acid (HNO3) (Sigma-Aldrich, catalog number: 225711 )
- 18 megaohms (MΩ)-cm deionized water (DI water)
- NaCl standards, see Recipes for two methods of preparing Na standards
- ICP-OES calibration standard (Agilent, catalog number: 6610030700 )
- Kimwipe strip, W x H: 30 x 5 mm (manually prepared by cutting a single layer of Kimwipe) (Kimtech Science Kimwipers, catalog number: 34120 )
- NaCl standards (see Recipes)
- Alternative method of preparing Na standards from 1 M NaCl standard (see Recipes)
- Composition of plant growth medium (see Recipes)
Equipment
- Perkin-Elmer Optima 2000DV inductively coupled plasma optical emission spectrometer (ICP-OES) or similar machine
- Fume hood
- Heat block for heating glass test tubes
- Disposable borosilicate glass tubes with plain ends (O.D. x L: 16 x 125 mm) (Thermo Fisher Scientific, catalog number: 14-961-30 )
- Sterile square Petri dish with grid (L x W x H: 100 mm x 100 x 15 mm, grid of thirty-six 13 x 13 mm squares) (Thermo Fisher Scientific, catalog number: 08-757-11A )
Procedure
This experiment is designed to follow uptake of Na by the root tip and then its transport to the aerial parts of the seedling (Choi et al., 2014).
- Grow Arabidopsis wild type Columbia_0 (WT Col_0) on the surface of plant growth medium [including 0.5% (w/v) Phytagel] in 100 x 100 mm square Petri dishes for 10 days under long day conditions (16 h light/8 h dark).
- Cover the root tip (~5 mm of the root apex) for 1 h with a single layer Kimwipe strip (W x H: 30 x 5 mm) wetted with 50 µl of DI water (Figure 1A).
- After this acclimation period, soak the Kimwipe strip for a further 10 min with either 50 µl of DI water (control) or 50 µl of 100 mM NaCl (10 min salt stress).
- During these control and salt treatments, the Petri dishes should be raised ~15 mm at one end by placing them on a second empty Petri dish. This second Petri dish should be placed under the end of the Petri dish furthest from the seedling roots and closest to the cotyledon/shoot end of the plants (Figure 1B). This protocol ensures that the water or NaCl applied to the Kimwipe strip cannot passively flow along the surface of the plants toward the shoots.
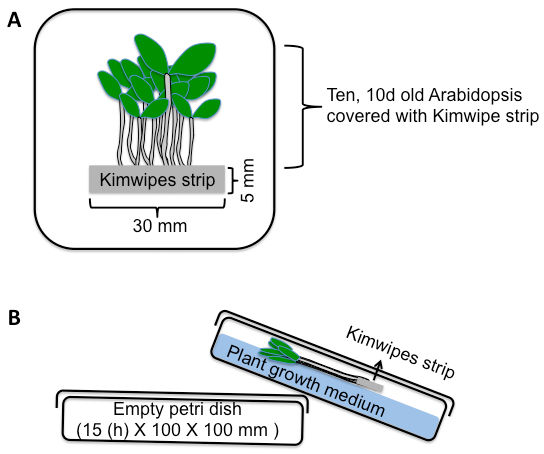
Figure 1. Salt stress experiment performed in a square Petri dish. A. Top view of 100 x 100 mm Petri dish with ten, 10 d old Arabidopsis (seedlings). The root tips are covered with a single layer Kimwipe strip (W x H: 30 x 5 mm). B. Side view of Petri dish with raised shoot end to prevent passive liquid flow to shoot tissue. The petri dish is covered with a lid to keep humidity high inside of the Petri dish. - Quickly rinse the tissues to be analyzed in DI water to remove any Na passively adhering to their surface.
- Harvest ~50 mg of fresh tissues and record the weight of each sample. For example, to obtain samples of ~50 mg from roots or shoots you will need at least 10 seedlings of 8-10 day old Arabidopsis plants per sample. You will also need to plan for at least three independent experiments with three technical replicates per experiment for robust statistical analyses.
- In a fume hood, digest each sample in a separate glass test tube (washed with 1% (vol/vol) nitric acid and dried prior to tissue digestion) in 0.6 ml of nitric acid at 120-150 °C for ~2 h or until all the plant tissues are completely dissolved. The 120 °C temperature is readily maintained using a heat block.
- Add a further 0.4 ml of 60% (vol/vol) HClO4 and incubate at 150-180 °C for an additional 2 h or until the total sample volume is reduced to ≤ 0.5 ml. There is no need to constantly shake or mix the sample.
- Cool to room temperature and add DI water up to 5 ml.
- The sodium concentration can now be determined using a Perkin-Elmer Optima 2000DV inductively coupled plasma optical emission spectrometer (ICP-OES) or similar equipment according to the manufacturer’s instructions. For example, parameter settings for a Perkin-Elmer Optima 2000DV are 0.60 L/min Nebulizer flow rate, 1 ml/min sample flow rate and 4 ml of total sample usage for 4 replicates (1 ml of each replicate).
- Raw results of Na level can be converted to parts per million (milligrams per liter) using a standard curve (Figure 2). To make this standard curve, Na standard concentration values in ppm (mg/L) were plotted as the x-axis values and corresponding corrected/normalized Na intensity values (Table 2) were then input as the y-axis values. These data can then be converted to milligrams per kilogram fresh weight using the following equation (1):

- Data from Na standards are shown in Tables 1-2 and Figure 2. Typical data from this experiment are shown in Tables 3-6 and Figure 3:
- Table 1, raw Na intensity values obtained from Na standards.
- Table 2, corrected/normalized Na intensity values of Na standards using the obtained raw Na standard intensity values in the Table 1. Method for correction/normalization is described in the Table 2 ‘Note’.
- Figure 2, standard curve of corrected/normalized Na intensity values.
- Table 3, raw data of Na intensity values of the control and 10 min salt treated Arabidopsis samples.
- Table 4, corrected/normalized Na intensity values obtained from Table 3.
- Table 5, Na levels in ppm (mg/L) of the control and 10 min salt treated Arabidopsis seedlings. Conversion of Na intensity values to ppm (mg/L) was done using equation 2, which was obtained based on linear regression analysis of the corrected Na standards (Figure 2).

- Table 6, final conversion of Na levels in Table 5 to ‘mg/kg fresh weight (F.W.)’ using equation 1 (above step 11).
- Figure 3, comparison of Na level in mg/kg F.W. in the roots of 10 old Arabidopsis seedlings in response to 100 mM salt treatment.
- Table 1, raw Na intensity values obtained from Na standards.
Representative data
- Table 1. Table of raw intensity values from Na standards detected by ICP-OES
Na concentration in standard (µM) Intensity value Replicate #1 Replicate #2 Replicate #3 Replicate #4 Average 0 (DI water) -13101 -12852 -13607 -13906 -13367 1 62192 62167 62641 62635 62409 10 207932 206271 203571 207676 206363 100 8783775 8703642 8666576 8517874 8667967 200 20306803 20237705 20096115 20508961 20287396 500 63460855 63572884 64524580 64081778 63910024
Table 2. Table of corrected* intensity values from raw Na standard valuesNote: *Na intensity is corrected/normalized by subtracting the average of the raw Na intensity values in the DI water from the raw Na intensity values in each Na standard. For example, in the above dataset, the average Na signal intensity values in DI water = ((-13101) + (-12852) + (-13607) + (-13906))/4 = -13367. Corrected/Normalized intensity value of replicate #1 of DI water is then -13101 - (-13367) = 265.Na concentration in standard (µM) Corrected intensity value Replicate #1 Replicate #2 Replicate #3 Replicate #4 Average 0 (DI water) 265 515 -241 -539 0 1 75559 75533 76007 76001 303101 10 221299 219637 216938 221043 878916 100 8797141 8717009 8679942 8531241 34725332 200 20320170 20251071 20109481 20522327 81203049 500 63474222 63586251 64537946 64095145 255693563
The equation obtained from the representative Na standard curve in Figure 1 is Y = 5.545e+006X - 1.706e+006 where Y is the corrected Na signal intensity and X is the Na level in mg/L. Therefore, Na level in mg/L from an unknown sample can be calculated using equation 2.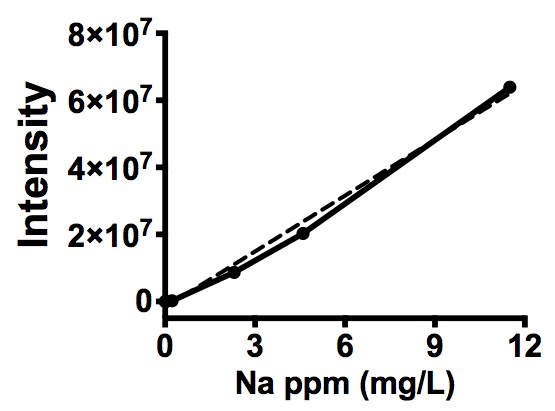
Figure 2. Na standard curve of corrected Na signal intensity. Na standard graph was generated using GraphPad Prism (Ver. 6) software (www.graphpad.com). Solid line represents corrected Na intensity (y axis) to corresponding Na concentration in ppm (mg/L, x axis). Dashed line indicates linear regression analysis of corrected/normalized Na standard (R2, 0.9912; slope, 5.545e+006 ± 111579; Y-intercept when X = 0, -1.706e+006 ± 573942; P value, < 0.0001).
Table 3. Raw data of Na signal intensity values from control and 10 min salt stressed Arabidopsis seedlingsNote: Na detection using ICP-OES was repeated 4 times (4 technical replicates) from three independent biological replicates (roots #1-#3) for each treatment (for a total of 12 replicates).Signal intensity Replicate #1 Replicate #2 Replicate #3 Replicate #4 Average Control root #1 14268939.3 14515870.1 14259302.6 14529114.1 14393306.5 Control root #2 18390245.8 18113970.6 18376953.2 18586787.6 18366989.3 Control root #3 15961897.1 15946196.2 16018475.1 16181451.1 16027004.9 10 min salt stress root #1 16524276.7 16462936.7 16385847.1 16373113.5 16436543.5 10 min salt stress root #2 16710847.8 16254854.6 16242386.2 16349709.2 16389449.5 10 min salt stress root #3 16676297.9 16596706.1 17026112.0 17105345.0 16851115.3
Table 4. Corrected/Normalized Na signal intensity values of raw data from Table 3Corrected/Normalizes signal intensity Replicate #1 Replicate #2 Replicate #3 Replicate #4 Average Control root #1 14282305.8 14529236.6 14272669.1 14542480.6 14406673.0 Control root #2 18403612.3 18127337.1 18390319.7 18600154.1 18380355.8 Control root #3 15975263.6 15959562.7 16031841.6 16194817.6 16040371.4 10 min salt stress root #1 16537643.2 16476303.2 16399213.6 16386480.0 16449910.0 10 min salt stress root #2 16724214.3 16268221.1 16255752.7 16363075.7 16402816.0 10 min salt stress root #3 16689664.4 16610072.6 17039478.5 17118711.5 16864481.8
Table 5. Conversion of Na signal intensity values to concentration in ppm (mg/L)Note: Na intensity from the samples can be converted into ppm (mg/L) using the equation 2.Na level (mg/L) replicate #1 replicate #2 replicate #3 replicate #4 Average Standard deviation (SD) Control root #1 2.883 2.928 2.882 2.930 2.91 0.027 Control root #2 3.627 3.577 3.624 3.662 3.62 0.035 Control root #3 3.189 3.186 3.199 3.228 3.20 0.019 10 min salt stress root #1 3.290 3.279 3.265 3.263 3.27 0.013 10 min salt stress root #2 3.324 3.242 3.239 3.259 3.27 0.040 10 min salt stress root #3 3.318 3.303 3.381 3.395 3.35 0.045
Table 6. Conversion of Na level to ‘mg/kg fresh weight (F.W.)Note: Na level in ppm (mg/L) in Table 5 was converted to Na level in ‘mg/L fresh weight’ using the equation 1.Na level (mg/kg F.W.) replicate #1 replicate #2 replicate #3 replicate #4 Average Standard deviation
(SD)Control root #1 2151.8 2185.0 2150.5 2186.8 2168.51 20.096 Control root #2 2706.4 2669.3 2704.6 2732.9 2703.30 26.116 Control root #3 2379.6 2377.5 2387.2 2409.2 2388.38 14.473 10 min salt stress root #1 2611.2 2602.4 2591.4 2589.6 2598.64 10.116 10 min salt stress root #2 2518.0 2455.7 2454.0 2468.7 2474.08 29.997 10 min salt stress root #3 2047.9 2039.0 2086.8 2095.6 2067.31 28.055 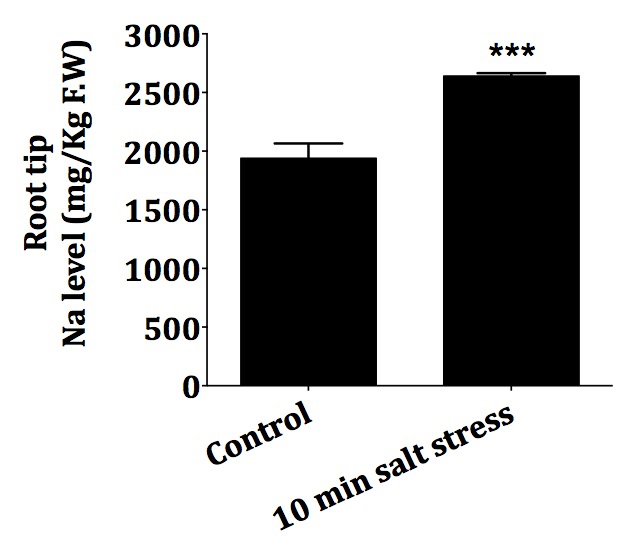
Figure 3. Comparison of Na level (mg/kg F.W.) in the roots of 10d old Arabidopsis in response to salt stress. Root tips of 10 d old Arabidopsis seedlings were subjected to salt stress with 100 mM NaCl for 10 min as described above. Error bar, standard deviation of n = 12 (P < 0.001). ***Student's t-test p value < 0.001 compared to Control.Notes
- Some sources of water contain high levels of Na that will provide a background to each sample. It is important to run a calibration on the ICP machine being used with an ICP-OES calibration standard according to the manufacturer's instructions. One commercial calibration mix for ICP-OES from Agilent Technologies, contains 500 mg/L Ca, Fe, K, Mg and Na in 5% (v/v) HNO3. Once the machine is calibrated, measure a Na calibration curve (see Recipes), paying special attention to the 0 Na point to establish if significant Na contamination is occurring. Using DI water is essential but contamination may also occur if the equipment has been previously used for samples with high Na content. Thorough flushing of the equipment with DI water is needed under these circumstances.
- The provided exemplary datasets in this protocol were obtained from 10 day old Arabidopsis wild type Columbia-0 ecotype seedlings grown under long day light cycles (16 h light/8 h dark) at 22 °C. Therefore, Na accumulation values might be variable depending on plant species, growth conditions, age, and genotypes.
Recipes
- NaCl standardsNote: Dissolve NaCl in DI water as indicated.
Na (μM) NaCl (g/L) 0 0 1 0.000023 10 0.00023 100 0.0023 200 0.0046 500 0.0115 - Alternative method of preparing Na standards from 1 M NaCl standard
- Prepare 1 ml of 1 M Na standard solution by dissolving 0.023 g of NaCl into 1 ml DI water and vortex until NaCl is completely dissolved.
- Dilute 1 M NaCl standard as below.Note: Make sure to make a minimum 5 ml of NaCl standard solutions as one measurement uses 1 ml of each standard solution but replicates for each point are needed.
NaCl standard Volume of NaCl standard Volume of DI water Dilution factor Total Volume (ml) 10 mM 10 µl of 1 M NaCl 990 µl 1:100 1 ml 1 mM 1 ml of 10 mM NaCl 9 ml 1:10 10 ml 500 µM 5 ml of 1 mM NaCl 5 ml 1:1 10 ml 200 µM 2 ml of 1 mM NaCl 8 ml 1:5 10 ml 100 µM 1 ml of 1 mM NaCl 9 ml 1:10 10 ml 10 µM 0.1 ml of 1mM NaCl 9.9 ml 1:100 10 ml 1 µM 0.1 ml of 100 µM NaCl 9.9ml 1:100 10 ml
- Prepare 1 ml of 1 M Na standard solution by dissolving 0.023 g of NaCl into 1 ml DI water and vortex until NaCl is completely dissolved.
- Composition of plant growth medium
The plant growth medium is half strength Epstein medium consisting of 3 mM KNO3, 2 mM Ca(NO3)2.4H2O, 0.5 mM MgSO4.7H2O, 1 mM (NH4)H2PO4, 0.56 mM myo-inositol, 2.3 mM 2-(N-morpholino)ethanesulfonic acid (MES), 10 mM sucrose, micro-nutrients, and 0.5% (w/v) Phytagel at pH 5.7.
The micro-nutrients are 25 μM KCl, 17.5 μM H3BO3, 1 µM MnSO4.H2O, 1 µM ZnSO4.7H2O, 0.25 µM CuSO4.5H2O, 0.25 µM (NH4)6MoO24.4H2O, and 25 µM (ethylene-dinitrilo)tetraacetic acid (Fe-Na EDTA).
Acknowledgments
The authors gratefully acknowledge funding from National Aeronautics and Space Administration (NNX13AM50G) and the National Science Foundation (NSF IOS-11213800, MCB-1329723) that supports this work. This protocol was adapted from Lahner et al. (2003) with slightly modification for small sample size of the use of fresh tissues.
References
- Choi, W. G., Toyota, M., Kim, S. H., Hilleary, R. and Gilroy, S. (2014). Salt stress-induced Ca2+ waves are associated with rapid, long-distance root-to-shoot signaling in plants. Proc Natl Acad Sci U S A 111(17): 6497-6502.
- Deinlein, U., Stephan, A. B., Horie, T., Luo, W., Xu, G. and Schroeder, J. I. (2014). Plant salt-tolerance mechanisms. Trends Plant Sci 19(6): 371-379.
- Kader, M. A. and Lindberg, S. (2005). Uptake of sodium in protoplasts of salt-sensitive and salt-tolerant cultivars of rice, Oryza sativa L. determined by the fluorescent dye SBFI. J Exp Bot 56(422): 3149-3158.
- Lahner, B., Gong, J., Mahmoudian, M., Smith, E. L., Abid, K. B., Rogers, E. E., Guerinot, M. L., Harper, J. F., Ward, J. M., McIntyre, L., Schroeder, J. I. and Salt, D. E. (2003). Genomic scale profiling of nutrient and trace elements in Arabidopsis thaliana. Nat Biotechnol 21(10): 1215-1221.
- Shabala, L., Cuin, T. A., Newman, I. A. and Shabala, S. (2005). Salinity-induced ion flux patterns from the excised roots of Arabidopsis sos mutants. Planta 222(6): 1041-1050.
- Some sources of water contain high levels of Na that will provide a background to each sample. It is important to run a calibration on the ICP machine being used with an ICP-OES calibration standard according to the manufacturer's instructions. One commercial calibration mix for ICP-OES from Agilent Technologies, contains 500 mg/L Ca, Fe, K, Mg and Na in 5% (v/v) HNO3. Once the machine is calibrated, measure a Na calibration curve (see Recipes), paying special attention to the 0 Na point to establish if significant Na contamination is occurring. Using DI water is essential but contamination may also occur if the equipment has been previously used for samples with high Na content. Thorough flushing of the equipment with DI water is needed under these circumstances.
Article Information
Copyright
© 2015 The Authors; exclusive licensee Bio-protocol LLC.
How to cite
Choi, W. and Gilroy, S. (2015). Quantification of Sodium Accumulation in Arabidopsis thaliana Using Inductively Coupled Plasma Optical Emission Spectrometery (ICP-OES). Bio-protocol 5(16): e1570. DOI: 10.21769/BioProtoc.1570.
Category
Plant Science > Plant biochemistry > Other compound
Plant Science > Plant physiology > Abiotic stress
Biochemistry > Other compound > Ion > Sodium
Do you have any questions about this protocol?
Post your question to gather feedback from the community. We will also invite the authors of this article to respond.