- Protocols

- Articles and Issues
- For Authors
- About
- Become a Reviewer

Assessment of Olfactory Behavior in Mice: Odorant Detection and Habituation-Dishabituation Tests


Published: Vol 5, Iss 13, Jul 5, 2015 DOI: 10.21769/BioProtoc.1518 Views: 13174
Reviewed by: Soyun KimYatang LiAnonymous reviewer(s)
Original research article
The authors used this protocol in:

Aug 2014

Protocol Collections
Comprehensive collections of detailed, peer-reviewed protocols focusing on specific topics


Abstract
Olfaction has adaptive value for rodents as it is essential for feeding and mating, the establishment of social and territorial relationships, or the detection of potential predators, among others (Apfelbach et al., 2005). Sensory input from the olfactory mucosa is first processed in the main olfactory bulb (MOB), a telencephalic structure that exhibits neurogenesis during the lifespan of the animal. Changes in MOB circuitry due to neuronal dysfunction or changes in interneuron turnover rate affect olfactory performance in different ways (Fleming et al., 2008; Breton-Provencher et al., 2009; Attems et al., 2014). Alterations in adult MOB neurogenesis, in particular, result in changes in odorant discrimination which can be assayed in habituation-dishabituation behavioral paradigms (Mouret et al., 2009; Delgado et al., 2014). Here, we present a simple protocol for the quantitative assessment of two olfactory tasks that can be used to detect neurogenic alterations in the MOB (Delgado et al., 2014). The procedure has been optimized to require little time and can, therefore, be used to analyze genetically modified mice that are housed in an isolated specific pathogen-free (SPF) mouse facility.
Materials and Reagents
- Animals
Laboratory-bred experimentally-naïve male mice. Both CD1 and C57BL/6J strains have been successfully tested. Male mice are housed in groups of 4-5 per cage, kept in an environment with controlled temperature (23 ± 2 °C) and humidity under a 12-12 h light-dark cycle with food and water ad libitum. The use of only one gender reduces inter-individual variation. Males are used instead of females to avoid cycling hormone effects associated to oestrus (Jemiolo et al., 1986).
Note: All mice must be of equal or similar age (i.e. always less than two weeks apart, as the rate of neurogenesis is age-dependent). When this is not possible, cohorts of similar sizes for each experimental condition can be tested separately at different times, but this schedule results in greater variability and will, therefore, require a higher total number of animals. In most of our experiments a minimum of 7 mice were required to reach statistical significance. However, 10-12 mice per group are recommended to minimize the effects of inter-individual variation. - Odorants
Odorants must have non-emotional value. We use two synthetic odorants: citralva (geranonitrile, 3,7-dimethyl-2,6-octadien-1-nitrile), a lemon-like citrus smell, and geraniol (3,7-dimethyl-2,6-octadien-1-ol), a sweet rose-like scent, at dilutions that range between 1:160 to 1:10. Both odorants have been tested before in olfactory experiments (Luo et al., 2002; Delgado et al., 2014) although others, i.e. banana odor (isoamyl acetate), almond odor (benzaldehyde), or hexanal, have also been used in similar tests (see, for example, Mandairon et al., 2006; Fleming et al., 2008). Odorants can be obtained from different suppliers, such as Ventós S.A (dealer of International Flavors and Fragrances Inc. Barcelona, Spain). Because synthetic fragrances are usually available in an oleic format, we use mineral oil for their dilution. It is important to keep them always in tightly sealed containers to minimize their evaporation. - Other materials
1.Mineral oil (Sigma-Aldrich, catalog number: M5904 )
Equipment
Olfactory experiments are performed in a dedicated lab room with positive pressure (10-15 gauges) and frequent air reposition (no less than 20 times per hour) for fast removal of odors. Indirect dim lighting is recommended for testing. Essence dilutions should be prepared in a different, not connected room.
The materials used (see Figure 1) are:
- A 22.5 x 22.5 x 29.5 cm open Plexiglas box with solid light green walls and a hole of 1 cm of diameter in one of the sides, located at 8 cm above the box ground and at 11.2 cm from the lateral corners of the box. A transparent methyl methacrylate solid cover is advisable to avoid essence dissipation during the tests. The video recording system is fixed above the exploration box at a distance of 30-40 cm from the transparent cover in order to video-tape at good resolution without interfering with the test.
Note: The olfactory exploration box can be custom-made following the description. The box is thoroughly wiped clean with 10% alcohol and dried before and after the experiment, as well as between animals. After each test, the used soiled bedding has to be carefully removed with a household vacuum cleaner and replaced by fresh bedding. Use odorless disposable paper towels and nitrile gloves for cleaning and drying. - Regular cotton sticks bought in any drugstore
- Lab timer
- Micropipette (2-20 or 20-200 µl-range) and appropriate disposable tips
- Adhesive tape
- 1.5 ml microcentrifuge tubes to preserve the essences and a microcentrifuge tube rack to avoid fluid-containing tubes from tipping over
- A sealed container (optional if the garbage bag is sealed) can be used for disposal of any objects that are impregnated with essences.
Procedure
- Threshold detection
This protocol is designed to measure odorant sensitivity by determining the lowest concentration of a certain odor that is perceivable by the sense of smell.
The group of mice that is going to be tested is kept in ventilated racks in a different room. Each mouse is extracted from its cage under a hood and placed in an empty clean box for transportation to the testing room. After the test, the mouse is returned to the original cage and the transportation box is thoroughly wiped clean.- General habituation to the testing conditions
The mice are first exposed to the general environment and procedure.- The mouse is gently placed in the testing box (Figure 2) previously covered with a uniform layer of clean bedding not exceeding 1 cm in height. We recommend covering the box with the transparent lid during testing.
Note: An excess of bedding in the testing box stimulates exploratory behaviors, such as scratching and digging, which may distract the mouse from the main task. On the contrary, mouse mobility is hindered and interferences with depositions are increased if the bedding is too little or absent at all. - The mouse is allowed a 3-min period of free exploration for context processing and habituation (Fanselow, 2000).
- A cotton stick soaked in mineral oil is introduced into the box through the little hole located in one of the box walls. The stick should protrude from the wall approximately 3 cm and it is held in place for 1 min.
Note: To impregnate the sticks, take 20 µl of the solution with a micropipette, close the tube lid immediately afterwards and deposit the 20 µl-drop directly into the swab head. An easy way to hold the stick in place without vibrations during the one-minute exposure is to use sticks that have been manually bent at right angles. Once the soaked end of the stick is passed through the hole, the other end can be easily fixed to the outside of the box wall with adhesive tape. It takes only a few seconds to change the stick. Avoid touching the testing box walls or the inner part of the hole with the impregnated swab. Use a lab timer without acoustic alarm to control time. - The first exposure to the mineral oil-soaked stick is followed by 4 more successive exposures to new sticks freshly soaked in the same mineral oil to produce a habituation to the stick and to its movement in and out of the box. This part of the test can also reveal differences between genotypes/strains in their exploratory response to novel objects.
- Use a digital video system to record the behavior of the animal throughout the testing.
- The mouse is gently placed in the testing box (Figure 2) previously covered with a uniform layer of clean bedding not exceeding 1 cm in height. We recommend covering the box with the transparent lid during testing.
- Threshold detection
After the 5 trials with the non-odorant stimulus, the mouse will be exposed to cotton sticks with increasing concentrations of one of the scents (diluted in mineral oil at 1:160, 1:80, 1:40, 1:20, and 1:10) to determine the minimum concentration that triggers exploration by the animal. We usually employ citralva for this task, but it can be done with any of the two odorants.- A cotton stick soaked in the scent at the lowest concentration is introduced into the box, as done previously for sticks with mineral oil, and held in place for 1 min.
Note: Use a new stick for every trial and immediately discard used sticks by placing them in a sealed container or zipped garbage bag. - A cotton stick soaked in mineral oil is then used in the same way.
- Next stick is soaked in the same scent but at double the concentration of the previous one.
- The procedure is then repeated until all concentrations have been tested.
- Use a digital video system to record the behavior of the animal throughout the testing.
The inter-trial interval (ITI) is defined as the time between exposures to the odorants. This interval should allow the mouse to show specific olfactory behaviors towards each scented stick without resulting in a general loss of interest in the task. For this test, an ITI of 1-2 min is recommended. Indeed, we use a one-minute ITI, during which we expose the animal to a stick impregnated in mineral oil (see step A2g). It is important to keep in mind that a very prolonged ITI can change the novelty value of each trial (Breton-Provencher et al., 2009) whereas very short ITIs can induce one habituation to context too fast (Sanderson and Bannerman, 2011).
Differences in the behavioral performance of mice in the control and experimental groups under analysis in this test indicate differences in olfactory perception (see, for example, Delgado et al., 2014; Figure 3A).
- A cotton stick soaked in the scent at the lowest concentration is introduced into the box, as done previously for sticks with mineral oil, and held in place for 1 min.
- General habituation to the testing conditions
- Olfactory habituation-dishabituation
The animals will be exposed to two different scents to test olfactory discrimination, or how the animals perceive the difference. This protocol is designed to test the habituation to a specific odor, indicated by the progressive decrease in the exploration time in successive presentations, and the dishabituation, indicated by increased exploration of a novel, distinct odor.
This second test should be run with a set of mice that is different from the ones tested in the odorant detection test, as novel and familiar odors are coded differently (Kato et al., 2012) and familiarity of odors could influence olfactory exploration and the grade of stimulus novelty perceived by the mouse.- General habituation to the testing conditions (follow section 1 in Procedure A).
- Habituation/dishabituation: After the 5 trials with the non-odorant stimulus, the mouse will be exposed to 5 presentations of one scent followed by 5 exposures to a different scent.
Note: A concentration of odorant that is perceived equally well by the control and experimental group will be used for this task. We routinely use 1:20.- A cotton stick impregnated with 20 µl of geraniol at 1:20 is introduced into the box, as done previously for sticks with mineral oil, and held in place for 1 min.
Note: Use a new stick for every trial and immediately discard used sticks by placing them in a sealed container or zipped garbage bag. - A cotton stick soaked in mineral oil is then used in the same way.
- Steps B2a-b are repeated 4 more times.
- A cotton stick impregnated with 20 µl of citralva at 1:20 is introduced into the box and held in place for 1 min.
- A cotton stick soaked in mineral oil is then used in the same way.
- Steps B2d-e are repeated 4 more times.
- Use a digital video system to record the behavior of the animal throughout the testing.
Habituation is reflected as a reduction in exploratory time after the first or first and second exposures to the same odor; dishabituation is reflected as a renovated interest in the novel odorant stimulus (see Figure 3B).
It is important to use a scent concentration that is appropriate for the test. The same odorant molecule can induce attractive or repulsive responses depending on its concentration (Yoshida et al., 2012). Moreover, olfactory sensory receptors may fail to generate action potentials at very high odorant concentrations (Ghatpande and Reisert, 2011). We recommend using the lowest concentration at which all animals clearly perceived the olfactory stimulus in the threshold detection test; that is, the concentration at which more animals exhibit the highest exploration time. In our experiments with geraniol and citralva in CD1 and C57BL/6J mice, these concentrations were either 1:40 or 1:20.
- A cotton stick impregnated with 20 µl of geraniol at 1:20 is introduced into the box, as done previously for sticks with mineral oil, and held in place for 1 min.
- General habituation to the testing conditions (follow section 1 in Procedure A).
Data analysis
In both types of experiment, the total time spent by each mouse performing any type of olfactory exploration action is assessed for every trial in the video recordings after the experiment is finished (Figure 2B and Video 1). Actions evaluated as olfactory exploration include touching the cotton or smelling, sniffing or heading the nose towards the stick at a close distance. The Smart Junior® software (Panlab, Spain) can be used to track all behaviors and to measure the time each mouse spends exploring the stick. The measurements can also be done manually using the video recording. The variables to compare statistically are “exploration time” and “trial” as detailed in Figure 3.
For the statistical analyses, a mixed-model ANOVA of repeated measures (“trial” factor) is used, followed by post hoc comparisons (e.g. Tukey or Bonferroni tests) to determine the occurrence of habituation and dishabituation. Finally, a “between-subjects” factor can be added to the ANOVA for comparison of two experimental groups. Statistical differences (p ˂ 0.05) are represented by *(dishabituation) and # (habituation).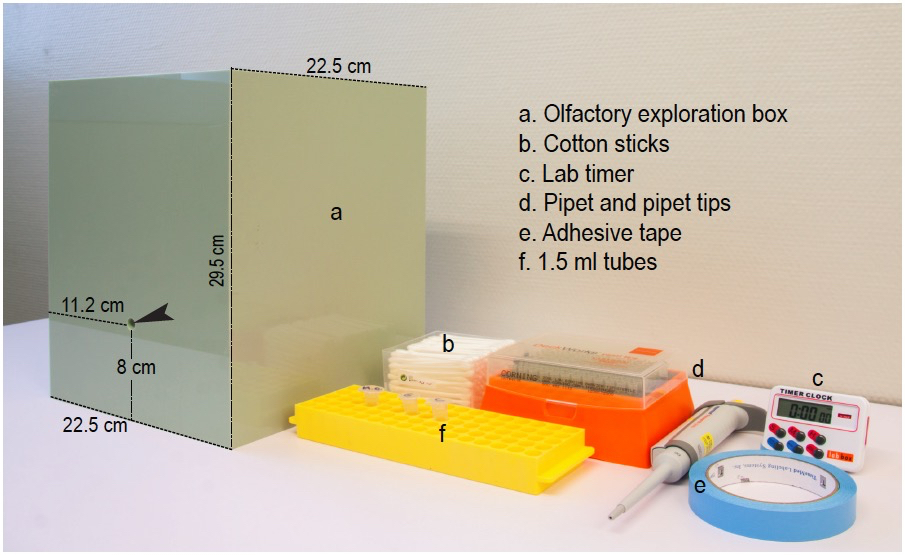
Figure 1. Equipment and materials. Photograph of the testing box and some of the required materials listed in the same order as they appear in the text. Arrow head points to the hole through which the scented stick is introduced into the exploratory box. 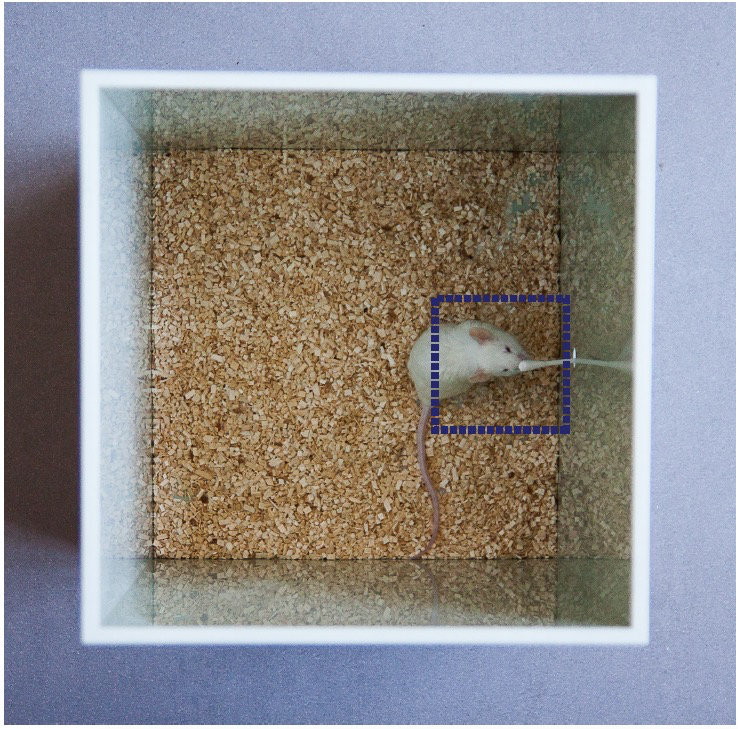
Figure 2. Evaluation scene. Illustrative image of a mouse during the test. Actions evaluated as olfactory exploration include touching the cotton or smelling, sniffing or heading the nose towards the stick at a close distance. For this, the image of a square with a side length of 6 cm centered at the swab tip is overlapped by the software in the video image. Computer-assisted evaluation may not be necessary if spatial references are set-up manually by the observer and kept standardized across sessions. 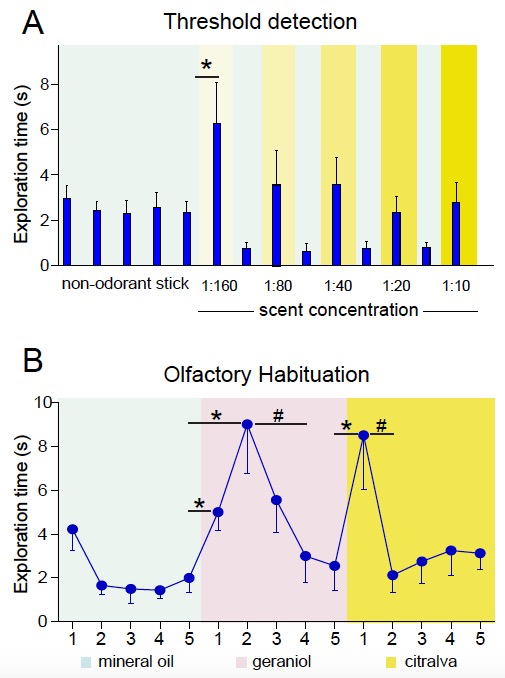
Figure 3. Representative results. A. Threshold detection test. Histogram showing the mean exploration time (in seconds) ± s.e.m. of a number of mice in trials with different concentrations of citralva interspersed by mineral oil sticks. For the analysis, a Student´s t-test comparing the time of exploration of the odorant stick vs. the non-odorant stick at each concentration can be used to analyze differences in odor detection. Threshold detection is established as the minimum scent concentration at which a significant difference is found (1:160 in the example). Thresholds for control and experimental groups can be compared (see Delgado et al., 2014). B. Habituation-dishabituation test. Graph showing the mean exploration time (in seconds) ± s.e.m. of a number of mice in successive trials of mineral oil, geraniol (1:20), and citralva (1:20) in the indicated order. Habituation is reflected as less time sniffing successive same-odor trials. Habituation is generally accelerated when mice get familiarized with the task and, therefore, it occurs more rapidly during the testing of a second odorant. Dishabituation is reflected as more time sniffing a new smell and is analyzed by comparing “trial 5” with “new-smell trial 1”. Eventually, a rise in olfactory exploration in trial 1 and 2, or even trial 3 may occur, usually during exposure of naïve freely exploring mice to the first odorant (see geraniol vs. citralva responses).

Acknowledgments
We thank the Servicios Centrales de Soporte a la Investigación Experimental and I. Noguera for technical assistance and animal care. I.F is supported by Fundación Botín and by Banco Santander through its Santander Universities Global Division, and by grants from Generalitat Valenciana (Programa Prometeo 2013/020and ISIC) and Ministerio de Economía y Competitividad (SAF2011-13332, CIBERNED CB06/05/0086, and RETIC TerCel RD12/0019/0008). In memoriam of our beloved friend Nicholas J. Mackintosh, Emeritus Professor of Experimental Psychology (University of Cambridge).
References
- Apfelbach, R., Blanchard, C. D., Blanchard, R. J., Hayes, R. A. and McGregor, I. S. (2005). The effects of predator odors in mammalian prey species: a review of field and laboratory studies. Neurosci Biobehav Rev 29(8): 1123-1144.
- Attems, J., Walker, L. and Jellinger, K. A. (2014). Olfactory bulb involvement in neurodegenerative diseases. Acta Neuropathol 127(4): 459-475.
- Breton-Provencher, V., Lemasson, M., Peralta, M. R., 3rd and Saghatelyan, A. (2009). Interneurons produced in adulthood are required for the normal functioning of the olfactory bulb network and for the execution of selected olfactory behaviors. J Neurosci 29(48): 15245-15257.
- Delgado, A. C., Ferron, S. R., Vicente, D., Porlan, E., Perez-Villalba, A., Trujillo, C. M., D'Ocon, P. and Farinas, I. (2014). Endothelial NT-3 delivered by vasculature and CSF promotes quiescence of subependymal neural stem cells through nitric oxide induction. Neuron 83(3): 572-585.
- Fanselow, M. S. (2000). Contextual fear, gestalt memories, and the hippocampus. Behav Brain Res 110(1-2): 73-81.
- Fleming, S. M., Tetreault, N. A., Mulligan, C. K., Hutson, C. B., Masliah, E. and Chesselet, M. F. (2008). Olfactory deficits in mice overexpressing human wildtype alpha-synuclein. Eur J Neurosci 28(2): 247-256.
- Ghatpande, A. S. and Reisert, J. (2011). Olfactory receptor neuron responses coding for rapid odour sampling. J Physiol 589(Pt 9): 2261-2273.
- Jemiolo, B., Harvey, S. and Novotny, M. (1986). Promotion of the Whitten effect in female mice by synthetic analogs of male urinary constituents. Proc Natl Acad Sci U S A 83(12): 4576-4579.
- Kato, H. K., Chu, M. W., Isaacson, J. S. and Komiyama, T. (2012). Dynamic sensory representations in the olfactory bulb: modulation by wakefulness and experience. Neuron 76(5): 962-975.
- Luo, A. H., Cannon, E. H., Wekesa, K. S., Lyman, R. F., Vandenbergh, J. G. and Anholt, R. R. (2002). Impaired olfactory behavior in mice deficient in the alpha subunit of G(o). Brain Res 941(1-2): 62-71.
- Mandairon, N., Sultan, S., Rey, N., Kermen, F., Moreno, M., Busto, G., Farget, V., Messaoudi, B., Thevenet, M. and Didier, A. (2009). A computer-assisted odorized hole-board for testing olfactory perception in mice. J Neurosci Methods 180(2): 296-303.
- Mouret, A., Lepousez, G., Gras, J., Gabellec, M. M. and Lledo, P. M. (2009). Turnover of newborn olfactory bulb neurons optimizes olfaction. J Neurosci 29(39): 12302-12314.
- Sanderson, D. J. and Bannerman, D. M. (2011). Competitive short-term and long-term memory processes in spatial habituation. J Exp Psychol Anim Behav Process 37(2): 189-199.
- Yoshida, K., Hirotsu, T., Tagawa, T., Oda, S., Wakabayashi, T., Iino, Y. and Ishihara, T. (2012). Odour concentration-dependent olfactory preference change in C. elegans. Nat Commun 3: 739.
Article Information
Copyright
© 2015 The Authors; exclusive licensee Bio-protocol LLC.
How to cite
Perez-Villalba, A., Palop, M. J., Pérez-Sánchez, F. and Fariñas, I. (2015). Assessment of Olfactory Behavior in Mice: Odorant Detection and Habituation-Dishabituation Tests. Bio-protocol 5(13): e1518. DOI: 10.21769/BioProtoc.1518.
Category
Neuroscience > Behavioral neuroscience > Cognition
Neuroscience > Behavioral neuroscience > Learning and memory
Neuroscience > Sensory and motor systems
Do you have any questions about this protocol?
Post your question to gather feedback from the community. We will also invite the authors of this article to respond.