- Protocols

- Articles and Issues
- For Authors
- About
- Become a Reviewer

Isolation of Polysome-bound mRNA from Rice Solid Tissues Amenable for RT-PCR and Profiling Experiments

Published: Vol 5, Iss 5, Mar 5, 2015 DOI: 10.21769/BioProtoc.1411 Views: 15657
Reviewed by: Ru ZhangAnonymous reviewer(s)
Original research article
The authors used this protocol in:
Oct 2013
Advertisement


Protocol Collections
Comprehensive collections of detailed, peer-reviewed protocols focusing on specific topics


Abstract
Polysome profile analysis is a frequently performed task in translational control research that not only enables direct monitoring of the efficiency of translation but can easily be extended with a wide range of downstream applications such as Northern and western blotting, genome-wide microarray analysis or qRT-PCR. Here, we describe a method for the isolation and quantification of high-quality polysome-bound mRNA complexes from small quantities of liquid-nitrogen-frozen solid tissue samples of rice shoots/roots. The mRNA obtained can be further analyzed by methods that evaluate polysomal mRNA abundance at the individual transcript or global level.
Materials and Reagents
- 30-day-old rice roots or shoots
- Liquid nitrogen
- 3 M sodium acetate (Thermo Fisher Scientific, catalog number: S209-500 )
- Chloramphenicol (50 mg/ml) (Sigma-Aldrich, catalog number: C0378 )
- Cycloheximide (50 mg/ml) (Sigma-Aldrich, catalog number: C7698 ) in MilliQ water
Note: Cycloheximide inhibits protein synthesis by blocking translation elongation. This molecule interferes with the translocation of tRNAs with the mRNA and the ribosome, resulting in fixed ribosomes on mRNAs. - 8 M guanidine hydrochloride solution (Sigma-Aldrich, catalog number: G9284 )
- Chloroform
- Ethylene glycol-bis(2-aminoethylether)-N,N,N′,N′-tetraacetic acid (EGTA) (Sigma-Aldrich, catalog number: E3889 )
- Isopropanol
- KCl (Thermo Fisher Scientific, catalog number: BP-366-500 )
- Linear acrylamide (5 mg/ml) (Life Technologies, InvitrogenTM, catalog number: AM9520 )
- MgCl2 (Sigma-Aldrich, catalog number: M-2393 )
- Nonidet P40 (Biocompare, catalog number: DG514 )
- Phenol water saturated
- Sucrose (Sigma-Aldrich, catalog number: S1888 )
- Tris.HCl (pH 8.4) (Thermo Fisher Scientific, catalog number: BP152-1 )
- Trizol reagent (Life Technologies, InvitrogenTM, catalog number: 15596-026 )
- 10x sucrose solution salts buffer (see Recipes)
- 2 M sucrose (see Recipes)
- 20-50 % sucrose solutions (see Recipes)
- Polysome buffer (see Recipes)
Equipment
- 0.22 μm filter
- Density gradient fractionation system composed by
- Peristaltic pump (Gilson Minipuls 3 peristaltic pump)
- Cary 60 UV-Vis Spectrophotometer (Agilent)
- Flow cell quartz (1 mm 113 μl, 1/pk) (Agilent, catalog number: 6610019900 )
- Fraction collector (Bio-Rad Laboratories, model: 2110 )
- Peristaltic pump (Gilson Minipuls 3 peristaltic pump)
- Beckman optima L-70 ultracentrifuge (Beckman Coulter)
- Beckman tubes
- Parafilm
- Boekel scientific orbitron rotator I (115V) (Boekel Scientific)
- Mini centrifuge (Eppendorf, model: 5415D)
- NanoDrop (Thermo Fisher Scientific)
Software
- The Agilent Cary WinUV software
Procedure
- Preparation of sucrose gradients
- Prepare 50 ml of 50% (w/v) sucrose solution by mixing 36.7 ml of sucrose (2 M) and 13.3 ml of 10x sucrose salts. Filter solutions with 0.22 μm filter.
- Prepare 50 ml of 35% (w/v) sucrose solution by mixing 25.6 ml of sucrose (2 M) and 24.4 ml of 10x sucrose salts. Filter solutions with 0.22 μm filter.
- Prepare 62 ml of 20% (w/v) sucrose solution by mixing 18.2 ml of sucrose (2 M) and 43.8 ml of 10x sucrose salts. Filter solutions with 0.22 μm filter.
- For one gradient, carefully add 1.85 ml of the 50% sucrose solution, 3.65 ml of the 35%, 3.65 ml of the 20% (w/v) and again 1.35 ml of 20% (w/v) to Beckman tubes (12 ml total volume). Prepare gradients at least one day before cell lysis to allow gradient to diffuse overnight at 4 °C.
- Cover the tube with parafilm and incubate at 4 °C overnight. Alternatively, sucrose gradients can be stored at -80 °C indefinitely.
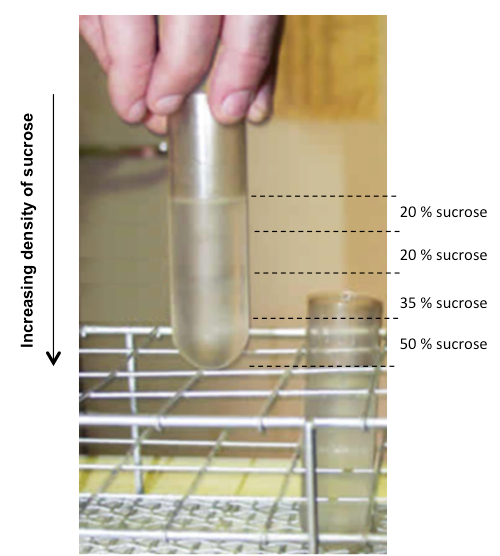
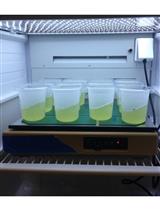
Figure 1. Sucrose gradients. Distribution of the sucrose layers (sucrose concentrations shown as percent weight per volume on right).
- Prepare 50 ml of 50% (w/v) sucrose solution by mixing 36.7 ml of sucrose (2 M) and 13.3 ml of 10x sucrose salts. Filter solutions with 0.22 μm filter.
- Isolation and polysome profiling
- 30-day-old rice roots or shoots were harvested, frozen and ground to powder in liquid nitrogen.
- 150 mg of powder was combined with 1.2 ml of chilled polysome buffer.
- Debris was removed by centrifugation at 16,000 x g for 15 min at 4 °C.
- Aliquots of the resulting supernatant were transferred (about 500 μl) to a new pre-chilled 1.5 ml tube. Measure OD260nm for each sample using NanoDrop.
- Load the same OD amount of lysate onto each gradient on to 20 to 50% (w/w) continuous sucrose gradients. Keep 10% of lysates as an input to determine the cytosolic steady-state mRNA levels.
- Weight and balance each gradient before ultracentrifugation.
- Centrifuge at 175,000 x g for 165 min at 4 °C using SW41Ti rotor in a Beckman Coulter.
- While the samples are centrifuging, clean fraction collector with warm MilliQ water containing a bit of RNase decontamination solution.
- Carefully remove tubes from the rotor and place them at 4 °C until they are ready for running.
- Switch on computer, pump, UV-Vis Spectrophotometer and fraction collector. Set pump at 2.3 ml/min and the fraction collector by time. Place 10 ml tubes on fraction collector.
- Open Cary WinUV software.
- Fractions were collected from the bottom to the top of the gradient with continuous monitoring of the absorbance at 254 nm. Run chasing solution [20% (w/v) sucrose] with bromophenol blue through the system until it reaches the needle. Make sure to see at least one drop coming out of the needle such that no bubbles are introduced into the gradient.
- Begin running the chasing solution through the gradient. Run solution with the pump at 2.3 ml/min.
- Click on acquire data button and press run on the fraction collector.
- Place fractions on dry ice.
- 30-day-old rice roots or shoots were harvested, frozen and ground to powder in liquid nitrogen.
- Polysomal RNA extraction
- Add 4 ml of Trizol reagent to each tube
- Isolate RNA according to manufacturer’s Trizol protocol.
- Measure the RNA concentration of each fraction or input.
- Add 4 ml of Trizol reagent to each tube
Representative data
We used a simple and highly reproducible method for the analysis of polysomes in rice (Oryza sativa). All the experiments we made, displayed a very similar profiles, however, some differences can be observed in the form of the profiles when the plants are stressed and also in the older plants. In the literature, analysis of polysome profiles issued from different plant species show a variability between species and plant organs as shown in Figure 2 below.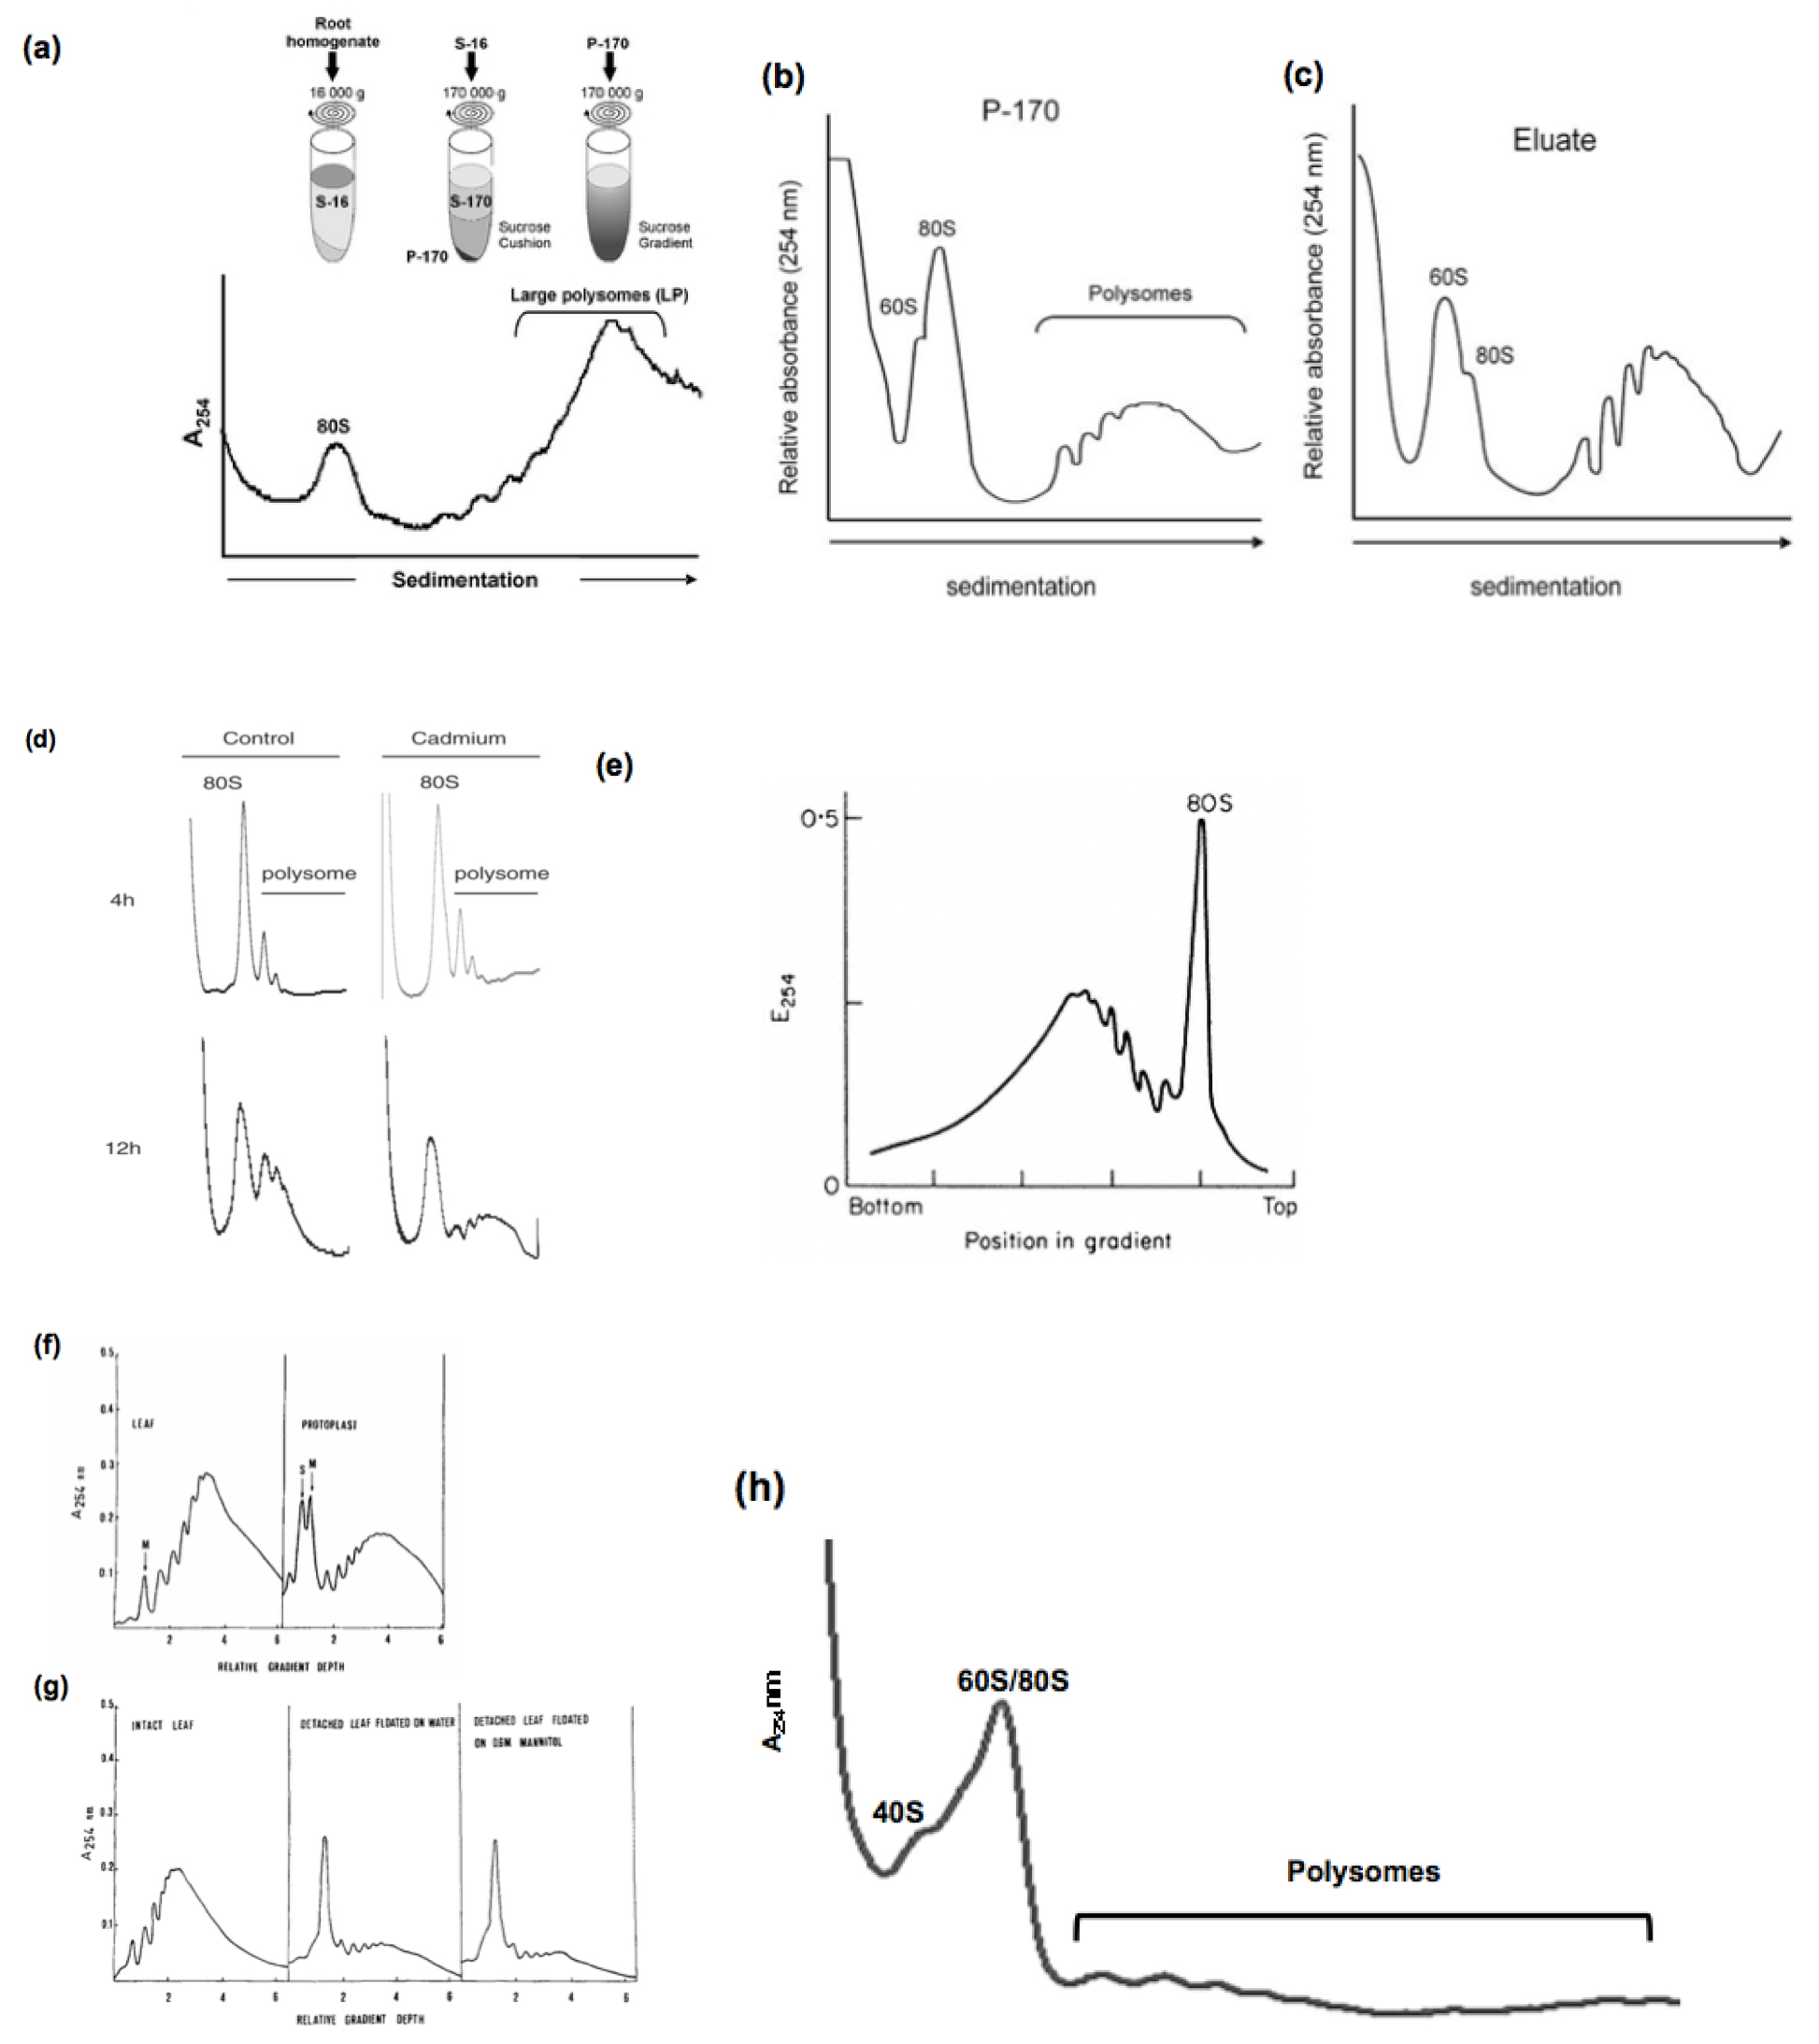
Figure 2. Analysis of polysome profiles from different plant species
Example 1 (Figure 2a): Polysomal extrcation from Medicago truncatula roots. Ribosomes were pelleted by ultracentrifugation of whole extracts (S-16) of transgenic roots through a 1.7-m sucrose cushion to obtain the post-ribosomal supernatant (S-170) and the ribosome pellet (P-170). P-170 was fractionated by ultracentrifugation through a 20–60% (w/v) sucrose density gradient and the absorbance at 254 nm was recorded. Positions of monosomes (80S) and large polysomes (LP, ≥5 ribosomes) are indicated. [from Reynoso et al. (2012)]
Example 2 (Figure 2b-c): Ribosomes purified from Arabidopsis tahliana leaf tissues by conventional ultracentrifugation (P-170) (a) or by immunopurification (eluate) (b) were fractionated in 20% to 60% (w/v) sucrose density gradients and the UV absorbance (254 nm) profile was recorded. The positions of the 60S ribosomal subunit, 80S mono-somes, and polysomes are indicated. [from Zanetti et al. (2005)]
Example 3 (Figure 2d): Cadmium-induced alteration of the polysomes profile using Arabidopsis thaliana suspension cells . The polysome profile of control and cadmium-treated cells treated with 200 μM cadmium for 4 or 12 h, are represented. [from Sormani et al. (2011)]
Example 4 (Figure 2e): Sucrose density profiles of ribosomes and polysomes from Pisum sativum. Ribosomes recovered after 6 h. centrifugation through 1 M-sucrose cushion. E254=absorbance at 254 nm.
[from Leaver and Dyer (1974)]
Example 5 (Figure 2f-g): Typical polysome profiles obtained from tobacco leaf tissues and protoplasts, respectively, are shown in (a). The effect of detachment on the polysome populations of tobacco leaves is schown un (b). Sucrose density gradient profiles of polysome preparations obtained from attached leaves (left), leaves detached and floated on water for 4 h (middle) and leaves detached and floated on 0.6 M mannitol for 4 h (right). [from Ruzicska et al. (1979)]
Example 6 (Figure 2h): Polysome profiles generated from roots of young WT rice plants grown in Pi-sufficient media (15 d-old). [from Jabnoune (unpublished)]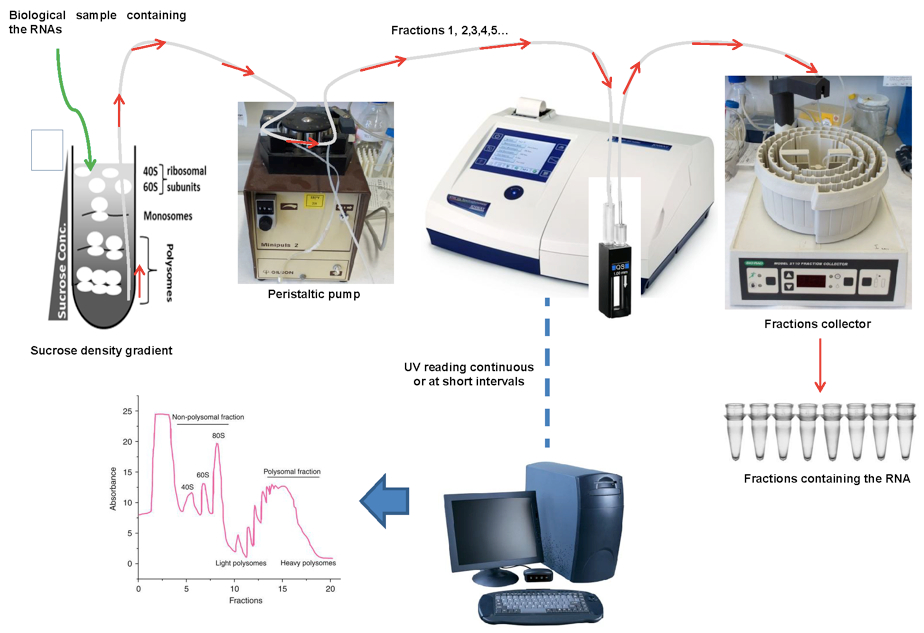
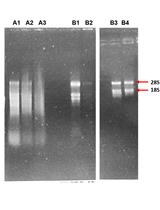
Figure 3. Fractionation of polysome gradients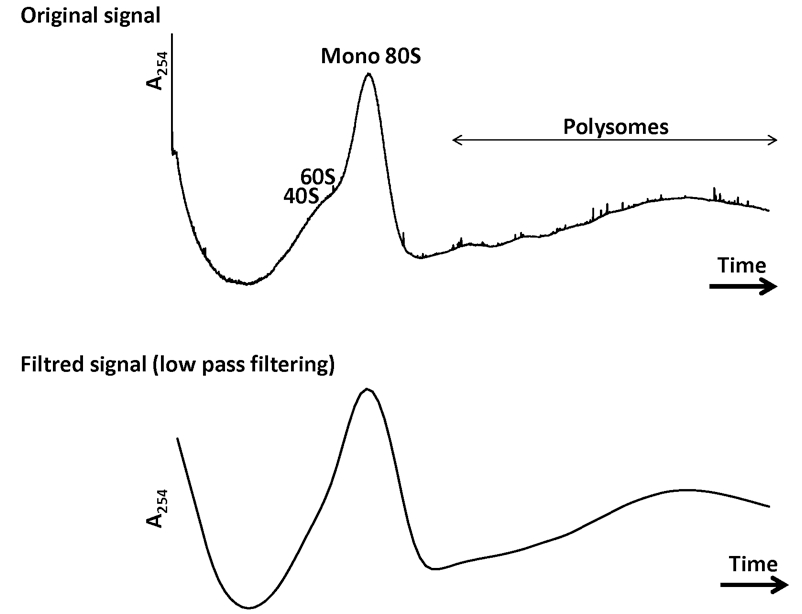
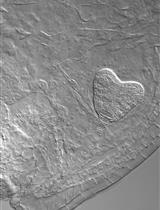
Figure 4. A representative example of data obtained
Note: We used a simple and highly reproducible method for the analysis of polysomes in rice (Oryza sativa). All the experiments we made, displayed a very similar profiles, however, some differences can be observed in the form of the profiles when the plants are stressed and also in the older plants. In the literature, analysis of polysome profiles issued from different plant species show a variability between species and plant organs (see examples in Figure 2).
Notes
To isolate the RNA form fractions from sucrose density centrifugation for polysome analysis, it’s important to keep in mind that TRizol purification could be the best option in case of large scale extraction (Rice produce more biological materiel than Arabidospis). In case of small samples (particularly Arabidopsis roots samples) the use of RNeasy kit purification of RNA will be more cost-effective but sometimes the quality of the RNA would be not of high quality for subsequent qPCR analysis. It’s important to centrifuge the Trizol extract at 12,000 x g for 15 min to separate the phases. We have to sacrifice a layer of the aqueous phase (containing RNA) at the interphase, so that we will carry over proteins and phenol to the RNA.
Recipes
- 10x sucrose solution salts buffer (100 ml)
0.4 M Tris-HCl (pH 8.4)
0.2 M KCl
0.1 M MgCl2
qsq 100 ml H2O
Autoclave
Add after autoclaving
100 μg/ml cycloheximide
1x protease inhibitor cocktail (EDTA-free)
100 units/ml RNase inhibitor - 2 M sucrose (200 ml)
Sucrose 137 g
Qsq 200 ml 1x sucrose solution salts
Autoclave - 20-50 % sucrose solutions
Final (%) Volume (ml) Sucrose 2 M 1x sucrose salts 50 % 12 8.8 3.2 25 18.3 6.7 50 36.7 13.3 75 55 20 35% 25 12.9 12.1 45 23.1 21.9 50 25.6 24.4 90 46.3 43.7 100 51.3 48.7 150 76.9 73.1 20% 32 9.4 22.6 62 18.2 43.8 122 35.8 86.2 200 58.6 141.4 - Polysome buffer (10 ml)
10x sucrose solution salts 2.5 ml
EGTA 20 mg
Nonidet-P40 50 µl
Cycloheximide (50 mg/ml) 10 µl
Chlormaphenicol (50 mg/ml) 10 µl
Qsq 10 ml H2O
Acknowledgments
This work was funded by the Swiss National Foundation grant (31003A-12293 and 31003A-138339) and the Sino-Swiss Science and Technology Cooperation Program (IZLCZ3 123946 to YP and 2009DFA32040 to QS).
References
- Dowling, R. J., Topisirovic, I., Alain, T., Bidinosti, M., Fonseca, B. D., Petroulakis, E., Wang, X., Larsson, O., Selvaraj, A., Liu, Y., Kozma, S. C., Thomas, G. and Sonenberg, N. (2010). mTORC1-mediated cell proliferation, but not cell growth, controlled by the 4E-BPs. Science 328(5982): 1172-1176.
- Lanet, E., Delannoy, E., Sormani, R., Floris, M., Brodersen, P., Crete, P., Voinnet, O. and Robaglia, C. (2009). Biochemical evidence for translational repression by Arabidopsis microRNAs. Plant Cell 21(6): 1762-1768.
- Leaver, C. J. and Dyer, J. A. (1974). Caution in the interpretation of plant ribosome studies. Biochem J 144(1): 165-167.
- Reynoso, M. A., Blanco, F. A., Bailey-Serres, J., Crespi, M. and Zanetti, M. E. (2012). Selective recruitment of mRNAs and miRNAs to polyribosomes in response to rhizobia infection in Medicago truncatula. Plant J 73: 289-301.
- Ruzicska, P., Mettrie, R., Dorokhov, Y. L., Premecz, G., Olah, T. and Farkas, G. L. (1979). Polyribosomes in protoplasts isolated from tobacco leaves. Planta 145(2): 199-203.
- Sormani, R., Delannoy, E., Lageix, S., Bitton, F., Lanet, E., Saez-Vasquez, J., Deragon, J. M., Renou, J. P. and Robaglia, C. (2011). Sublethal cadmium intoxication in Arabidopsis thaliana impacts translation at multiple levels. Plant Cell Physiol 52(2): 436-447.
- Zanetti, M. E., Chang, I. F., Gong, F., Galbraith, D. W. and Bailey-Serres, J. (2005). Immunopurification of polyribosomal complexes of Arabidopsis for global analysis of gene expression. Plant Physiol 138(2): 624-635.
16532-K
Article Information
Copyright
© 2015 The Authors; exclusive licensee Bio-protocol LLC.
How to cite
Jabnoune, M., Secco, D., Lecampion, C., Robaglia, C., Shu, Q. and Poirier, Y. (2015). Isolation of Polysome-bound mRNA from Rice Solid Tissues Amenable for RT-PCR and Profiling Experiments. Bio-protocol 5(5): e1411. DOI: 10.21769/BioProtoc.1411.
Category
Plant Science > Plant molecular biology > RNA > RNA extraction
Molecular Biology > RNA > qRT-PCR
Do you have any questions about this protocol?
Post your question to gather feedback from the community. We will also invite the authors of this article to respond.