
- Home
- Protocols

-

Headloop PCR
Last updated date: Mar 15, 2021 Views: 2758 Forks: 0
Headloop PCR
This protocol is for performing headloop PCR using zebrafish embryos mutated with CRISPR/Cas9 ribonucleoprotein complexes, as detailed in: Kroll et al. 2021, eLife 10:e59683, DOI: 10.7554/eLife.59683.
Headloop PCR is a form of suppression PCR, first used by Rand et al. to specifically amplify methylated DNA from complex mixtures (Rand et al. 2005, Nucleic Acids Research 33(4): e127, DOI: 10.1093/nar/gni120). The amplification of a DNA molecule can be suppressed in a sequence- specific manner by the addition of a tag sequence to one of the PCR primers. This can be used to test the efficiencies of CRISPR/Cas9 guide RNAs, or identify germline transmission of mutations, by specifically suppressing the amplification of the known wildtype haplotype sequence (Kroll et al. 2021). This protocol was used for performing headloop PCR using zebrafish embryos, but it should be straightforward to adapt it for other contexts.
Workflow
- Design standard primers and test
- Design headloop primers and validate suppression
- Inject CRISPR/Cas9 RNPs
- Extract DNA
- Perform standard and headloop PCR in parallel
- Analyse PCR products by gel electrophoresis
1. Design standard primers and test
Design standard primers flanking the guide RNA target sequence and optimise their use in PCR (see below for PCR conditions), determining a minimum number of cycles needed to generate enough product to detect by agarose gel electrophoresis.
We have successfully used primers that generate PCR products ranging from ~750 bp to ~150 bp in size. We recommend that, where possible, the flanking primer sequences are some distance from the target site so that they less likely to be modified or deleted by the action of Cas9 and subsequent DNA repair. Standard desalted primers are sufficient.
2. Design headloop primers and validate suppression
Design headloop primers by adding headloop tags to the 5’ end of the validated standard primers. We have generated a Python script to design headloop primers, available at GitHub https://github.com/GTPowell21/Headloop.
Design considerations used by the script:
- We used 20 bp tags to match guide RNA target sequences and this worked well in all test cases; we have not tested the effect of varying tag size.
- The tag sequence is determined with respect to the orientation of the primer and the target. If the target and headloop primer are on the same strand, the headloop tag should be the reverse complement of the target; if the target and headloop primer are on opposite strands, part of the target and its downstream sequence will form the headloop tag (see Figure 3-figure supplement 3B in Kroll et al.).
- The Cas9 cut site (or specific mutation) should be located towards the 5’ end of the tag.
- The tag sequence should be optimised to match the melting temperature of the standard primers as far aspossible.
- Standard desalted primers are sufficient for the headloop primers: non-standard purification or production methods are not required.
Validate the headloop tag PCR primers by testing them using wildtype genomic DNA first, ideally derived from the same stock(s) that will be used for CRISPR/Cas9 injections. Polymorphisms in the target sequence, or mismatched annealing temperatures, may prevent suppression of the wildtype haplotype.
3. Inject CRISPR/Cas9 RNPS
Please refer to the injection protocol from Kroll et al. 2021: http://dx.doi.org/10.17504/protocols.io.bs2rngd6.
4. Extract DNA
We extracted DNA from single embryos using a modified version of the HOTSHOT protocol (detailed in Merker et al. 2007, Biotechniques 43(5):610, 612, 614, DOI: 10.2144/000112619).
Digest embryos in a mixture of 25 mM KOH, 0.2 mM EDTA (50 µL for 4 d. p. f. embryos, adjust volume according to stage/amount of tissue) at 95°C for 30 minutes. Cool and collect the lysate using a centrifuge and neutralise with the addition of an equal volume of 40 mM Tris-HCl, pH 5. Mix gently and store at 4°C.
5. Perform standard PCR and headloop PCR in parallel
Perform all PCR reactions using a “proof-reading” polymerase (high fidelity, with 3´→5´ exonuclease activity). We have used Phusion polymerases (Thermo Fisher Scientific), but other “proof-reading” polymerases should work well. When performing headloop PCR, use only one headloop primer at a time e. g. forward headloop-tagged primer and standard reverse primer.
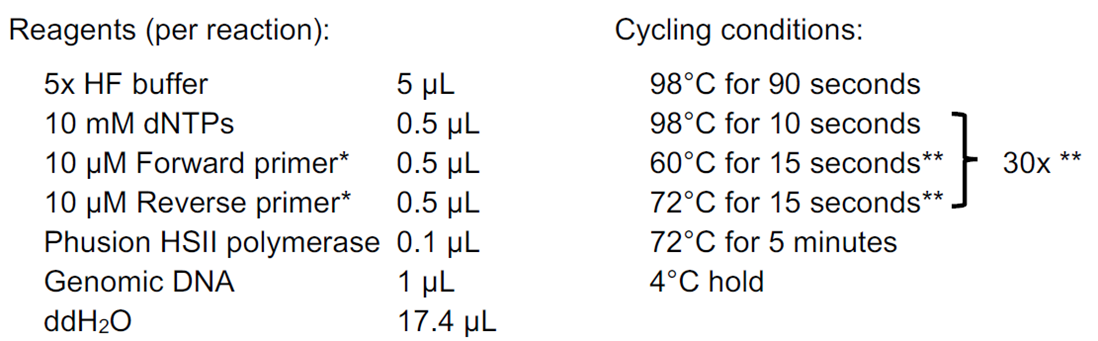
* replace either primer with the corresponding headloop primer for headloop PCR
** optimise according to assay; use minimum number of cycles possible; use same conditions for standard and headloop PCR
6. Analyse PCR products by gel electrophoresis
Run 5 µL samples of each PCR reaction on 2% agarose gels in TAE buffer (40 mM Tris, 20 mM acetic acid, 1mM EDTA; adjust electrophoresis conditions according to expected PCR product size and desired band resolution). If quantification is desirable, run samples of standard PCR and headloop PCR for the same DNA sample side-by-side.
The headloop PCR band may appear to be a different size to the standard PCR band as a result of mutation (insertion or deletion) and the size of the headloop tag.
Quantify band intensities to determine RNP efficiency: for a given embryo sample, low efficiency would be indicated by a strong standard PCR band and weak headloop PCR band, whereas high efficiency would be indicated by standard PCR and headloop PCR bands of a similar intensity.
We generated an efficiency score by dividing the headloop PCR band intensity over the corresponding standard PCR band intensity (ranging from 0 = no mutagenesis detected, to 1 = all haplotypes mutated) and found that to correlate well with MiSeq quantification of mutagenesis (see Figure 3-figure supplement 1 in Kroll et al.).
- Powell, G T(2021). Headloop PCR. Bio-protocol Preprint. bio-protocol.org/prep930.
- Kroll, F., Powell, G. T., Ghosh, M., Gestri, G., Antinucci, P., Hearn, T. J., Tunbak, H., Lim, S., Dennis, H. W., Fernandez, J. M., Whitmore, D., Dreosti, E., Wilson, S. W., Hoffman, E. J. and Rihel, J.(2021). A simple and effective F0 knockout method for rapid screening of behaviour and other complex phenotypes. eLife. DOI: 10.7554/eLife.59683
Category
Do you have any questions about this protocol?
Post your question to gather feedback from the community. We will also invite the authors of this article to respond.