Materials required:
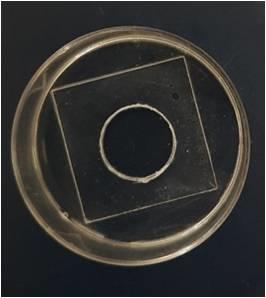
1. Punched 35 X 10 mm culture dishes (Thermoscientific Nunc dishes) with cover slip (22 X 22mm No. 1, Thermoscientific) glued at the bottom (Figure 1).
2. Adult hemolymph-like (AHL) saline (108 mM NaCl, 5 mM KCl, 2 mM CaCl2, 8.2 mM MgCl2, 4 mM NaHCO3, 1 mM NaH2PO4, 5 mM trehalose, 10mM Sucrose, 5mM Tris pH 7.5)
3. Low melt agarose (Invitrogen)
Ex vivo live Imaging:
1. Dissect adult Drosophila brains in Adult hemolymph-like (AHL) saline.
2. Mount the dissected brains on a clean and dry culture dish in an orientation such that the imaging plane is closer to the cover slip (posterior side up for imaging mushroom body).
3. Embed the mounted brain in 6µl of 0.8 - 1% low-melt agarose (dissolved in double distilled water). Once it starts drying, add AHL. Make sure that agarose does not slide between cover slip and brain. Also, agarose should not dry completely.
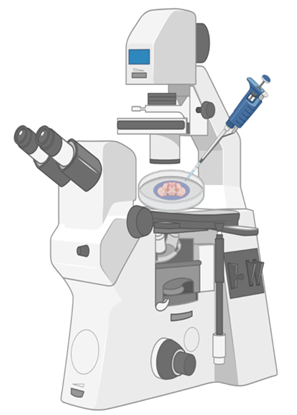
4. Image these preps as time series on particular XY plane using a 20x objective on an Olympus FV3000 inverted confocal microscope. Stimulus (optogenetic/chemical) can be given at any frame (Figure 2).
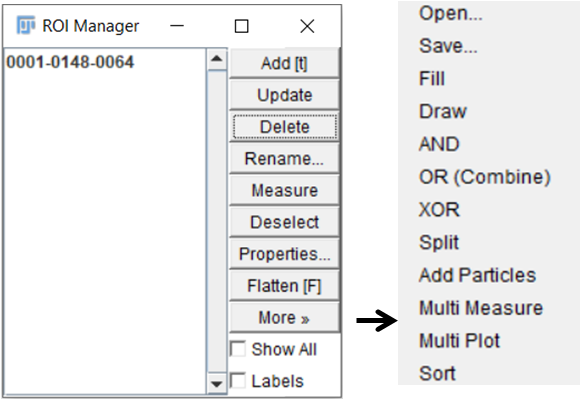
5. To quantify, use time series analyser plugin in Fiji (Figure 3).
Open raw image > open plugin Time series analyser > mark ROIs on the image > add each selected ROI to the list one by one (Add(t)) > select More > Multimeasure (Extract Mean gray values by selecting Results > set measurements > tick mean gray value)
Save selected ROIs for future reference (More > Save)
Extract raw fluorescence value for each ROI and a background ROI at each time point. Subtract background fluorescence from fluorescence value of each ROI. Calculate ΔF/F at each time point (t) using formula: ΔF/F = (Ft-F0) / F0, where F0 is the average basal fluorescence of the first 20 frames.
6. Different parameters then can be quantified like area under the curve, max fluorescence for each cell, slope and time to reach max fluorescence.

Figure 1: Punched culture dish

Figure 2: Imaging set up

Figure 3: ROI manager of Time series analyser plugin in Fiji
