
- Home
- Protocols

-

KEGG pathway enrichment analysis using clusterProfiler
Last updated date: Aug 4, 2020 Views: 2211 Forks: 0
E. coli KEGG pathway enrichment using clusterProfiler 1
This document shows how to run clusterProfiler1 for functional enrichment of KEGG pathways using sets of E. coli genes in R.
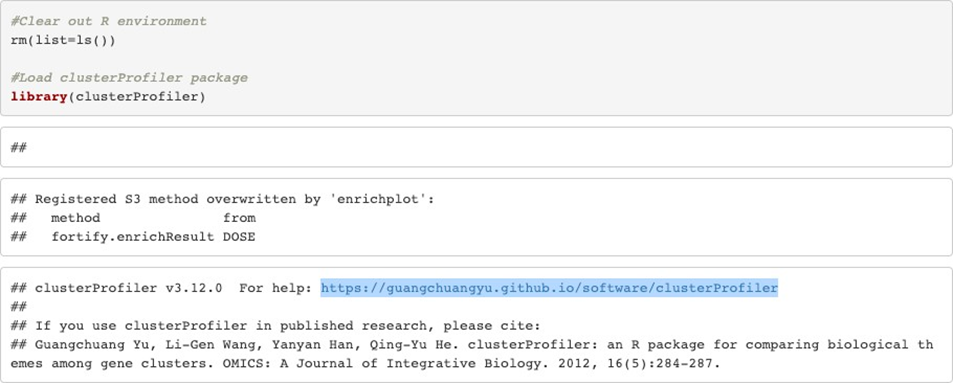
clusterProfiler has been developed by Guangchuang Yu. Information can be found at https://guangchuangyu.github.io/software/clusterProfiler/ and clusterProfiler is available from Bioconductor: https://bioconductor.org/packages/release/bioc/html/clusterProfiler.html
The following protocol describes how to run a functional enrichment analysis for one list of genes (one experimental condition) and for 2 lists of genes (2 experimental conditions - the same method applies when carrying out functional enrichment for more than 2 experimental conditions).
1. Set up R environment
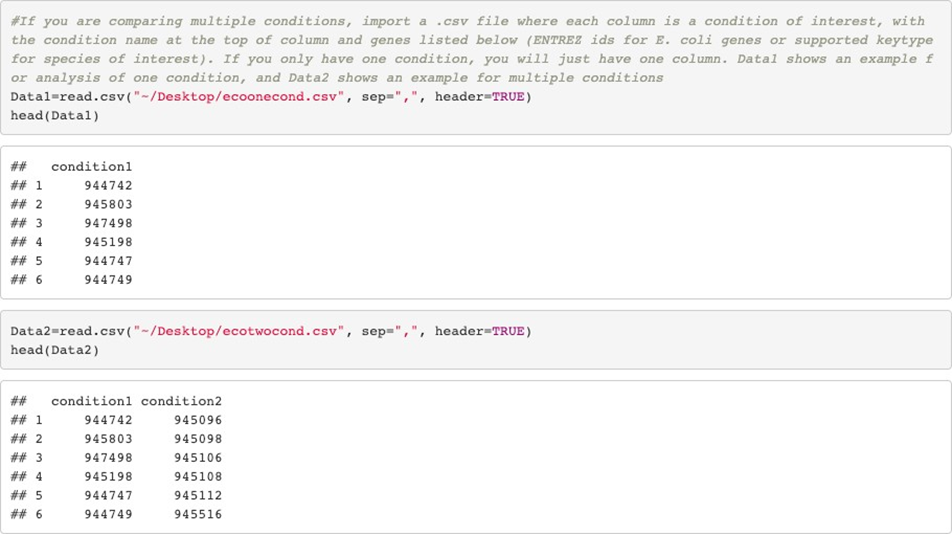
2. Import your data
Data can be imported as a dataframe from a .csv file.
Each column represents one experimental condition and contains the geneIDs of the investigated genes. Different geneIDs keytypes can be used depending on the studied organism. For E. coli, we used the keytype: ENTREZ ID.
Data1 is the example for the 1-condition analysis Data2 is the example for the 2-condition analysis
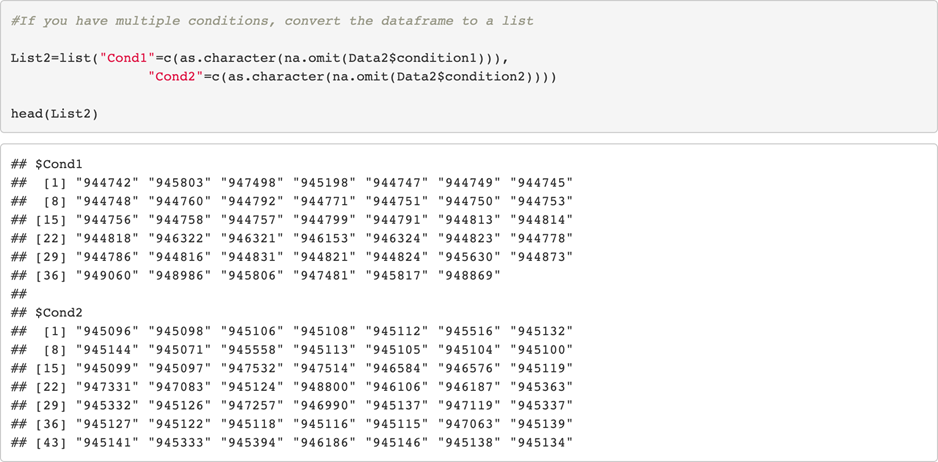
3. Formatting data when analyzing multiple conditions
If you are running more than one condition, you need to create a list containing all the conditions to be analyzed. That list is then used as an input for the enrichment analysis.
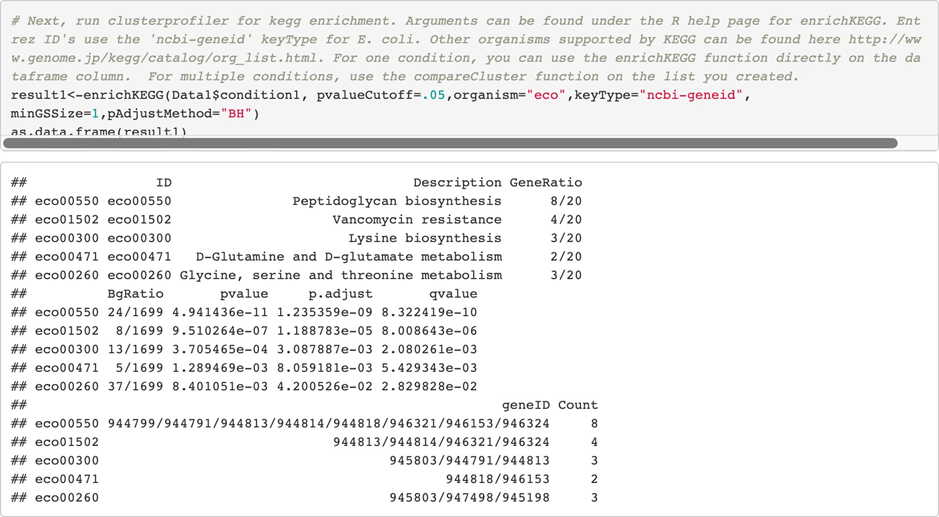
4. Functional enrichment analysis
For 1-condition analysis, you can directly run the enrichKEGG function on the Data1 dataframe. For multiple conditions, you have to use the function compareCluster and the list of conditions. Description of the functions’ arguments can be found in the help section.
Note1: for the enrichKEGG function, ENTREZ ID keyType code is “ncbi-geneid”
Note2: the E. coli annotations used for KEGG functional enrichment are the ones found in KEGG under organism=“eco”
Note3: you can visualize and eventually export/save the enrichment output by transforming the enrichment output into a dataframe.
1. condition analysis:
2. condition analysis:
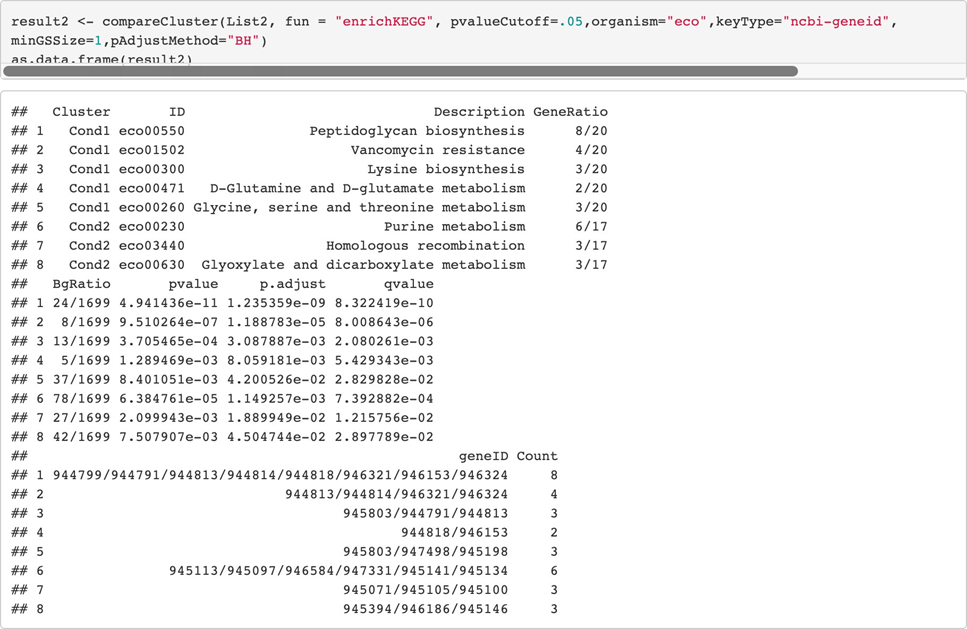

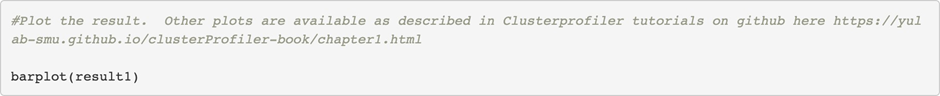
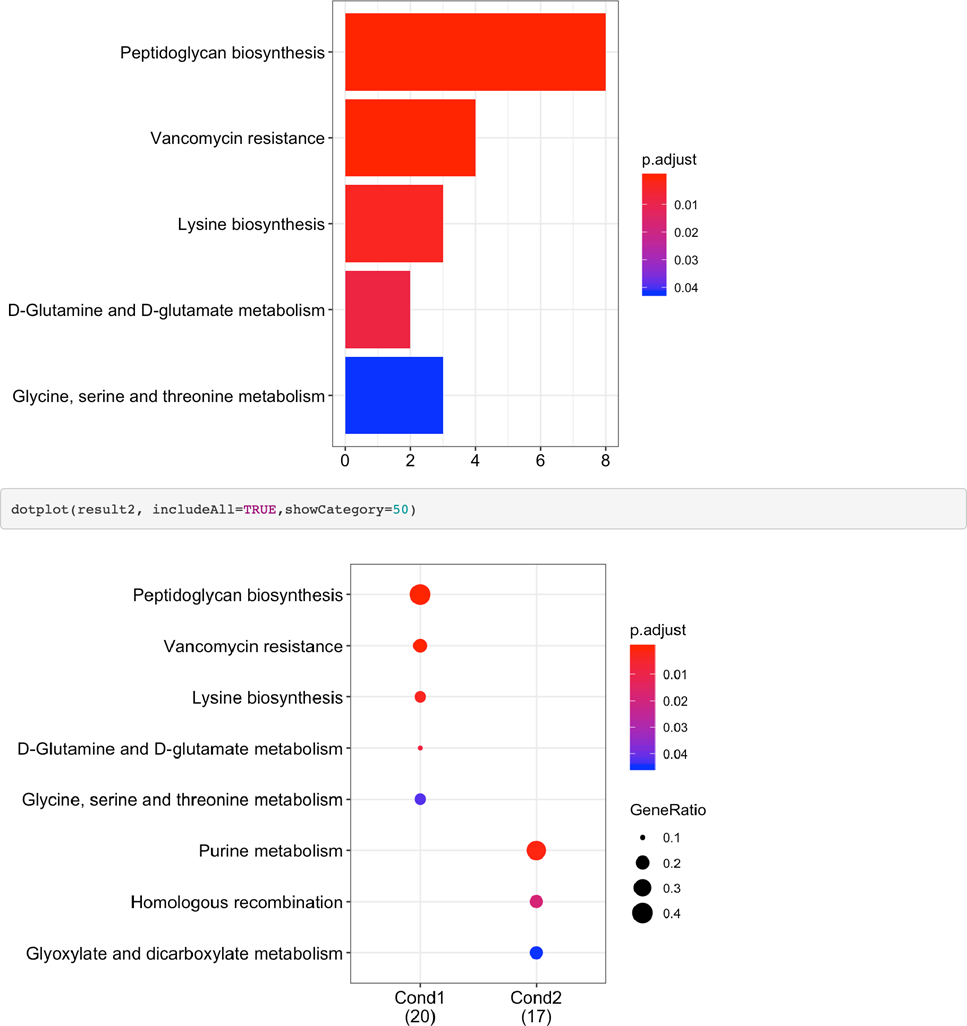
5. Plotting the results
clusterProfiler offers different possibilities to plot the functional enrichment output. Information can be found on clusterProfiler github page
Here we show an example of the barplot and dotplot representations
1 Yu G, Wang LG, Han Y, He QY. 2012. clusterProfiler: an R package for comparing biological themes among gene clusters. OMICS: A Journal of Integrative Biology 16:284–287. DOI: https://doi.org/10.1089/omi.2011.0118, PMID: 22455463
- Morin, M, Pierce, E C and Dutton, R(2020). KEGG pathway enrichment analysis using clusterProfiler. Bio-protocol Preprint. bio-protocol.org/prep431.
- Morin, M., Pierce, E. C. and Dutton, R. J.(2018). Changes in the genetic requirements for microbial interactions with increasing community complexity. eLife. DOI: 10.7554/eLife.37072
Do you have any questions about this protocol?
Post your question to gather feedback from the community. We will also invite the authors of this article to respond.