
- Home
- Protocols

-

Single-cell intracellular Ca2+ microfluorimetry
Last updated date: Aug 1, 2020 Views: 1172 Forks: 0
2.2.5 Analysis of CaSR Activation in HEK293 cells
CaSR activation was estimated using fura-2 fluorescence for the detection of intracellular Ca2+ mobilization. In cells loaded with the Ca2+-sensitive fluorescent dye fura-2 changes in cytosolic free Ca2 concentrations were monitored using a fluorescence microscope apparatus.
2.2.5.1 Preparation of Cells
The coverslips (15mm radius) were sterilised using 100% ethanol and transferred into a 24 well plate, before being air dried for 20 min in a laminar flow cabinet.
HEK293 cells were subcultured and resuspended in 2 mL DMEM from a 25 cm2 flask. 30 µL of cells was placed on the centre of each coverslip in each 24 well plate and incubated at 37 °C for approximately 1 h for cell adherence. 0.5 mL of fresh DMEM (10% FBS) was then added gently. Stably expressing cells were then cultured for 2 – 3 days prior to the experiment. For transient transfection, cells on the coverslip were transfected using either Lipofectamine 2000 or X-tremeGENE HP 24 h after culture and assayed after a further 48 – 72 hours.
2.2.5.3 Fluorescence Apparatus
Fura-2 loaded cells were transferred into a closed bath imaging chamber (volume 70 µL), which was sealed with a coverslip using vacuum grease. The sealed perfusion chamber was continuously perfused with BSA-free physiological saline solution.
The perfusion solution was introduced to the chamber by means of a peristaltic pump (Gilson Minipuls 2). Temperature was controlled by the heat exchange system shown in Figure 2.3.
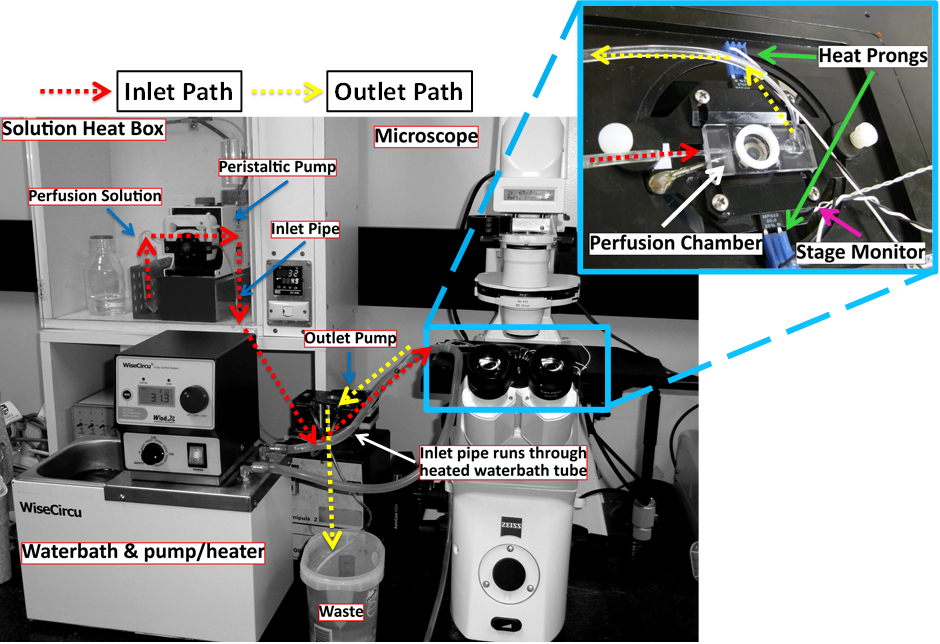
Figure 2.3: Heat Exchange System.
This figure demonstrates the generally used Heat Exchange System for the fura-2 intracellular Ca2+ mobilization experiments. Red arrows demonstrate the direction of fluid flow before entering the chamber, while yellow arrows indicate the path taken once leaving the chamber.
Solutions were generally heated to 37 °C in a custom-made heating box, with the inlet pipe running through a tube containing water heated/cooled by a circulating water bath. In addition, when tight regulation of temperature was required, the temperature of the microscope stage was controlled by the Warner TC-344B Dual Channel Heater Controller. Using this system the temperature of the perfusion solution reaching the chamber was generally modified by adjusting the temperature of the water bath and/or the stage.
With a perfusion rate of 1.0 mL/min, a delay of approximately 1.5 min was measured in the perfusion system due to dead space in the tubing. Fluorescence recordings were adjusted for the delay.
The perfusion chamber, once loaded with cells and sealed, was positioned on the stage of a Zeiss Axiovert 200M inverted fluorescence microscope adapted for fluorescence studies. To prevent interference from stray light, all experiments were performed in a darkened room.
2.2.5.2 Fura-2 AM Loading
Fura-2 AM is a cell permeable fluorescent probe for Ca2+ used to determine cystolic Ca2+, which is metabolised by intracellular esterases to release the active ligand fura-2, which is trapped intracellularly.
Cells derived from HEK293 cells were loaded with 5 µM of fura-2 AM in loading solution, made up of physiological saline solution (PSS; 125 nM NaCl, 4 mM KCl, 20 mM HEPES free acid, 0.1% (w/v) D-glucose, 1 mM MgCl2, pH 7.45), with the addition of 0.8 mM NaH2PO4, 1 mg/mL BSA and 1.0 mM CaCl2. Once cells had been incubated for 1.5 – 2 h at 37 °C in the dark, the fura-2 containing solution was removed. Cells were then washed to remove any remaining extracellular fura-2 and then stored in loading solution prior to experiments.
2.2.5.4 Detection of Changes in Intracellular Ca2+ Concentration
Fura-2 loaded cells were illuminated with a 175W CeraLux Xenon Lamp (Luxtel; Danves, MA, USA) housed within the Sutter DG-4 light box. Specific filters were used to selectively transmit light of the required wavelengths, 340 nm and 380 nm. The motorised filter switching mechanism controlled by Stallion (Intelligent Imaging Innovations, Denver, CO, USA) changed the angle of the input and output scanning mirrors (Figure 2.4) allowing flipping between the excitation wavelengths of 340 nm and 380 nm at 500 ms intervals.
Light was transferred from the Sutter DG-4 to the microscope via the light guide optical fibre cable. A dichroic mirror (cut off 395 nm) in the reflector module (Figure 2.5, 14) reflected the excitation light onto the cells in the perfusion chamber. Wavelengths above the cut-off passed through the dichroic mirror. (Figure 2.5, inset)
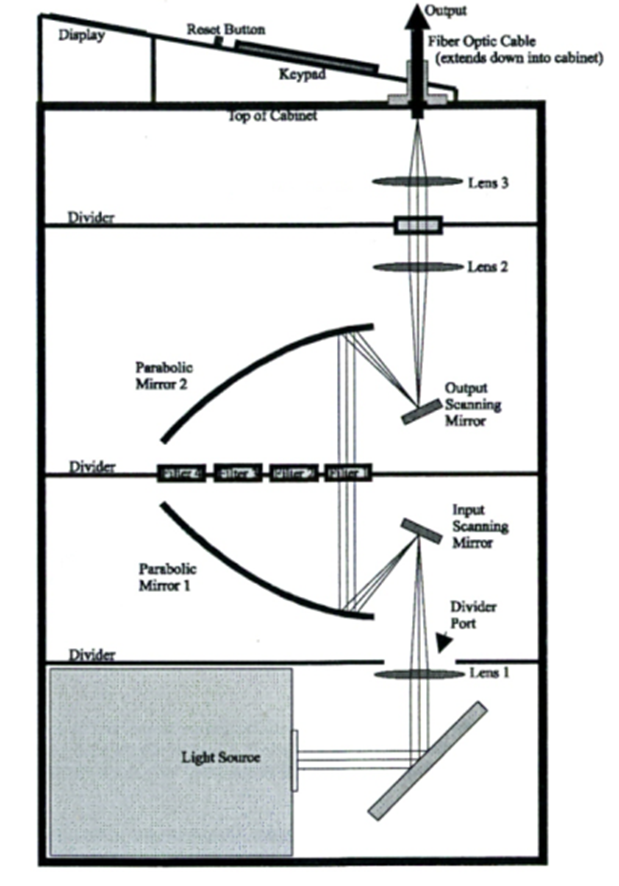
Figure 2.4: Lambda DG-4 Optical Pathway.
Adapted from the Lambda DG-4 High Speed Filter Changer manual.
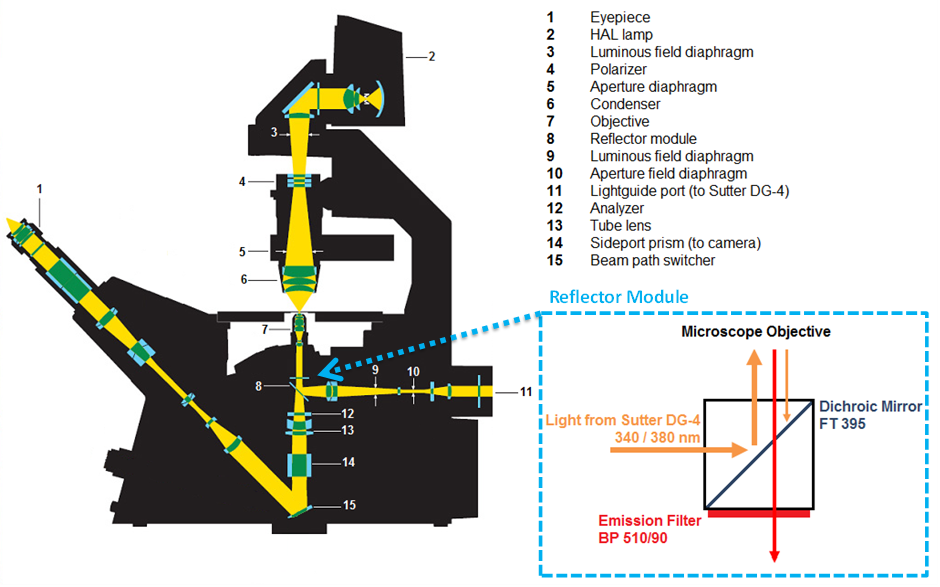
Figure 2.5: Light paths used in the Zeiss Axiovert 200 fura-2 experiments.
Adapted from http://www.zeiss.com.au. Inset; working principle of the reflector module.
Light emitted by fluorescent cells (peak 510 nm) was passed through the dichroic mirror, via the objective lens (63x Zeiss long-distance objective), and back through the dichroic mirror to the sideport optical prisms (Figure 2.5, 14). The emitted fluorescent light was then detected and collected by a Zeiss Axiocam HSm camera connected to the sideport.
For each dataset, regions of interest for ten individual cells were selected using Stallion software. With the emission wavelength set at 510 nm, a fura-2 excitation ratio (F340/F380) was used to detect changes in intracellular free Ca2+ concentration and was calculated and displayed by Stallion software. The fluorescence ratio was plotted with respect to experiment time using Deltagraph or GraphPad Prism software for each individual cell.
2.2.6 Statistical Analysis and Curve Fitting
Intracellular Ca2+ mobilization data for single cells were integrated to determine the approximate area under the curve for each individual Ca2+o concentration applied during a microscopy experiment. This integrated data was then divided by the time the agonist was applied for to give the Integrated Response Unit (IRU), before being normalised against the IRU for the control Ca2+o concentration (0.5 mM Ca2+o – unless otherwise specified). These integrated responses were then expressed as concentration-response curves and fitted using the following form of the Hill equation:
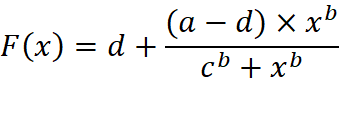
Where: a = maximal response, b = the hill co-efficient (a measure of co-operativity), c = EC50 (a measure of sensitivity) and d = the minimum response.
Estimates of the curve fitting parameters and their standard errors were obtained using GraphPad Prism 5.0. Statistical analyses on EC50 were performed using log EC50 values.
All data presented are expressed as means ± standard error of the mean (SEM; unless stated otherwise). Statistical analyses between data sets were performed using Student’s unpaired or paired t-tests (unless otherwise specified), one-way analysis of variance (ANOVA) with Dunnett’s/Tukey’s post-test or Kruskal-Wallis with Dunn’s post-test using GraphPad Prism 5.0 and p < 0.05 was used to assign statistical significance following convention. Analysis of covariance (ANCOVA) was used for comparisons of slopes generated by linear regression analysis.
Oscillation frequencies were determined by wavelet analysis in Mathematica 7.0. The program used to perform wavelet analysis is reproduced in Appendix B. Data are expressed as means ± SEM.
- Conigrave, A(2020). Single-cell intracellular Ca2+ microfluorimetry. Bio-protocol Preprint. bio-protocol.org/prep427.
- Geng, Y., Mosyak, L., Kurinov, I., Zuo, H., Sturchler, E., Cheng, T. C., Subramanyam, P., Brown, A. P., Brennan, S. C., Mun, H., Bush, M., Chen, Y., Nguyen, T. X., Cao, B., Chang, D. D., Quick, M., Conigrave, A. D., Colecraft, H. M., McDonald, P. and Fan, Q. R.(2016). Structural mechanism of ligand activation in human calcium-sensing receptor. eLife. DOI: 10.7554/eLife.13662
Category
Do you have any questions about this protocol?
Post your question to gather feedback from the community. We will also invite the authors of this article to respond.