
- Home
- Protocols

-

ATPase assay
Last updated date: Jul 30, 2020 Views: 1478 Forks: 0
This protocol relates to ATPase activity measurements presented in Wang et al. 2020. It is based on an NADH-coupled ATPase assay (Scharschmidt et al., 1979).
Reagents
Purified bMRP1
1 M Tris-HCl, pH 8.0
2 M KCl
Dithiothreitol (DTT)
0.075 % (w/v) digitonin. Solubilised stirring 12 hours at 4 ⁰C, and filtered with a 0.22 µm filter.
50 mM NADH
Phosphoenolypyruvate
10 mg/ml Pyruvate Kinase (Roche)
5 mg/ml Lactate Dehydrogenase (Roche)
10x ATP-Mg2+ stocks, pH 8.0 (with KOH) at 0.5, 1, 2.5, 5, 10, 20, 40, and 60 mM.
bMRP1 activity measurement
Prepare reaction buffer containing 50 mM Tris-HCl, pH 8.0, 150 mM KCl, 2 mM MgCl2, 2 mM DTT, 0.06 % (w/v) digitonin, 60 µg/ml pyruvate kinase (Roche), 32 µg/ml lactate dehydrogenase (Roche), 9 mM phosphoenolpyruvate, and 150 µM NADH.
Dilute bMRP1 to 800 nM in reaction buffer. Keep bMRP1 at 4 ⁰C until initiating the reaction.
In parallel, prepare a buffer control without bMRP1.
For substrate stimulation experiments add 10 µM LTC4 to the reaction mix and incubate 15 min at 4 ⁰C.
Aliquot 27 ul of reaction buffer with or without bMRP1 into wells of a Corning 384-well Black/Clear Flat Bottom Polystyrene NBS Microplate.
Add 3 ul ATP-Mg2+ from 10x ATP- Mg2+ stocks to initiate the reactions.
Follow NADH consumption at 30 ⁰C by monitoring fluorescence with an Infinite M1000 microplate reader (Tecan). Fluorescence is measured at λex = 340 nm and λem = 445 nm at 30 s intervals for 45 min (Figure A).
NADH standards
Prepare solutions of NADH in reaction buffer at 0, 25, 50, 75, 100, 125, 150, 175, and 200 µM.
Aliquot 30 µl of each into a Corning 384-well Black/Clear Flat Bottom Polystyrene NBS Microplate.
Measure fluorescence at λex = 340 nm and λem = 445 nm at 30 ⁰C with the Infinite M1000 microplate reader (Tecan).
Obtain a standard curve for NADH by plotting fluorescence as a function of NADH concentration (Figure B).
ATPase activity
Determine the slope of the fluorescence decay in the linear range of NADH consumption. Correct for background NADH oxidation using the rate of decay in the sample without bMRP1.
Convert the fluorescence slope to the rate of NADH oxidation using the NADH standard curve.
Correct for bMRP1 concentration to calculate the rate of ATP turnover per molecule of bMRP1 (Figure C).
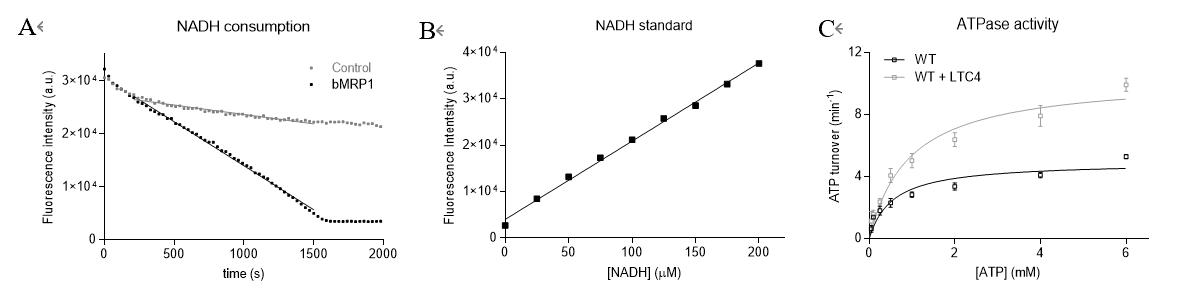
A. NADH consumption over time in samples with or without bMRP1. Regression is performed in the linear range of NADH consumption.
B. NADH standard curve.
C. Sample ATPase activity measurements of wild-type bMRP1 with or without 10 µM LTC4.
Scharschmidt BF, Keeffe EB, Blankenship NM, Ockner RK. Validation of a recording spectrophotometric method for measurement of membrane-associated mg- and NaK-ATPase activity. The Journal of Laboratory and Clinical Medicine 93: 790–799 (1979)
Wang L, Johnson ZL, Wasserman MR, Levring J, Chen J, Liu S. Characterization of the kinetic cycle of an ABC transporter by single-molecule and cryo-EM analyses. eLife 2020;9:e56451 (2020)
- Levring, J and Wang, L(2020). ATPase assay. Bio-protocol Preprint. bio-protocol.org/prep424.
- Wang, L., Johnson, Z. L., Wasserman, M. R., Levring, J., Chen, J. and Liu, S.(2020). Characterization of the kinetic cycle of an ABC transporter by single-molecule and cryo-EM analyses. eLife. DOI: 10.7554/eLife.56451
Do you have any questions about this protocol?
Post your question to gather feedback from the community. We will also invite the authors of this article to respond.