
- Home
- Protocols

-

Mitochondrial membrane potential measurements
Last updated date: Jun 9, 2020 Views: 1217 Forks: 0
Measurements of Mitochondrial Membrane Potential using TMRM in MEFs and Rat Neonatal Ventricular Myocytes.
Mitochondrial membrane potential is estimated by measuring the extent by which it diminishes on application of an uncoupler (FCCP), which completely collapses MMP. The measure of MMP is obtained using the MMP indicator TMRM. This dye accumulates in active mitochondria with intact membrane potentials and leaks out of the mitochondria as the MMP decreases.
Preparation of the cells:
Seed approximately 3x10⁶ cells on 24 mm round coverslips, accommodated into 6 well plates, and cover with 2ml of appropriate culture medium.
Grow cells for 24-48 hours in incubator at 37 °C and 5% CO2.
For pre-treatment with PDEs inhibitors: incubate cells within the wells with Bay 60-7550 1mM (dissolved in DMSO), or Cilostamide 10 mM or equivalent volume of DMSO (negative control) for 24 hours at 37°C.
The day of the imaging: load the cells with TMRM 50nM (Invitrogen) in cell medium and incubate for 30 minutes in cell incubator at 37°C.
Wash the cells twice with 1x PBS.
Mount each coverslip on an imaging chamber and cover cells with saline solution or 1x PBS.
Imaging:
Microscope settings: Program: Metafluor 7.5
Objective: PlanApoN, 60X, NA1.42 oil immersion, 0.17/FN 26.5
Light source: white LED (OptoLED, CAIRN research), driven by an OptoLED power supply.
Filter set: Excitation: 559±17 nm; emission: 630±35 nm; dichroic mirror: 585 nm LP.
Exposure time: 20 milliseconds
10 seconds acquisition interval
1392 x 1040 pixel image
Take a number of images of different fields, each one containing several cells; TMRM-loaded mitochondria appear bright fluorescent. This step is useful in order to generate a larger set of data and can be done because MMP values do not change significantly amongst cells of the same group and experimental condition.
Choose another field and start a time course experiment; draw an ROI around each single cell, and one in the background, as in Figure 1.
Record baseline fluorescence for about 10 minutes, making sure it stays stable.
Apply gently FCCP 1mM (final concentration in the total volume of the chamber) onto the cells with a micro pipette, making sure not to touch the chamber.
Fluorescence will start decreasing almost immediately; keep recording fluorescence until it reaches a value of almost zero and the mitochondria have become dark, due to TMRM leaking out of the organelles. This should take about 15-20 minutes, depending on how fast the mitochondria release the dye.
At this point stop the time course and take again a number of images of different fields of view, in order to increase the number of cells for analysis. This time, mitochondria will appear dark or very faint.
Extract fluorescence values of all cells from Metafluor (or any imaging program you are using) and paste numbers into an Excel file.
Subtract the background fluorescence value from the fluorescent values detected for each ROI during the time course.
Obtain the percent decrease of fluorescence by calculating the difference between the mean fluorescence value before and after application of FCCP.
Proceed with the same calculation using the single images. Data can then be pulled together.
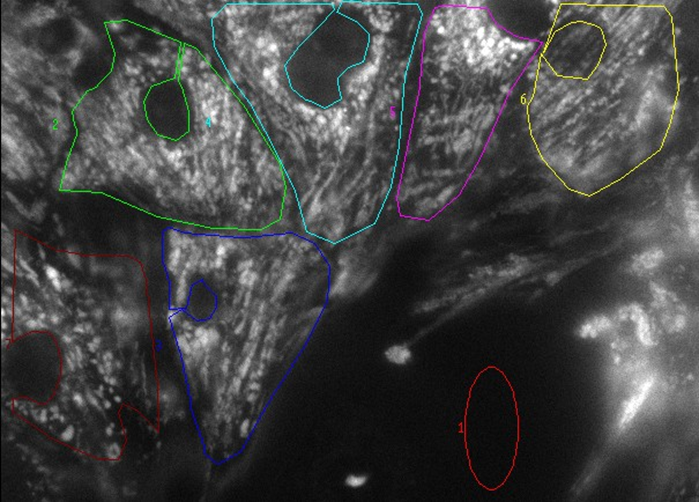
Figure 1. Example of RNVM loaded with TMRM. Red ROI is background.
- Monterisi, S and Zaccolo, M(2020). Mitochondrial membrane potential measurements. Bio-protocol Preprint. bio-protocol.org/prep337.
- Monterisi, S., Lobo, M. J., Livie, C., Castle, J. C., Weinberger, M., Baillie, G., Surdo, N. C., Musheshe, N., Stangherlin, A., Gottlieb, E., Maizels, R., Bortolozzi, M., Micaroni, M. and Zaccolo, M.(2017). PDE2A2 regulates mitochondria morphology and apoptotic cell death via local modulation of cAMP/PKA signalling. eLife. DOI: 10.7554/eLife.21374
Category
Do you have any questions about this protocol?
Post your question to gather feedback from the community. We will also invite the authors of this article to respond.