Advanced Search
Integration site mapping by high-throughput sequencing of Tol2-oligo pulldown-enriched fragments
Last updated date: May 11, 2020 Views: 1362 Forks: 0
Integration site mapping by high-throughput sequencing of Tol2-oligo pulldown-enriched fragments
Ashwin A. Bhandiwad1, Tianwei Li2, James R. Iben2, Steven L. Coon2, Harold A. Burgess1
1Division of Developmental Biology, Eunice Kennedy Shriver National Institute of Child Health and Human Development, Bethesda, MD, 20892
2Molecular Genomics Core, Eunice Kennedy Shriver National Institute of Child Health and Human Development, Bethesda, MD, 20892
Abstract
Here we present a pulldown method and pooling strategy to map transgene insertions generated with Tol2 retrotransposons. The pulldown method alone works well for individual zebrafish lines, but library preparation quickly becomes a limiting factor. To solve this, we implemented a multiplexing strategy that allows efficient reductions in labor and cost when mapping multiple lines. Although this procedure is optimized for interrogating Tol2 inserts we anticipate that a similar strategy will work for any insert given suitable pulldown probes.
Keywords:integration mapping, enhancer trap, transgenic, tol2, zebrafish
Materials and reagents
Qiagen DNeasy Blood and Tissue kit (Cat. No. 69504)
Covaris S2 system for shearing gDNA
Roche SeqCap EZ Library SR User’s Guide (v5.4) along with reagents recommended therein
Tol2 pull-down oligo 1 (biotinylated IDT xGEN Lockdown Probe): 5-CTCAAGTGAAAGTACAAGTACTTAGGGAAAATTTTACTCAATTAAAAGTAAAAGTATCTGGCTAGAATCTTACTTGAGTAAAAGTAAAAAAGTACTCCATTAAAATTGTACTTGAGTATT
Tol2 pull-down oligo 2 (biotinylated IDT xGen Lockdown Probe): 5-TGTAATTAAGTAAAAGTAAAAGTATTGATTTTTAATTGTACTCAAGTAAAGTAAAAATCCCCAAAAATAATACTTAAGTACAGTAATCAAGTAAAATTACTCAAGTACTTTACACCTCTG
Procedure
Extract high molecular weight DNA using Qiagen DNeasy Blood and Tissue Kit.
Clip fins from an adult transgenic zebrafish and place fins into 100% ethanol on ice. Remove ethanol and let evaporate for 5-10 min.
Extract genomic DNA as per manufacturer’s protocol, eluting with 100 µl Buffer AE.
Using a wide-mouth pipet tip, repeat elution with flow-through.
Expected yield is around 5-10 μg of gDNA.
Combine equal amounts of gDNA from different fish lines into pools so that each line appears in a unique combination of pools. For each pool of 10 fish, use 100 ng gDNA per line for a total of 1000 ng for each pool (Table 1).
DNA shearing and library preparation
Shear pooled DNA using Covaris focused-ultrasonicator
We used a Covaris S2, with the onboard DNA200 settings (microTUBE AFA Fiber Snap-Cap, 130 µl sample volume, Intensity 5, Duty Cycle 10%, Cycles per Burst 200, Treatment Time 180 sec)
Construct a library from each pool using the Roche SeqCap EZ Library SR User’s Guide (formerly the Nimblegen EZ-Cap whole exome library kit). Each of the 10 libraries is constructed with a different index barcode from the kit.
Enrich for fragments containing the Tol2 sequence using the SeqCap EZ Hybridization Kit following the manufacturer’s protocol but replacing the exome-hybridizing oligos with our custom biotinylated oligos (Tol2 pull-down oligo 1 and 2).
Each instance of pulldown uses 400 attomoles of each probe.
We combined three or four pools of 10 lines for each pulldown reaction to minimize reagent use and sequencing costs.
Post-capture PCR amplification and purification was performed as described in the Roche SeqCap User’s Guide to generate libraries for sequencing.
Sequencing and data analysis
Combine all pools together and sequence with Illumina MiSeq using v2 chemistry yielding about 15 million 250-bp paired-end reads (about 1.5 million reads for each of the 10 pools).
Process sequence Bioinformatics
Trim adapter sequence
Map sequence to zebrafish reference genome (danRer11) using BWA
Select regions with read depth greater than 25 with mapping quality greater than 20.
Regions present in more than two pools excluded as non-specific, likely off-target sequences (Supplemental File 2)
Assign regions present in one or two pools to zebrafish lines based the pooling matrix. For example, a region found only in pools 2 and 6 would be from line #23 (Table 1).
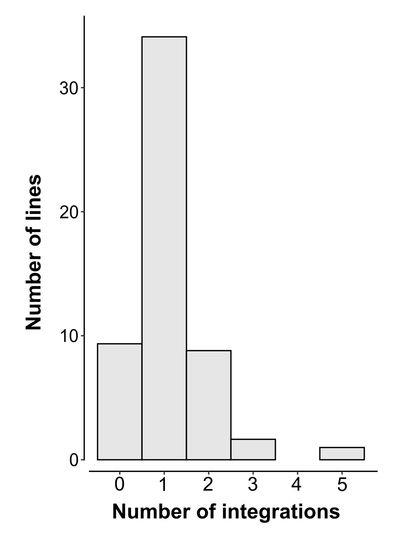
Lines that show more than one possible integration location (Figure 1) need to be disambiguated using genomic PCR.
Lines that fail to show integrations are assumed to be integrated into low-complexity regions. It is possible to resolve these by pulling down larger genomic fragments and sequencing using long read methods.
Table 1. Example of combinatorial pooling strategy for genomic DNA samples.
Here we formed 10 pools from 55 lines, with 10 lines represented in each pool. Each line is only present in 1 or 2 pools, and no two lines are in the same 2 pools.
See Supplemental File 1 for pooling strategies for other numbers of lines.
Figure 1: Histogram of number of integration locations for 55 lines identified using this pulldown protocol

Supplemental File 1: Combinatorial Matrices for other numbers of fish lines.
Supplemental File 2: Common off-target and unknown sequences obtained by pull-down protocol
Related files
 Supplemental 1.xlsx
  Supplemental 2.txt
 - Bhandiwad, A A, Li, T, Iben, J R, Coon, S L and Burgess, H A(2020). Integration site mapping by high-throughput sequencing of Tol2-oligo pulldown-enriched fragments. Bio-protocol Preprint. bio-protocol.org/prep311.
- Tabor, K. M., Marquart, G. D., Hurt, C., Smith, T. S., Geoca, A. K., Bhandiwad, A. A., Subedi, A., Sinclair, J. L., Rose, H. M., Polys, N. F. and Burgess, H. A.(2019). Brain-wide cellular resolution imaging of Cre transgenic zebrafish lines for functional circuit-mapping. eLife. DOI: 10.7554/eLife.42687
Do you have any questions about this protocol?
Post your question to gather feedback from the community. We will also invite the authors of this article to respond.
Share
Bluesky
X
Copy link
