
- Home
- Protocols

-

Isolation and proteomic analysis of mortalin interactome
Last updated date: May 6, 2020 Views: 973 Forks: 0
Isolation and proteomic analysis of mortalin interactome
Pui-Kei Wu, Rebekah L. Gundry, Jong-In Park
Co-immunoprecipitation and SDS-PAGE
1. Before harvesting, wash cells with 5 ml ice-cold PBS once. Add 5 ml ice-cold PBS to the dish and detach cells by cell scrapper. Collect cell pellet by centrifugation at 1000 xg for 5 min in 4oC in a 15 ml conical tube.
2. Remove PBS, add 1 ml ice-cold PBS and transfer cell suspension to a 1.5 ml tube. Centrifuge at 1000 xg for 5 min in 4oC.
3. Remove PBS and add 1 ml ice-cold lysis buffer. Pipette up and down for 10 times to disperse the cell pellet without foaming. Incubate on ice for 20 min. Centrifuge at 1000 xg for 10 min in 4oC.
4. Save the supernatant and measure protein concentration by BCA assay.
5. During BCA assay, prepare 50 ml anti-HA-agarose (Thermo Fisher Scientific #26181) and wash with 250 ml (5 volume) of ice-cold PBS for 2 times, centrifuge at 5000 xg for 1 min.
6. Add 1 mg of protein lysate to anti-HA-agarose. Tumble at 4oC for 4 h. (See footnote 1)
7. Wash beads with 1000 ml (20 volume) of ice-cold high salt wash buffer for 3 times.
8. Wash beads with 1000 ml (20 volume) of low salt wash buffer for 3 times.
9. At last wash, use loading tip to remove residue buffer at the bottom without removing the beads.
10. Elute immunoprecipitated protein by adding 200 ml Laemmli sample buffer, vortex and boil at 95oC for 5 min.
11. Separate protein samples (30 ml) by 4-20% gradient SDS-PAGE and stain the gel using silver staining.
In-gel digestion
1. Silver-stain gel bands of interest were excised, divided, and placed in separate microcentrifuge tubes. As shown in Figure 1. (See footnote 2)
2. Gel pieces were suspended in 1 mL water then vortexed (Thermomixer) (all vortexing steps were at 1200 rpm) for 10 min.
3. The water was discarded and 1 mL destain solution was added to the bands then vortexed for 15 min.
4. The destain solution was discarded and gel pieces were resuspended in 1 mL water then vortexed for 10 min.
5. The water wash was repeated twice more until yellow color was gone from the bands.
6. The bands were suspended in 50 mM ammonium bicarbonate then vortexed for 10 min.
7. Gel band proteins were reduced by the addition of 350 µL of 10 mM dithiothreitol in 50 mM ammonium bicarbonate and vortexed at 37°C for 30 min.
8. Supernatant was discarded and 350 µL 55 mM iodoacetamide in 50 mM ammonium bicarbonate was added.
9. Tubes were incubated in the dark with vortexing at 37°C for 45 min.
10. Supernatant was discarded and gel pieces were washed with 1 mL 50 mM ammonium bicarbonate and vortexed at 1200 rpm for 10 min prior to suspension in 1 mL of 50 mM ammonium bicarbonate in 50 % acetonitrile (ACN)/50 % water then vortexed for 10 min.
11. This wash was repeated once. Gel pieces were dried under vacuum.
12. 1 µg of sequencing grade trypsin (Promega) in 50 mM ammonium bicarbonate was added to the gel pieces in sufficient volume of 50 mM ammonium bicarbonate to cover the pieces.
13. Gel bands were incubated overnight at 37°C with vortexing. Peptides were extracted from the gel pieces by addition of 200 µL 0.1% trifluoroacetic acid (TFA) in water and vortexing for 20 min.
14. The peptide solution was transferred to a clean microcentrifuge tube and the extraction was repeated with 200 µL 0.1 % TFA in 70 % ACN.
15. The liquid was combined with the previous extraction and the extraction was repeated with 200 µL 0.1 % TFA in 90 % ACN. The last extraction liquid was combined with the previous two, and the final extract was dried under vacuum.
Mass spectrometry analysis
1. Dried peptides were dissolved in 7 µL 2 % ACN, 98 % water, 0.1 % formic acid.
2. Peptides were analyzed using an Eksigent nanoLC in line with an LTQ Orbitrap Velos (Thermo Fisher Scientific).
3. Two technical replicate injections of 2 µL in succession were performed using instrument settings outlined in the table below.
4. MS data were analyzed using Proteome Discoverer 2.2 (Thermo Fisher Scientific) according to details in table S1 published in the affiliated Science Signaling paper.
5. All files for separate bands from a single lane (i.e. the same sample) were searched together to produce a single output for each lane. (See footnote 3). All .RAW files are deposited on Massive (https://massive.ucsd.edu/).
Reagents
Lysis buffer: 50 mM Tris-HCl, pH 7.5, 150 mM NaCl, 1 mM EDTA, 1 % NP-40, 1 % protease inhibitor cocktail (Sigma P8340), 1 % phosphatase inhibitor cocktail 2 (Sigma P5726), 1 % phosphatase inhibitor cocktail 3 (Sigma P0044)
High salt wash buffer: 50 mM Tris, pH 7.5, 1 M NaCl, 1 mM EDTA, 0.5 % NP-40
Low salt wash buffer: 50 mM Tris, pH 7.5, 60 mM NaCl, 1 mM EDTA, 0.5 % NP-40
Destain solution: aqueous 50 mM sodium thiosulfate, 15 mM potassium ferricyanide
Footnote
1. “No antibody” or IgG antibody negative control was not used.
2. The whole lane of resolving gel, except the band of abundant IgG light chain at 26 kDa, was extracted for MS analysis.
3. The data were documented in data file S1 which can be downloaded from Science Signaling website.
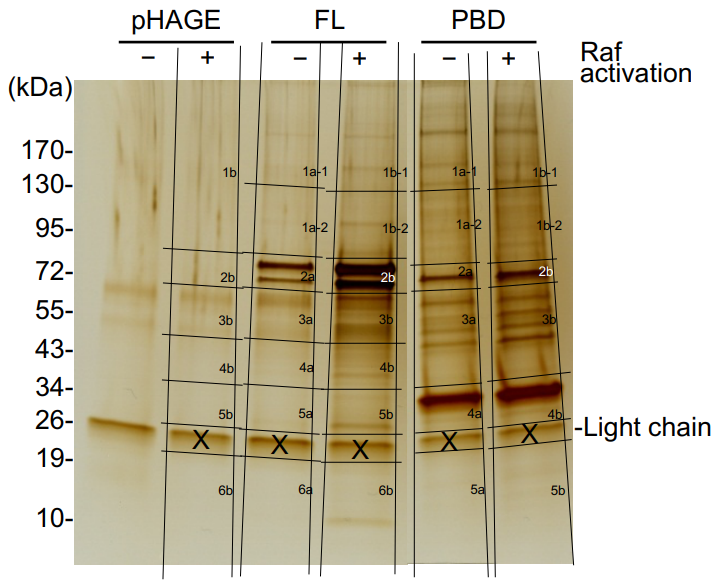
Figure 1. Silver-stained SDS-PAGE showing band area excised for mass spectrometry analysis.
Related files
 Bio-protocol Fig1.pdf
 - Wu, P, Gundry, R L and Park, J(2020). Isolation and proteomic analysis of mortalin interactome. Bio-protocol Preprint. bio-protocol.org/prep302.
- Wu, P., Hong, S., Chen, W., Becker, A. E., Gundry, R. L., Lin, C., Shao, H., Gestwicki, J. E. and Park, J.(2020). Mortalin (HSPA9) facilitates BRAF-mutant tumor cell survival by suppressing ANT3-mediated mitochondrial membrane permeability . Science Signaling 13(622). DOI: 10.1126/scisignal.aay1478
Category
Do you have any questions about this protocol?
Post your question to gather feedback from the community. We will also invite the authors of this article to respond.