Advanced Search
Bioinformatic analysis of the ChIP-seq and CUT&RUN datasets
Last updated date: Apr 25, 2020 Views: 1551 Forks: 0
Bioinformatic analysis of the ChIP-seq and CUT&RUN datasets
Abstract
In this study, Cleavage Under Targets and Release Using Nuclease (CUT&RUN)1 was employed to identify genome wide CTCF binding through antibody-targeted controlled cleavage by micrococcal nuclease, which releases specific protein-DNA complexes into the supernatant for paired-end DNA sequencing. CUT&RUN was performed in situ and it generated the precise transcription factor genomic binding profiles without crosslinking and sonication. CUT&RUN produces extremely low backgrounds, thus requiring only ~1/10th the sequencing depth as regular ChIP-seq assay. In conclusion, in situ mapping of protein-DNA interactions by CUT&RUN is an attractive ChIP-seq method to analyze CTCF binding profile in human genome.
Materials and Reagents
1. DNA Low binding 1.5 ml tubes (Eppendorf, catalog number: 0030108051)
2. AMPure XP Beads (Beckmann Coultier, catalog number: A63381)
3. Protein G Dynabeads (Thermo Fisher Scientific, catalog number: 10003D)
4. BSA (Sigma-Aldrich, catalog number: A4737)
5. Proteinase K (Thermo Fisher Scientific, catalog number: E00491)
6. Anti CTCF antibody (Cell Signaling, catalog number: #2899)
7. Illumina’s TruSeq ChIP Sample Preparation Kit (Illumina, catalog number: Cat #IP-202-1012)
8. NEBNext High-Fidelity 2x PCR Master Mix (New England Biolabs, catalog number: M0541)
9. Glycogen (Roche, catalog number: 10901393001)
10. 37% Formaldehyde (Sigma-Aldrich, catalog number: F8775)
11. Bio-Mag Plus Concanavalin A coated beads (Polysciences, cat #86057)
12. Glycine (Sigma-Aldrich, catalog number: 50046)
13. Protease Inhibitor Cocktail (Bimake, catalog number: B14001)
14. Tris Buffer pH 8.0 (Applichem, catalog number: A4577)
15. EDTA (Sigma-Aldrich, EDS catalog number: EDS-500G)
16. Triton X-100 (Sigma-Aldrich, catalog number: T8787)
17. 20% sodium dodecyl sulfate (Sigma-Aldrich, catalog number: 05030)
18. Nuclease-free water (Qiagen, catalog number: 129115)
19. N,N-Dimethylformamide (Sigma-Aldrich, catalog number: D4551)
20. Qubit dsDNA High Sensitivity Kit (Thermo Fisher Scientific, catalog number: Q33230)
21. DNA High Sensitivity Kit for Bioanalyzer (Agilent, catalog number: 5067-4627)
22. Phenol-chloroform isoamylalcohol (Sigma-Aldrich, catalog number: P3803)
23. 3 M sodium acetate (Thermo Fisher Scientific, catalog number: AM9740)
24. MgCl2 (Sigma-Aldrich, catalog number: 63068)
25. Nuclear extraction buffer (see Recipes)
26. Binding buffer (see Recipes)
27. Wash buffer (see Recipes)
28. Blocking buffer (see Recipes)
29. 2 X RSTOP buffer (see Recipes)
Equipment
1. DiaMag 0.2 ml-magnetic rack (Diagenode, catalog number: B04000001)
2. DynaMag-2 magnetic rack (Thermo Fisher Scientific, catalog number: 12321D)
3. Bioruptor (Diagenode, catalog number: B01020001)
4. Bio-Rad PCR Cycler (Bio-Rad, catalog number: C1000)
5. Agilent Bioanalyzer 2100 (Agilent, catalog number: G2939BA)
6. Qubit Fluorometer (Thermo Fisher Scientific, catalog number: Q33216)
Recipes
1. Nuclear extraction buffer
HEPES-KOH pH 8.0 (20 mM)
KCl (10 mM)
Spermidine (0.5 mM)
Triton X-100 (0.1%)
Glycerol (20%)
Water
Protease Inhibitor Cocktails (Roche complete EDTA-free tablet), adding before use
2. Binding buffer
HEPES-KOH pH 8.0 (20mM)
KCl (10 mM)
CaCl2 (1 mM)
MnCl2 (1 mM)
Water
3. Wash buffer
HEPES pH 7.5 (20 mM)
NaCl (150 mM)
Spermidine (0.5 mM)
BSA (0.1 %)
Water
Protease Inhibitor Cocktails (Roche complete EDTA-free tablet), adding before use.
4. Blocking buffer
Wash buffer (above)
EDTA (2 mM)
5. 2 X RSTOP buffer
NaCl (200 mM)
EDTA (20 mM)
EGTA (4 mM)
Water
RNaseA (50 μg/ml)
Glycogen (40 μg/ml)
Heterologous DNA (10 pg/ml)
Software
1. MACS2 (version 2.2.7.1, https://github.com/taoliu/MACS)
2. Deeptools (version 3.1.3, https://deeptools.readthedocs.io/en/develop/)
3. Samtools (version 1.10, http://www.htslib.org/doc/samtools.html)
4. Bowtie2 (version 2.4.1, http://bowtie-bio.sourceforge.net/bowtie2/manual.shtml)
5. FastQC (version 0.11.9, https://www.bioinformatics.babraham.ac.uk/projects/fastqc/)
6. Cutadapt (version 2.9, https://cutadapt.readthedocs.io/en/stable/guide.html)
7. Homer (version 4.11, http://homer.ucsd.edu/homer/)
8. The Integrative Genomics Viewer (IGV) (version 2.8.2, https://software.broadinstitute.org/software/igv/)
Procedure
1). Cell lysis
Harvest 5 million cells .
Spin down with 600 g for 5 min at 4℃.
Resuspend cell pellet with 1 mL cold PBS by gently pipetting and transfer the solution to a 1.5
mL new Eppendorf tube.
Spin down with 600g for 5 min at 4℃ and decant.
Resuspend cell pellet in 1 mL nuclear extract buffer by gently pipetting.
Spin down with 600g for 5 min at 4℃ and decant.
Resuspend cell pellet in 500 μL nuclear extract buffer per 5 million mammalian cells.
2) Incubate with magnetic beads
Gently resuspend Bio-Mag Plus Concanavalin A coated beads with binding buffer.
Mix 200 μL beads slurry with 800 μL binding buffer in the 1.5 mL Eppendorf tube.
Place tubes on the magnet stand and wash twice in 1 mL binding buffer.
Resuspend beads in 300 μL binding buffer.
Gently vortex the nuclei, and slowly add the beads slurry.
Rotate 5-10 min at room temperature.
3) Block beads with blocking buffer
Place the mix on the magnet stand until clear (~20 s to 2 min) and remove the liquid.
Add 1 mL blocking buffer and mix it through gently pipetting.
Incubate 5 min at RT.
4) Pull down with primary antibody
Place mixture on the magnet stand and aspirate the buffer.
Add 1 mL wash buffer and invert mixture ~10 times.
Place mixture on the magnet stand and remove the buffer.
Resuspend in 250 μL wash buffer with gently pipetting or invert ~10 times.
Add 250 μL primary antibody in wash buffer with gently vortexing.
Incubate on rotator ≥ 2 hr at 4℃.
Quickly spin down and wash twice with wash buffer.
5) Incubate mixture with secondary antibody
Remove supernatant and resuspend it with 250 μL wash buffer.
Add 250 μL secondary antibody in wash buffer with gently vortexing.
Incubate mixture ≥1 hr on rotator at 4℃.
Quickly spin down and wash twice with wash buffer.
Resuspend in 250 μL wash buffer.
6) Incubate mixture with pA-MNase
Aspirate the liquid and resuspend each sample in 250 μL wash buffer.
Add 250 μL pA-MNase in wash buffer (final concentration of 1:1000).
Incubate the mixture ≥1 hr on rotator at 4℃.
Quickly spin down and wash twice with wash buffer.
7) Digestion
Aspirate liquid and resuspend in 150 μL wash buffer per sample.
Equilibrate it to 0℃ in the ice water or in metal blocks for Eppendorf tubes in ice water.
Add 3 μL 100 mM chilly CaCl2 per 150 μL with vortexing, then return it to ice water.
Stop it at the optimized time (10 min) with 150 μL 2 X RSTOP+ buffer.
8) Fractionation
Incubate mixture with RNaseA at 37 ℃ for 20 min.
Spin down with 16,000 g at 4℃ for 5 min, and then transfer supernatants to fresh tubes.
9) Chromatin DNA extraction
Add 3 μL 10% SDS (final 0.1%) and 2.5 μL Proteinase K (20 mg/ml) to each sample.
Mix it by inversion and incubate 10 min at 70℃.
Add 300 μL phenol-chloroform-isoamyl solution (25:24:1) and vortex.
Transfer supernatant to a phase-lock tube, and spin down for 5 min with full speed.
Add 300 μL chloroform and mix it through gently invert ~10 times.
Spin down and transfer supernatant to a fresh tube containing 2 μL of 2 mg/ml glycogen.
Add 750 μL 100% ethanol and mix by gently vortexing.
Put the tube on -20 freezer ≥1 hr, and then spin down for 30 min with full speed at 4℃.
Remove liquid and drain the tubes on a paper towel.
Wash the pellet with 80% ethanol, spin down briefly full speed.
Carefully aspirate the liquid and dry on a paper towel for 10-15 min.
Dissolve pellet in 25-50 μL TE buffer (10 mM Tris, 1 mM EDTA pH8.0).
10) Prepare DNA sequencing libraries
Optional: Quantify samples with Qubit and pool libraries according to Agilent Bioanalyzer.
ChIP-DNA libraries were performed using Illumina’s TruSeq ChIP Sample Preparation Kit
according to the manufacturer’s instructions.
The quality of ChIP DNA libraries was tested with Agilent Bioanalyzer.
Paired-end sequencing with 100 bp length was performed on the Illumina HiSeq 3000.
Data analysis
1. Perform sequence quality score report with FastQC program using fastq (or fastq.gz) files.
fastqc *.fastq.gz
2. Trim indexed adapters with Cutadapt program
cutadapt -a index sequence -o output.fastq.gz input.fastq.gz
3. Generate index for reference genomes using bowtie2 (download the fasta files from Ensemble database)
bowtie2-build -f $FASTA_PATH/hg19.fa $INDEX_PATH/bowtie2_index
4. Map and align the reads with reference genome hg19 assembly using bowtie2
bowtie2-x $INDEX_PATH/genome -p 24 -1 *R1.fastq.gz -2 *R2.fastq.gz | samtools view -bS > file.bam
5. Sort mapped reads with samtools program
Samtools sort file.bam > file.sorted.bam
6. Index sorted files were Indexed with samtools prgram
Samtools index file.bam file.bam.bai
7. Generate coverage files and visualize files using DeepTools
bamCoverage –b file.bam –normalizeUsing RPKM -o file.bw
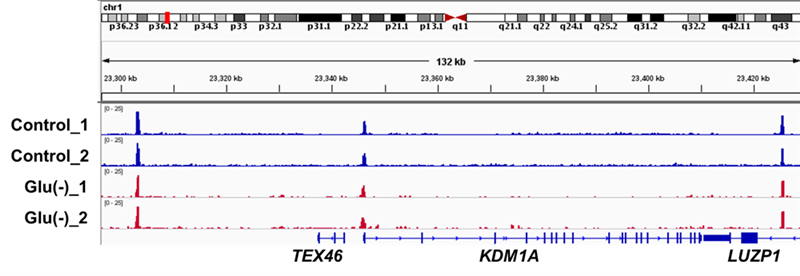
Note: A representative track example after generating coverage files is shown in Figure 1.
8. Perform peak calling with MACS2
Macs2 callpeak -t file.bam -c control.bam -g hs -n file.peaks -q 0.01 -B --extsize 200 --nomodel
9. Annotate peaks with annotatePeaks.pl program in Homer software
annotatePeaks.pl file.peaks.bed hg19 > files_peak_annotated_genes.txt
10. Perform differential Peaks calling with getDifferentialPeaks in Homer software
getDifferentialPeaks Glu(-)-peaks.txt Glu(-)-Tag-directory/ WT-Tag-directory/
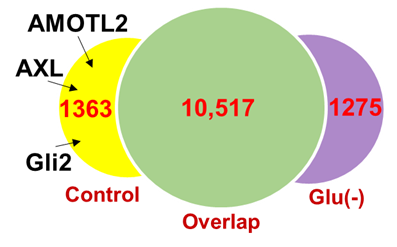
Note: A representative result is shown in Figure 2.
11. Analyze peaks motifs with findMotifsGenome.pl program in Homer software
findMotifsGenome.pl file.peaks.narrowPeak hg19 file.peaks-motifs/ -size 200 -mask
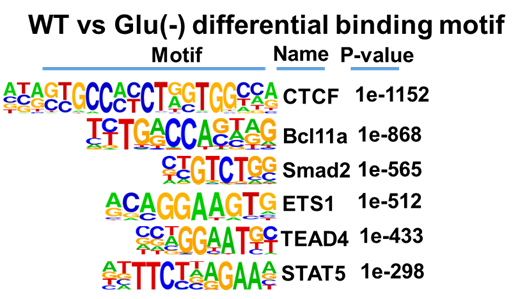
Note: A representative result is shown in Figure 3.
12. Visualize snapshot tracks with the Integrative Genomics Viewer (IGV) software
Representative figures
Figure 1. Genome browser track example of CTCF binding generated by the CUT&RUN approach. Snapshot to show the representative CTCF binding sites.

Figure 2. Analysis of CTCF binding peaks.
Differential peaks analysis of CTCF DNA-binding in MCF7 cells under normal (control) and glucose-free [Glu(-)] conditions. Under glucose starvation, 1,363 and 1,275 genomic sites showed decreased and increased CTCF binding (>2 fold), respectively. Representative YAP target genes are indicated (Arrow).

Figure 3. Motifs analysis of CTCF genomic binding peaks under control and stress conditions. Motif enrichment analysis of identified CTCF-binding peaks (from Figure 2A) with Homer software.

Reference
1 Skene, P. J. & Henikoff, S. An efficient targeted nuclease strategy for high-resolution mapping of DNA binding sites. Elife 6, doi:10.7554/eLife.21856 (2017).
Related files
 Bioinformatic analysis of ChIP-seq with CUT and RUN.pdf
 - Luo, H and Lu, J(2020). Bioinformatic analysis of the ChIP-seq and CUT&RUN datasets. Bio-protocol Preprint. bio-protocol.org/prep286.
- Luo, H., Yu, Q., Liu, Y., Tang, M., Liang, M., Zhang, D., Xiao, T. S., Wu, L., Tan, M., Ruan, Y., Bungert, J. and Lu, J.(2020). LATS kinase–mediated CTCF phosphorylation and selective loss of genomic binding. Science Advances 6(8). DOI: 10.1126/sciadv.aaw4651
Category
Do you have any questions about this protocol?
Post your question to gather feedback from the community. We will also invite the authors of this article to respond.
Share
Bluesky
X
Copy link
