
- Home
- Protocols

-


Co-Immunoprecipitation (Co-IP) using pAN580 in Nicotiana benthamiana or Rice Protoplasts

Last updated date: Nov 13, 2024 DOI: 10.21769/p2756 Views: 384 Forks: 0
 Download PDF
 Ask a
question
Ask a
question
 How to
cite
How to
cite
 Favorite


Experimental Principle:
Co-immunoprecipitation (Co-IP) is a classic method based on the specific interaction between antibodies and antigens to study protein-protein interactions, and it is also an effective method to determine the physiological interaction of two proteins within intact cells. The principle is that when cells are lysed under non-denaturing conditions, the protein interactions present within the intact cells are maintained. When the crude protein extract is incubated with agarose-conjugated anti-TAG beads that can recognize the target protein, the interacting proteins that bind to the target protein in vivo are also precipitated. A commercial tag is usually fused to the target protein, and the specific interaction with the tag antibody beads is achieved. The most commonly used commercial tags include HA (hemagglutinin), Flag, or c-Myc peptide segments. After incubating the crude extract with the beads, it is washed several times with the same extraction buffer to eliminate all proteins that have not bound to the beads, while retaining the specific interacting proteins. Then, the protein complexes are eluted from the beads, and the most direct method is to boil the beads with electrophoresis loading buffer. Finally, SDS-PAGE is used to detect aliquots of the crude extract (to analyze the expression levels of the produced proteins) and the eluted products (to detect the immunoprecipitation of the target protein and the co-immunoprecipitation of the interacting proteins), and specific tag antibodies are used for protein blotting. This method is often used to determine whether two target proteins bind in vivo; it can also be used to identify new interacting proteins for a specific protein. The advantages of this method are that the interacting proteins are all post-translationally modified and in their native state; the protein interactions occur under natural conditions, avoiding artificial influences; and native protein complexes can be isolated. The disadvantages are that it may not detect transient interactions between low-affinity proteins; the two proteins may not bind directly and may require a third protein to act as a bridge; and the target protein must be predicted before the experiment to choose the final detection antibody.
Reagents:
3xFLAG tag
PCR primers (X-F, X-R, 3XFLAG-F, 3XFLAG-R, Y-F, Y-R)
KOD FX DNA polymerase (TOYOBO KFX-101)
dNTPs (deoxynucleotide triphosphates)
Plant cDNA
pAN580 plasmid DNA
rCutSmart buffer
Spel I-HF and Pst I-HF restriction enzymes
Agarose
Gel-Red nucleic acid dye
EasyPure Quick Gel Extraction Kit (TransGen Biotech, EG101)
ClonExpress® Ultra One Step Cloning Kit (Vazyme, C115)
Luria-Bertani (LB) medium
Kanamycin
Rifampicin
Acetosyringone
Dimethyl sulfoxide (DMSO)
Tris-MES buffer (pH 8.0)
Sucrose
MgCl2
EDTA
DTT (dithiothreitol)
PMSF (phenylmethylsulfonyl fluoride)
PBST (Phosphate-Buffered Saline with Tween 20)
Tween® 20
Equipment:
PCR machine
Temperature-controlled centrifuge
Vortex mixer
Agarose gel electrophoresis apparatus
UV gel documentation system
Sterile razor blade or sharp blade for sectioning plant material
Rotary shaker for incubation
Sieve with 200-micron mesh size for mechanical filtration
Eppendorf tubes (50 ml and 1.5 ml)
Pipette tips and pipettes
Incubator (for dark conditions and temperature control)
Water bath for heat shock treatment
Spectrophotometer (for measuring OD600 of bacterial culture)
Needle and syringe for plant infiltration
Sterile spreader for plating bacteria
1.5% agarose gel for DNA analysis
Gel casting mold
Electrophoresis tank
DNA marker (Trans2K® Plus II DNA Marker, TransGen Biotech, BM121-01)
Sequencing company services for DNA sequencing
1.Construct pAN580-X-3xFLAG Vector(FLAG tag)
1.1 First, artificially synthesize the 3xFLAG tag (send to a biological company)
Note: The FLAG tag is commonly used for detecting overexpressed proteins.
Common forms include FLAG and 3xFLAG, with typical amino acid sequences as follows:
FLAG 1:
Amino acid sequence: DYKDDDDK
DNA encoding sequence: GATTACAAGGACGACGATGACAAG
3xFLAG - First form:
Amino acid sequence: DYKDDDDKGDYKDDDDKIDYKDDDDK
DNA encoding sequence: GATTACAAGGATGACGACGATAAGGGAGATTACAAGGATGACGACGATAAGATCGATTACAAGGATGACGACGATAAG
3xFLAG - Second form:
Amino acid sequence: DYKDHDGDYKDHDIDYKDDDDK
DNA encoding sequence: GACTACAAAGACCATGACGGTGATTATAAAGATCATGACATCGACTACAAGGATGACGATGACAAG
3xFLAG - Third form:
Amino acid sequence: DYKDDDDKDYKDDDDKDYKDDDDK
DNA encoding sequence: GATTACAAGGATGACGACGATAAGGACTATAAGGACGATGATGACAAGGACTACAAAGATGATGACGATAAA
In most cases, the FLAG tag is constructed at the N-terminus or C-terminus of the protein, and in most cases, the N-terminus or C-terminus of the protein is exposed on the surface of the protein. In this situation, there is no difference between FLAG and 3xFLAG, as the antibody can bind to both. However, sometimes the protein terminus may be folded into the protein interior or obscured by other binding proteins. In such cases, a longer FLAG is more conducive to the exposure of the antibody binding epitope, allowing it to be bound by the antibody. All these forms have one thing in common: they all contain DDDDK, which is typically the binding epitope for the FLAG antibody (the length of the antibody binding epitope is generally 4-7 amino acids). The following experimental protocol is written for the use of the third form of 3xFLAG.
1.2 PCR Amplification of X Linker Sequence
X-F: ggacagcccagatcaactagt + first 20 bp of X CDS
X-R: ccttgtaatc + last 20 bp of X CDS (reverse complement)
3XFLAG-F:last 20 bp of X CDS +GATTACAAGGATGACGACGATAAGG
3XFLAG-R:tgccaaatgtttgaactgcag+TTTATCGTCATCATCTTTGTAGTCCTT
(Note: If constructing the empty vector pAN580-3XFLAG, use the following primers:
FLAG-F:ggacagcccagatcaactag+tGATTACAAGGATGACGA
FLAG-R:tgccaaatgtttgaactgcag+TTTATCGTCATCATCTTTGTAGTCCTT)
Note: The specific primer design scheme is as follows:
For the primers designed to recombine with the vector ends on both sides:
a. The upstream fragment forward amplification primer: 5'-upstream vector end homologous sequence + restriction site (can be retained or deleted) + gene-specific forward amplification primer sequence 3'
b. The downstream fragment reverse amplification primer: 5'-downstream vector end homologous sequence + restriction site (can be retained or deleted) + gene-specific reverse amplification primer sequence 3'
The gene-specific forward/reverse amplification primer sequences refer to the conventional forward/reverse amplification primer sequences of the insertion fragment, with a Tm value of 60~65°C being optimal;
The upstream/downstream vector end homologous sequences refer to the terminal sequences of the linearized vector (for homologous recombination), with a GC content of 40%-60% being optimal.
There are three ways to design primers between the middle insertion fragments:
a. Use 15-20bp from the 3' end of the previous fragment as a homologous sequence and add it to the 5' end of the subsequent fragment;
b. Use 15-20bp from the 5' end of the subsequent fragment as a homologous sequence and add it to the 3' end of the previous fragment;
c. Take a part from both fragments as a homologous sequence (a total of 15-20bp), and add them to the ends of the other fragment.
1.3 Configuration of PCR Amplification System with Linker Gene X (Using KOD FX, TOYOBO KFX-101)
Before preparing the reaction mixture, please thoroughly mix all reagents except for KOD FX (enzyme solution). Frozen reagents should be completely thawed on ice before use.
2x PCR buffer 25 μl
2mM dNTPs 10 μl
X-F Primer 1.5 μl
X-R Primer 1.5 μl
Plant cDNA 0.2 μg
KOD FX (1.0U/μl) 1 μl
ddH2O up to 50 μl Please add KOD FX (enzyme solution) last, and mix the reaction mixture thoroughly with a Vortex or similar device, then spin down before proceeding with PCR.
1.4 PCR Amplification of Gene X with Linkers
Subsequently, use a temperature-controlled PCR machine with the following program:
Predenature 94℃, 2 min.
Denature 98℃, 10 sec
Annealing (Tm-5)℃, 30 sec
Extension 68℃, 1kb/min Set Denature to Extension for 33 cycles.
Final extension 68℃, 7 min. After the reaction is complete, transfer to a 4℃ refrigerator for storage.
1.5 Configuration of PCR Amplification System with Linker 3xFLAG (Using KOD FX, TOYOBO KFX-101)
Before preparing the reaction mixture, please thoroughly mix all reagents except for KOD FX (enzyme solution). Frozen reagents should be completely thawed on ice before use.
2x PCR buffer 25 μl
2mM dNTPs 10 μl
3XFLAG-F Primer 1.5 μl
3XFLAG-R Primer 1.5 μl
3XFLAG 0.2 μg
KOD FX (1.0U/μl) 1 μl
ddH2O up to 50 μl Please add KOD FX (enzyme solution) last, and mix the reaction mixture thoroughly with a Vortex or similar device, then spin down before proceeding with PCR.
1.6 PCR Amplification of 3XFLAG with Linkers
Subsequently, use a temperature-controlled PCR machine with the following program:
Predenature 94℃, 2 min.
Denature 98℃, 10 sec
Annealing (Tm-5)℃, 30 sec
Extension 68℃, 1kb/min Set Denature to Extension for 33 cycles.
Final extension 68℃, 7 min. After the reaction is complete, transfer to a 4℃ refrigerator for storage.
1.7 Take the pAN580 plasmid out of the -20℃ freezer, place 10x rCutSmart buffer on ice, and after complete dissolution, configure the following system:
10x rCutSmart buffer 5 μl
Spel I-HF 1 μl
Pst I-HF 1 μl
pAN580 Plasmid DNA 1 μg
ddH2O up to 50 μl Subsequently, use a temperature-controlled PCR machine with the following program:
37℃ 45 min
65℃ 45 sec After the reaction is complete, transfer to a 4℃ refrigerator for storage.
1.8 Agarose Gel Electrophoresis and Gel Recovery (EasyPure Quick Gel Extraction Kit, TransGen Biotech, EG101)
(The method can refer to Wang, S, Huang, Z, Liu, Y, Shao, S, Li, L and Ma, M(2024). Application of the Nicotiana Allergic Necrosis Assay for the Validation of Protein-Protein Interactions between Fungal Effectors and Plant Receptor Kinases. Bio-protocol Preprint. bio-protocol.org/prep2729.)
1.9 Construct pAN580-X-FLAG Vector by Homologous Recombination (ClonExpress® Ultra One Step Cloning Kit, Vazyme, C115)
Calculate the dosage of linearized vector and insert fragment:
Optimal cloning vector dosage = [0.02 × cloning vector base pairs] ng (0.03 pmol)
Optimal insert fragment dosage = [0.02 × insert fragment base pairs] ng (0.03 pmol)
Note: Calculate the required DNA amount for the recombination reaction according to the formula. To ensure the accuracy of pipetting, dilute the linearized vector and insert fragment appropriately before preparing the recombination reaction system, with each component's volume not less than 1μl. Prepare the following reaction system on ice:
Linearized vector pAN580 Xμl
Insert X fragment Y1μl
Insert 3XFLAG fragment Y2μl
2 × ClonExpress Mix 5 μl
ddH2O to 10 μl Gently pipette to mix (do not vortex), briefly centrifuge to collect the reaction liquid at the bottom of the tube. Subsequently, use a temperature-controlled PCR machine with the following program:
50℃ 30 min After the reaction is complete, transfer to a 4℃ refrigerator for storage.
2.Construct pAN580-Y Vector(GFP tag)
2.1 PCR Amplification of Y Linker Sequence
Y-F: ggacagcccagatcaactagt + first 20 bp of X CDS
Y-R: gcccttgctcaccatggatcc + last 20 bp of X CDS (reverse complement)
2.2 Configuration of PCR Amplification System with Linker Gene X (Using KOD FX, TOYOBO KFX-101)
Before preparing the reaction mixture, please thoroughly mix all reagents except for KOD FX (enzyme solution). Frozen reagents should be completely thawed on ice before use.
2x PCR buffer 25 μl
2mM dNTPs 10 μl
Y-F Primer 1.5 μl
Y-R Primer 1.5 μl
Plant cDNA 0.2 μg
KOD FX (1.0U/μl) 1 μl
ddH2O up to 50 μl Please add KOD FX (enzyme solution) last, and mix the reaction mixture thoroughly with a Vortex or similar device, then spin down before proceeding with PCR.
2.3 PCR Amplification of Gene X with Linkers
Subsequently, use a temperature-controlled PCR machine with the following program:
Predenature 94℃, 2 min.
Denature 98℃, 10 sec
Annealing (Tm-5)℃, 30 sec
Extension 68℃, 1kb/min Set Denature to Extension for 33 cycles.
Final extension 68℃, 7 min. After the reaction is complete, transfer to a 4℃ refrigerator for storage.
2.4 PCR Amplification of Y with Linkers
Subsequently, use a temperature-controlled PCR machine with the following program:
Predenature 94℃, 2 min.
Denature 98℃, 10 sec
Annealing (Tm-5)℃, 30 sec
Extension 68℃, 1kb/min Set Denature to Extension for 33 cycles.
Final extension 68℃, 7 min. After the reaction is complete, transfer to a 4℃ refrigerator for storage.
2.5 Take the pAN580 plasmid out of the -20℃ freezer, place 10x rCutSmart buffer on ice, and after complete dissolution, configure the following system:
10x rCutSmart buffer 5 μl
Spel I-HF 1 μl
BamH I-HF 1 μl
pAN580 Plasmid DNA 1 μg
ddH2O up to 50 μl Subsequently, use a temperature-controlled PCR machine with the following program:
37℃ 45 min
65℃ 45 sec After the reaction is complete, transfer to a 4℃ refrigerator for storage.
2.6 Agarose Gel Electrophoresis and Gel Recovery (EasyPure Quick Gel Extraction Kit, TransGen Biotech, EG101)
(The method can refer to Wang, S, Huang, Z, Liu, Y, Shao, S, Li, L and Ma, M(2024). Application of the Nicotiana Allergic Necrosis Assay for the Validation of Protein-Protein Interactions between Fungal Effectors and Plant Receptor Kinases. Bio-protocol Preprint. bio-protocol.org/prep2729.)
2.7 Construct pAN580-X-FLAG Vector by Homologous Recombination (ClonExpress® Ultra One Step Cloning Kit, Vazyme, C115)
Calculate the dosage of linearized vector and insert fragment:
Optimal cloning vector dosage = [0.02 × cloning vector base pairs] ng (0.03 pmol)
Optimal insert fragment dosage = [0.04 × insert fragment base pairs] ng (0.06 pmol)
Note: Calculate the required DNA amount for the recombination reaction according to the formula. To ensure the accuracy of pipetting, dilute the linearized vector and insert fragment appropriately before preparing the recombination reaction system, with each component's volume not less than 1μl. Prepare the following reaction system on ice:
Linearized vector pAN580 Xμl
Insert Y fragment Y1μl
2 × ClonExpress Mix 5 μl
ddH2O to 10 μl Gently pipette to mix (do not vortex), briefly centrifuge to collect the reaction liquid at the bottom of the tube. Subsequently, use a temperature-controlled PCR machine with the following program:
50℃ 30 min After the reaction is complete, transfer to a 4℃ refrigerator for storage.
3. Transformation of Chemically Competent Cells:Place the chemically competent cells used for cloning on ice to thaw (e.g., DH5α Competent Cells, Vazyme, C502).
3.1 Recombinant Product Transformation,Take 10 μl of the pAN580-X-3XFLAG and pAN580-Y recombinant products and add them separately to 100 μl of competent cells. Gently tap the tube to mix (do not vortex) and let sit on ice for 30 minutes.
Note: The volume of recombinant product for transformation should not exceed 1/10 of the volume of the competent cells used.
3.2 Heat Shock:Transfer to a 42°C water bath for 45 seconds, then immediately cool on ice for 2 minutes.
3.3 Recovery in Liquid Media:Add 800 μl of LB liquid medium (without antibiotics) and incubate at 37°C with shaking at 200 rpm for 1 hour.
3.6 Pre-warming of Agar Plates:Pre-warm the LB agar plates containing Kanamycin resistance in a 37°C incubator.
3.7 Centrifugation and Plating:Centrifuge at 5,000 rpm (2,500 × g) for 5 minutes, discard the 800 μl supernatant. Resuspend the pellet in the remaining medium and gently spread with a sterile spreader on plates with the correct antibiotic resistance.
3.8 Incubation:Invert and incubate in a 37°C incubator for 12-16 hours.
3.9 Picking Single Colonies:Pick single colonies into 1.5 ml tubes containing 1 ml of LB liquid medium, add 1 μl of Kanamycin antibiotic, and incubate at 37°C with shaking at 200 rpm for 6 hours. Generally, 8-12 single clones are used for material identification.
3.10 PCR Amplification System Configuration (using KOD FX, TOYOBO KFX-101)
Both pAN580-X-3XFLAG and pAN580-Y use a common forward primer X-F for PCR amplification:
35s-F: 5’-CTATCCTTCGCAAGACCCTTC-3’
Mix all reagents thoroughly on ice before adding the KOD FX (enzyme solution). Ensure all frozen reagents are completely thawed on ice before use.
Reagents Volume
2x PCR buffer 10 μl
2mM dNTPs 4 μl
35s-F Primer 0.6 μl
X-3XFLAG-R Primer 0.6 μl
Bacterial culture 1ul
KOD FX (1.0U/μl) 0.4 μl
ddH2O up to 20 μl
Reagents Volume
2x PCR buffer 10 μl
2mM dNTPs 4 μl
35s-F Primer 0.6 μl
Y-R Primer 0.6 μl
Bacterial culture 1ul
KOD FX (1.0U/μl) 0.4 μl
ddH2O up to 20 μl
Add KOD FX (enzyme solution) last, vortex the reaction mixture thoroughly, and centrifuge before proceeding with PCR.
3.11 PCR Amplification Program:
Predenature: 94°C, 2 min.
Denature: 98°C, 10 sec
Annealing: (Tm-5)°C, 30 sec
Extension: 68°C, 1kb/min
Set Denature to Extension for 33 cycles
Final extension: 68°C, 7 min.
After the reaction is complete, transfer the products to a 4°C refrigerator for storage.
3.12 Agarose Gel Preparation:Prepare a 1.5% agarose gel by adding 1.5 g of agarose powder to 100 ml of 1×TAE buffer (i.e., 50xTAE: ddH2O = 1:49). Microwave until the agarose is completely dissolved, avoiding excessive boiling that could lead to evaporation and affect the final concentration. When cooled to approximately 50°C, add 10 μl of Gel-Red nucleic acid dye (10,000x).
3.13 Gel Casting:Pour the gel into a casting mold, insert a comb at the appropriate position, and let it solidify at room temperature for 40 minutes. Remove the comb, place the gel into the electrophoresis tank, ensuring the wells are on the negative pole side.
3.14 Electrophoresis:Fill the tank with 1×TAE to a level just covering the gel surface. Load 10 μl of PCR product mixed with 2 μl of 6x DNA loading buffer into each well. Load 5 μl of Trans2K® Plus II DNA Marker (TransGen Biotech, BM121-01) into the leftmost well. Run the electrophoresis at 120V for approximately 25-40 minutes.
3.15 Gel Visualization and Sequencing:After electrophoresis, observe the band sizes under a UV gel doc to confirm they match the expected sizes. Send the successfully amplified bacterial cultures and primers X-F, A-R, B-R for sequencing to a sequencing company.
Note: There are two methods to extract proteins here. The first method involves using protoplasts to express proteins, and the second method is to transform Nicotiana benthamiana through Agrobacterium. Researchers can choose either method depending on their expertise.
4. Rice protoplast extraction and transformation, and protein extraction(The method comes from: Wang, S, Huang, Z, sijia, T, Feng, S, Liu, X, Shu, Y, Liang, Y and Chen, Z(2024). A buffer formulation and application for efficient protoplast extraction and transformation of rice. Bio-protocol Preprint. bio-protocol.org/prep2723.)
4.1. Procure 80 etiolated seedlings of the rice cultivar 9311 that have been cultured in darkness for a period of 12 days. Select the rice stem segment, approximately 5-7 centimeters above the collar of the youngest fully expanded leaf, and prepare it into thin sections with a thickness of 0.4-0.6 millimeters using a sterile, sharp blade—ideally a sterilized razor blade. It is essential that the cutting be executed in a single, swift motion, with a calendered paper placed beneath to facilitate this process. Transfer these thin sections into a 250 milliliter Erlenmeyer flask, ensuring they cover the bottom of the flask.
4.2 Immerse the thin sections in 20 milliliters of L enzyme solution within the flask. To prevent exposure to light, which can adversely affect the enzymatic digestion process, wrap the Erlenmeyer flask with aluminum foil. Incubate the flask on a rotary shaker at a controlled temperature of 28°C Celsius and a shaking speed of 80 revolutions per minute for a duration of four hours. This controlled environment facilitates the enzymatic digestion of the cell walls, thereby releasing the protoplasts from the plant tissue.
4.3 After the cultivation period, the enzymatically treated tissue should be subjected to mechanical filtration through a sieve with a 200-micron mesh size. This step should be performed by gently applying manual pressure to the thin slice fragments to express the protoplasts through the sieve, with meticulous attention to avoid exerting excessive force that could compromise the integrity of the protoplasts.
4.4 The L enzyme solution must be completely drained from the sieve. To facilitate this, a pipette tip, can be utilized to scrape any residual small tissue pieces back into the flask. The initial filtrate, which contains the L enzyme solution, should be discarded, as it no longer serves a purpose in the protocol. The remaining tissue slices, now enriched with isolated protoplasts, should be carefully collected and preserved for subsequent experimental procedures.
4.5 The residual tissue slices obtained after enzymatic digestion should be resuspended in 30 milliliters of S solution. This suspension should then be cultured on a rotary shaker at a speed of 80 revolutions per minute (rpm) in a dark environment maintained at a temperature of 28°C Celsius for a duration of 2 hours. Following this incubation period, the suspension should be passed through a sieve with a mesh size ranging from 100 to 200 microns. The slices will be retained on the sieve, while the liquid fraction is allowed to pass through.
4.6 After the filtration, the slices on the sieve should be washed four times with 5 milliliters of S solution per wash, with each filtrate being collected into a sterile 50 milliliter round-bottom Eppendorf tube. The collected filtrate should then be centrifuged at a speed of 1200 rpm, which corresponds to a centrifugal force of less than 250g, for a period of 6 minutes. The centrifugation process should be conducted with an acceleration and deceleration rate set to 3. Following centrifugation, the supernatant should be carefully removed, and 500 microliters of the precipitate should be retained.
4.7 Subsequently, 500 microliters of S solution should be slowly added along the wall of the 50 ml Eppendorf tube to the retained precipitate. The mixture should then be gently resuspended using a yellow pipette tip, which has been modified by cutting off approximately 0.5 centimeters from the tip and sterilized by flaming for 3 seconds. This results in the formation of the initial suspension solution of 9311 protoplasts, which will appear yellow and turbid, indicating the presence of the isolated protoplasts.
4.8 Prepare a mixture by combining the plasmid DNA, which has been extracted using the Endofree Maxi Plasmid Kit (TIANGEN; China) and has a concentration exceeding 2 ng/μl, with 100 μl of the 9311 protoplast suspension,and 25μl pAN580-Y,25μl pAN580-X-3XFLAG. Subsequently, introduce 110 μl of W solution to the mixture and allow it to incubate on ice for a period of 20 minutes. This step facilitates the interaction between the plasmid DNA and the protoplasts, enhancing the efficiency of subsequent transformation processes.
Note:CoIP co-expression requires >3ug of each plasmid!
4.9 Upon completion of the ice incubation, gently add 1 ml of S solution to the reaction mixture along the wall of the container and repetitive invert to ensure thorough mixing. It should be noted that the appearance of small particles under fluorescent light does not significantly impact the experimental outcomes. The mixture is then subjected to centrifugation at 800 rpm for 6 minutes, with the centrifuge acceleration and deceleration settings adjusted to 3. After centrifugation, carefully remove the supernatant. Re-suspend the pellet in 1 ml of S solution, ensuring thorough mixing, and then transfer the suspension to a 28°C incubator for a period of 20 hours in the dark. This dark incubation period is crucial for allowing the protoplasts to recover and for the expression of any introduced genes to occur.
4.10 Centrifuge at 1000 ×g for 3 minutes (alternatively, you may choose to increase the speed to 2000g), and remove the supernatant (samples can be stored at -80°C);
4.11 Add 20 μl of ddH2O, vortex for 1 minute, and let it sit on ice for 5 minutes (the duration can be adjusted);
4.12 Add 100 μl of non-denaturing protein extraction buffer or denaturing protein extraction buffer, vortex for 1 minute, and let it sit on ice for 20 minutes (the duration can be extended, even up to 2 hours is acceptable).
Solution formulation
Table 1 L enzymatic hydrolysate I
Reagents name | Measurement (per 100 ml) |
Celluase R10 | 1.0 g |
Macerozyme R10 | 0.5 g |
0.2 M MES | 5 ml |
0.6 M D-Mannitol | to 100 ml |
Note:The formulation of the 0.6 M D-Mannitol solution is shown in Table 2, and the formulation of the 0.2 M MES solution is shown in Table 3.
Table 2 0.6 M D-Mannitol solution
Reagents name | Measurement (per 500 ml) |
D-Mannitol | 54.7 g |
ddH2O | to 500 ml |
Note: Sterilize at 121°C for 15 minutes and store in a 4°C refrigerator for use.
Table 3 0.2 M MES solution
Reagents name | Measurement (per 100 ml) |
| MES | 3.9 g |
| ddH2O | to 100 ml |
Table 4 L enzymatic hydrolysateⅡ
Reagents name | Measurement (per 1000 ml) |
| 1 M CaCl2 | 1000 μL |
| Bovine Serum Albumin | 1 g |
Note: The L enzyme solution I must be freshly prepared to ensure its efficacy. Immediately following preparation, the solution should be subjected to incubation in a water bath maintained at a temperature of 55°C Celsius for a duration of 10 minutes. This step is essential for activating the enzymatic components. After incubation, the solution should be allowed to equilibrate to room temperature.Subsequently, an equal volume of L enzyme solution II should be added to the cooled L enzyme solution I. This mixture yields the final L enzyme solution, which is intended for use in the enzymatic digestion of plant tissues.Prior to its application, the L enzyme solution must be filtered through a 0.22-micrometer filter membrane to remove any potential particulate matter or contaminants. This filtration step is crucial for preventing the introduction of foreign materials into the experimental system, thereby ensuring the purity and reliability of the enzymatic digestion process.
Table 5 S solution
Reagents name | Measurement (per 1000 ml) |
NaCl | 9.0 g |
CaCl2·2H2O | 18.35g |
0.2 M MES | 8 mL |
KCl | 0.447 g |
ddH2O | to 1000mL |
Note: Check if the pH is between 5.56-5.7, if it is lower, adjust the pH to 5.7 using a 1 M KOH solution, sterilize at 121°C for 15 minutes, and then store in a 4°C refrigerator for use.
Table 6 W solution
| Reagents name | Measurement (per 50 ml) |
| PEG 4000 | 20 g |
| 1 M CaCl2 | 5 mL |
| 0.5 M KH2PO4 | 200 ul |
| 0.6 M D-Mannitol | to 50ml |
5. Agrobacterium Transformation of Recombinant Plasmids pAN580-X-3XFLAG and pAN580-Y
5.1 Preparation of Agrobacterium Transformation Mixture: Withdraw 5 μl of the final carrier plasmids pAN580-X-3XFLAG and pAN580-Y (approximately 1-2 μg) and add them to 100 μl of Agrobacterium tumefaciens competent GV3101 cells to mix uniformly.
5.2 Cold and Heat Shock Treatment: Place the mixture on ice for 30 minutes, then quickly immerse in liquid nitrogen for 5 minutes, followed by a 5-minute incubation at 37°C in a water bath, and then immediately place on ice for 2 minutes.
5.3 Recovery in Liquid Media: Add 800 μl of liquid Luria-Bertani (LB) medium to the mixture and incubate at 28°C with shaking at 200 rpm for 4 hours.
5.4 Spreading on Solid LB Plates and Incubation: Withdraw 200 μl of the bacterial culture and spread it onto solid LB plates containing 50 μg/ml Kanamycin and 50 μg/ml Rifampicin. Incubate at 28°C in a constant temperature incubator for 48 hours.
6. Cultivation and Management of Nicotiana benthamiana
6.1 Disinfection: Immerse the seeds in 50-60% ethanol for approximately 1 minute, followed by rinsing with sterile water three times. Subsequently, soak the seeds in a 10% sodium hypochlorite solution for about 10 minutes, and rinse with sterile water three times.
6.2 Germination: Place the disinfected seeds on moist sterile filter paper within a petri dish, seal with plastic wrap or a plastic lid. Incubate the petri dish at 28°C in the dark to promote seed germination, which typically takes 3 days.
6.3 Soil Preparation: Fill seed trays or pots with sterile soil or a specialized growth medium, ensuring the soil is moist and the pH is appropriate (usually 6.0-6.5).
6.4 Sowing: Sow the germinated seeds on the soil surface, lightly covering them with a thin layer of soil.
6.5 Greenhouse or Growth Chamber Cultivation: Place the sown seed trays in a greenhouse or growth chamber, providing ample light under a photoperiod of 14 hours light/10 hours darkness, at a temperature of 25°C and a relative humidity of 70%. Cultivate for approximately 4-5 weeks. Regularly check the soil moisture to keep the soil moist but not waterlogged.
6.6 Standard Practice: When the plants have developed 4-6 true leaves, they are ready for Agrobacterium-mediated transformation.
7. Transient Expression of Effector Protein in Nicotiana benthamiana Leaf Tissue
7.1 Inoculation of Agrobacterium Single Colonies:Select single colonies of Agrobacterium containing the final vectors pAN580-X-3XFLAG and pAN580-Y and inoculate them into 5 ml of LB medium containing 50 μg/ml Kanamycin and 50 μg/ml Rifampicin. Cultivate at 28°C with 200 rpm shaking for 2 days. (Freshly transformed Agrobacterium single colonies can be cultured overnight in 3 ml of medium until day 1.)
7.2 Liquid Culture and Expansion: Transfer 1 ml of the cultured Agrobacterium liquid to 20 ml of liquid LB medium containing 50 μg/ml Kanamycin and 50 μg/ml Rifampicin for expanded culture. This LB medium also contains 15 μM acetosyringone. Cultivate at 28°C with 200 rpm shaking until the Agrobacterium reaches the logarithmic growth phase (OD600 = 0.5-0.6).
7.3 Collection and Resuspension of Bacterial Cells:Centrifuge at 5,000 rpm for 10 minutes at room temperature to collect the bacterial cells. Resuspend the Agrobacterium cells in infiltration buffer X (containing 10 mM MgCl2, 10 mM MES, 150 μM acetosyringone, pH = 5.6) to an OD600 of 1.0. Allow the cells to stand at room temperature for 2 hours.
7.4 Mixture of Bacterial Cultures and Infiltration: Mix equal volumes of the two bacterial cultures containing pAN580-X-3XFLAG and pAN580-Y. Use a 1 ml needle to gently make a small incision on the abaxial side of a Nicotiana benthamiana leaf (be careful not to pierce through). Then, use a needle without a syringe toabsorb the bacterial suspension and inject it into the leaf through the wound. Mark the area on the leaf with a marker.
Note:pAN580-X-3XFLAG + pAN580-Y,pAN580-X-3XFLAG + pAN580,pAN580-3XFLAG + pAN580-Y,pAN580-3XFLAG + pAN580
7.5 Cultivation and Phenotypic Observation: Cultivate the injected plants in the dark at approximately 25°C for 5 days.
Supplementary: Solution Formulas
0.5 M MES (pH 5.6): Weigh out 9.75 g of anhydrous MES and dissolve in deionized water. Adjust the pH to 5.6 with NaOH, bring to a final volume of 100 ml, filter sterilize, and store at 4°C.
150 mM Acetosyringone: Weigh out 2.943g of acetosyringone and dissolve in 5 ml of DMSO (dimethyl sulfoxide). Add deionized water to bring to a final volume of 10 ml, filter sterilize, and store at -20°C.
Note:1 mM=1000 μM
7.Preparation of Protein Crude Extract
7.1 Remove frozen tobacco leaves from the -80°C freezer and place them in liquid nitrogen. Weigh approximately 2g of frozen leaves and quickly return them to the liquid nitrogen; Grind the tobacco leaves into a powder in a mortar pre-cooled with liquid nitrogen, transfer the powder to a 10mL centrifuge tube, and resuspend with 1.5-2mL of lysis extraction buffer NB1 (Tris-MES (pH8.0) 50 mmol/L, Sucrose 500 mmol/L, MgCl2 1 mmol/L, EDTA 10 mmol/L, DTT 5 mmol/L, PMSF 1 mmol/L), and mix thoroughly with a shaker. (If protoplasts are used, grinding is not necessary; directly add 1.5-2mL of lysis extraction buffer NB1 and mix thoroughly with a shaker.) 7.2 Place on ice for 30 minutes and pre-cool the tabletop centrifuge; centrifuge at 4°C for 1 hour at 15000×g; collect the supernatant on ice, filter the supernatant through Miracloth, being careful not to create foam.
7.3 Measure the concentration of each protein crude extract (BAC method).
8.Co-Immunoprecipitation (Co-IP)
8.1 If performing Co-IP, take out 20μL as input for detection (Note: Detect two antibodies here, GFP and FLAG), and store the remaining sample at -80°C for later use; if detecting proteins directly, add loading buffer, denature, and load for detection.
8.2 Add the remaining protein sample to 500μL of pre-cooled PBST, then add antibody-conjugated beads, and incubate with shaking at 4°C or on ice for 3 hours (If there are no antibody-conjugated beads, first add antibodies to the sample, incubate at 4°C or on ice for 3 hours, then add protein GFP or FLAG and incubate for another 3 hours; Note: Wash the beads with PBST three times to remove any alcohol).
8.3 Wash the beads with pre-cooled PBST or wash buffer at least three times, and finally retain a certain amount of solution (depending on the amount and number of samples), vortex, and add loading buffer, boil for 10 minutes.
8.4 Briefly centrifuge; at 4°C, centrifuge at 15000×g for 30 seconds, mix well before loading (alternatively, high-speed centrifuge, take the supernatant, and mix the samples), and proceed with western blot.
Support:The recipe for PBST (Phosphate-Buffered Saline with Tween 20) is as follows:
NaCl (Sodium Chloride): 137 mM
KCl (Potassium Chloride): 2.7 mM
Na2HPO4 (Disodium Hydrogen Phosphate): 10 mM
KH2PO4 (Potassium Dihydrogen Phosphate): 1.8 mM
Tween® 20: 0.1% (w/v)
The preparation method is to add 1 mL of Tween 20 detergent to every 1000 mL of PBS. This means you need to first prepare PBS (Phosphate-Buffered Saline) and then add Tween 20 to it to meet the requirements of the PBST formula. The basic recipe for PBS is:
NaCl (Sodium Chloride): 1.42 g
KH2PO4 (Potassium Dihydrogen Phosphate): 0.24 g
Na2HPO4 (Disodium Hydrogen Phosphate): 8.77 g
Adjust pH to 7.2-7.4 with NaOH
Dissolve the above components in 800 ml of distilled water, adjust the pH of the solution to 7.4 with HCl, and then bring the volume up to 1 L with distilled water. After that, according to the PBST formula, add 1 mL of Tween 20 to every 1000 mL of PBS to obtain the PBST buffer.
Understood. Here is a simplified version of the Co-IP experiment loading order:
Input Samples: Start by loading the total protein samples that have not been subjected to immunoprecipitation (Input). This typically includes a mixture of Y protein with a GFP tag and X protein with a FLAG tag, as well as individual control GFP and FLAG proteins. This step is to show the expression levels of the proteins before the experiment begins.
Individual IP Samples: Next, load the Y protein with a GFP tag that has been precipitated using an anti-GFP antibody (IP:GFP), and the X protein with a FLAG tag precipitated using an anti-FLAG antibody (IP:FLAG). This step is to demonstrate the individual precipitation effects of each tagged protein.
Co-IP Samples: Finally, load the mixture of Y protein with a GFP tag and X protein with a FLAG tag that has been precipitated using an anti-GFP antibody (Co-IP:GFP), and the same mixture precipitated using an anti-FLAG antibody (Co-IP:FLAG). This step is to show whether the two proteins can co-precipitate, thereby proving their interaction.
Western Blot Analysis: In the Western blot analysis, use specific antibodies to detect the proteins in each sample. Use an anti-GFP antibody (IB:GFP) for the Y protein with a GFP tag, and an anti-FLAG antibody (IB:FLAG) for the X protein with a FLAG tag. This way, you can determine which proteins have been precipitated and whether they co-precipitate, thus verifying their interaction.
1.Vector Name: pAN580
Vector Size: 4712 base pairs (bp)
Fluorescent Protein: GFP (S65T version)
Promoter: 35S
Terminator: nos 3' terminator
Vector Type: pBS-based plasmid
Selection Marker: Ampicillin (for ampicillin resistance)
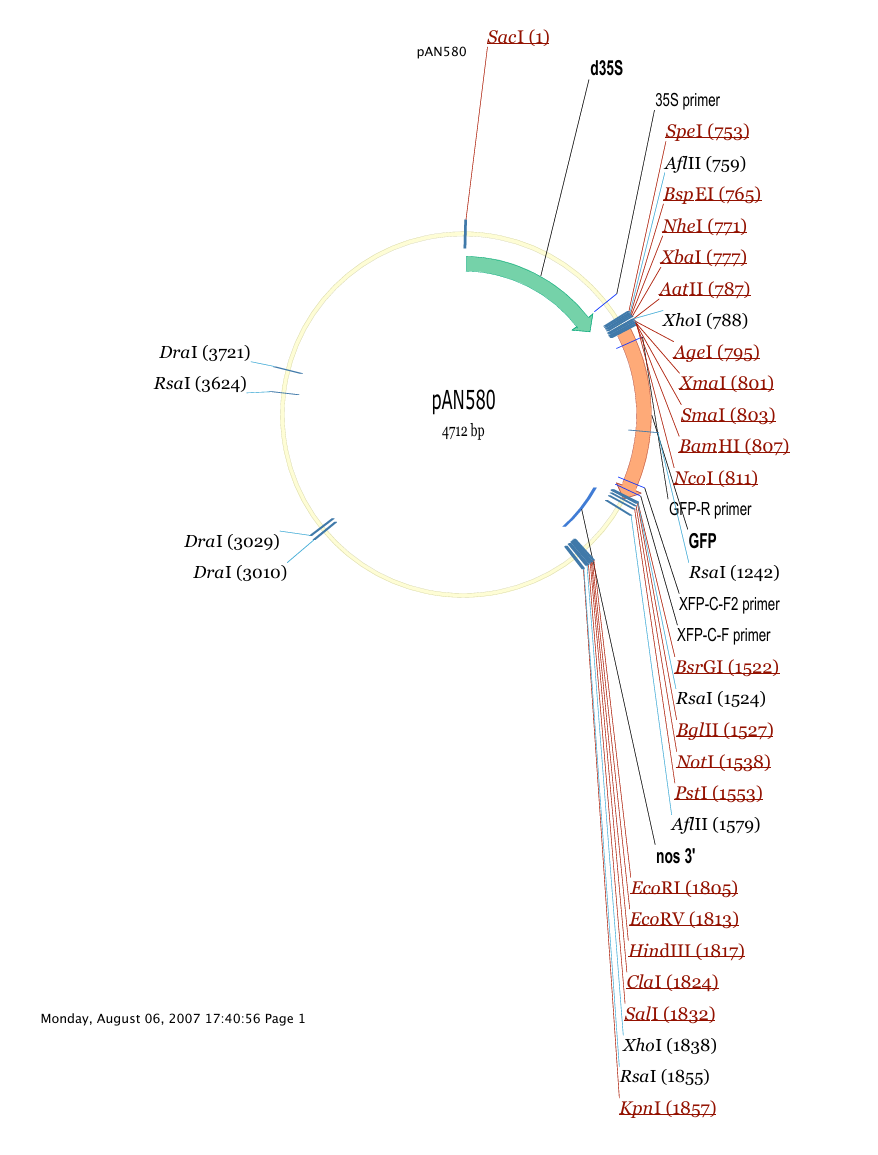
>pAN580
CCCTACCCCTACTCCAAAAATGTCAAAGATACAGTCTCAGAAGACCAAAGGGCTATTGAGACTTTTCAACAAAGGGTAATTTCGGGAAACCTCCTCGGATTCCATTGCCCAGCTATCTGTCACTTCATCGAAAGGACAGTAGAAAAGGAAGGTGGCTCCTACAAATGCCATCATTGCGATAAAGGAAAGGCTATCATTCAAGATGCCTCTGCCGACAGTGGTCCCAAAGATGGACCCCCACCCACGAGGAGCATCGTGGAAAAAGAAGACGTTCCAACCACGTCTTCAAAGCAAGTGGATTGATGTGACATCTCCACTGACGTAAGGGATGACGCACAATCCCACCCCTACTCCAAAAATGTCAAAGATACAGTCTCAGAAGACCAAAGGGCTATTGAGACTTTTCAACAAAGGGTAATTTCGGGAAACCTCCTCGGATTCCATTGCCCAGCTATCTGTCACTTCATCGAAAGGACAGTAGAAAAGGAAGGTGGCTCCTACAAATGCCATCATTGCGATAAAGGAAAGGCTATCATTCAAGATGCCTCTGCCGACAGTGGTCCCAAAGATGGACCCCCACCCACGAGGAGCATCGTGGAAAAAGAAGACGTTCCAACCACGTCTTCAAAGCAAGTGGATTGATGTGACATCTCCACTGACGTAAGGGATGACGCACAATCCCACTATCCTTCGCAAGACCCTTCCTCTATATAAGGAAGTTCATTTCATTTGGAGAGGACAGCCCAGATCAACTAGTCTTAAGTCCGGAGCTAGCTCTAGAGACGTCTCGAGGACCGGTCCCGGGGGATCCATGGTGAGCAAGGGCGAGGAGCTGTTCACCGGGGTGGTGCCCATCCTGGTCGAGCTGGACGGCGACGTGAACGGCCACAAGTTCAGCGTGTCCGGCGAGGGCGAGGGCGATGCCACCTACGGCAAGCTGACCCTGAAGTTCATCTGCACCACCGGCAAGCTGCCCGTGCCCTGGCCCACCCTCGTGACCACCTTCACCTACGGCGTGCAGTGCTTCAGCCGCTACCCCGACCACATGAAGCAGCACGACTTCTTCAAGTCCGCCATGCCCGAAGGCTACGTCCAGGAGCGCACCATCTTCTTCAAGGACGACGGCAACTACAAGACCCGCGCCGAGGTGAAGTTCGAGGGCGACACCCTGGTGAACCGCATCGAGCTGAAGGGCATCGATTCAAGGAGGACGGCAACATCCTGGGGCACAAGCTGGAGTACAACTACAACAGCCACAACGTCTATATCATGGCCGACAAGCAGAAGAACGGCATCAAGGTGAACTTCAAGATCCGCCACAACATCGAGGACGGCAGCGTGCAGCTCGCCGACCACTACCAGCAGAACACCCCCATCGGCGACGGCCCCGTGCTGCTGCCCGACAACCACTACCTGAGCACCCAGTCCGCCCTGAGCAAAGACCCCAACGAGAAGCGCGATCACATGGTCCTGCTGGAGTTCGTGACCGCCGCCGGGATCACTCACGGCATGGACGAGCTGTACAGATCTTAAAGCGGCCGCCCGGCTGCAGTTCAAACATTTGGCAATAAAGTTTCTTAAGATTGAATCCTGTTGCCGGTCTTGCGATGATTATCATATAATTTCTGTTGAATTACGTTAAGCATGTAATAATTAACATGTAATGCATGACGTTATTTATGAGATGGGTTTTTATGATTAGAGTCCCGCAATTATACATTTAATACGCGATAGAAAACAAAATATAGCGCGCAAACTAGGATAAATTATCGCGCGCGGTGTCATCTATGTTACTAGATCGGGAATTCGATATCAAGCTTATCGATACCGTCGACCTCGAGGGGGGGCCCGGTACCCAGCTTTTGTTCCCTTTAGTGAGGGTTAATTTCGAGCTTGGCGTAATCATGGTCATAGCTGTTTCCTGTGTGAAATTGTTATCCGCTCACAATTCCACACAACATACGAGCCGGAAGCATAAAGTGTAAAGCCTGGGGTGCCTAATGAGTGAGCTAACTCACATTAATTGCGTTGCGCTCACTGCCCGCTTTCCAGTCGGGAAACCTGTCGTGCCAGCTGCATTAATGAATCGGCCAACGCGCGGGGAGAGGCGGTTTGCGTATTGGGCGCTCTTCCGCTTCCTCGCTCACTGACTCGCTGCGCTCGGTCGTTCGGCTGCGGCGAGCGGTATCAGCTCACTCAAAGGCGGTAATACGGTTATCCACAGAATCAGGGGATAACGCAGGAAAGAACATGTGAGCAAAAGGCCAGCAAAAGGCCAGGAACCGTAAAAAGGCCGCGTTGCTGGCGTTTTTCCATAGGCTCCGCCCCCCTGACGAGCATCACAAAAATCGACGCTCAAGTCAGAGGTGGCGAAACCCGACAGGACTATAAAGATACCAGGCGTTTCCCCCTGGAAGCTCCCTCGTGCGCTCTCCTGTTCCGACCCTGCCGCTTACCGGATACCTGTCCGCCTTTCTCCCTTCGGGAAGCGTGGCGCTTTCTCATAGCTCACGCTGTAGGTATCTCAGTTCGGTGTAGGTCGTTCGCTCCAAGCTGGGCTGTGTGCACGAACCCCCCGTTCAGCCCGACCGCTGCGCCTTATCCGGTAACTATCGTCTTGAGTCCAACCCGGTAAGACACGACTTATCGCCACTGGCAGCAGCCACTGGTAACAGGATTAGCAGAGCGAGGTATGTAGGCGGTGCTACAGAGTTCTTGAAGTGGTGGCCTAACTACGGCTACACTAGAAGGACAGTATTTGGTATCTGCGCTCTGCTGAAGCCAGTTACCTTCGGAAAAAGAGTTGGTAGCTCTTGATCCGGCAAACAAACCACCGCTGGTAGCGGTGGTTTTTTTGTTTGCAAGCAGCAGATTACGCGCAGAAAAAAAGGATCTCAAGAAGATCCTTTGATCTTTTCTACGGGGTCTGACGCTCAGTGGAACGAAAACTCACGTTAAGGGATTTTGGTCATGAGATTATCAAAAAGGATCTTCACCTAGATCCTTTTAAATTAAAAATGAAGTTTTAAATCAATCTAAAGTATATATGAGTAAACTTGGTCTGACAGTTACCAATGCTTAATCAGTGAGGCACCTATCTCAGCGATCTGTCTATTTCGTTCATCCATAGTTGCCTGACTCCCCGTCGTGTAGATAACTACGATACGGGAGGGCTTACCATCTGGCCCCAGTGCTGCAATGATACCGCGAGACCCACGCTCACCGGCTCCAGATTTATCAGCAATAAACCAGCCAGCCGGAAGGGCCGAGCGCAGAAGTGGTCCTGCAACTTTATCCGCCTCCATCCAGTCTATTAATTGTTGCCGGGAAGCTAGAGTAAGTAGTTCGCCAGTTAATAGTTTGCGCAACGTTGTTGCCATTGCTACAGGCATCGTGGTGTCACGCTCGTCGTTTGGTATGGCTTCATTCAGCTCCGGTTCCCAACGATCAAGGCGAGTTACATGATCCCCCATGTTGTGCAAAAAAGCGGTTAGCTCCTTCGGTCCTCCGATCGTTGTCAGAAGTAAGTTGGCCGCAGTGTTATCACTCATGGTTATGGCAGCACTGCATAATTCTCTTACTGTCATGCCATCCGTAAGATGCTTTTCTGTGACTGGTGAGTACTCAACCAAGTCATTCTGAGAATAGTGTATGCGGCGACCGAGTTGCTCTTGCCCGGCGTCAATACGGGATAATACCGCGCCACATAGCAGAACTTTAAAAGTGCTCATCATTGGAAAACGTTCTTCGGGGCGAAAACTCTCAAGGATCTTACCGCTGTTGAGATCCAGTTCGATGTAACCCACTCGTGCACCCAACTGATCTTCAGCATCTTTTACTTTCACCAGCGTTTCTGGGTGAGCAAAAACAGGAAGGCAAAATGCCGCAAAAAAGGGAATAAGGGCGACACGGAAATGTTGAATACTCATACTCTTCCTTTTTCAATATTATTGAAGCATTTATCAGGGTTATTGTCTCATGAGCGGATACATATTTGAATGTATTTAGAAAAATAAACAAATAGGGGTTCCGCGCACATTTCCCCGAAAAGTGCCACCTAAATTGTAAGCGTTAATATTTTGTTAAAATTCGCGTTAAATTTTTGTTAAATCAGCTCATTTTTTAACCAATAGGCCGAAATCGGCAAAATCCCTTATAAATCAAAAGAATAGACCGAGATAGGGTTGAGTGTTGTTCCAGTTTGGAACAAGAGTCCACTATTAAAGAACGTGGACTCCAACGTCAAAGGGCGAAAAACCGTCTATCAGGGCGATGGCCCACTACGTGAACCATCACCCTAATCAAGTTTTTTGGGGTCGAGGTGCCGTAAAGCACTAAATCGGAACCCTAAAGGGAGCCCCCGATTTAGAGCTTGACGGGGAAAGCCGGCGAACGTGGCGAGAAAGGAAGGGAAGAAAGCGAAAGGAGCGGGCGCTAGGGCGCTGGCAAGTGTAGCGGTCACGCTGCGCGTAACCACCACACCCGCCGCGCTTAATGCGCCGCTACAGGGCGCGTCCCATTCGCCATTCAGGCTGCGCAACTGTTGGGAAGGGCGATCGGTGCGGGCCTCTTCGCTATTACGCCAGCTGGCGAAAGGGGGATGTGCTGCAAGGCGATTAAGTTGGGTAACGCCAGGGTTTTCCCAGTCACGACGTTGTAAAACGACGGCCAGTGAATTGTAATACGACTCACTATAGGGCGAATTGGAGCT
References:
Lin JS, Ali J, Lai EM. Protein-Protein Interactions: Co-Immunoprecipitation. Methods Mol Biol. 2024;2715:273-283. doi: 10.1007/978-1-0716-3445-5_18.
Kaboord B, Perr M. Isolation of proteins and protein complexes by immunoprecipitation. Methods Mol Biol. 2008;424:349-64. doi: 10.1007/978-1-60327-064-9_27.
Lin JS, Lai EM. Protein-Protein Interactions: Yeast Two-Hybrid System. Methods Mol Biol. 2017;1615:177-187. doi: 10.1007/978-1-4939-7033-9_14.
Ramisetty SR, Washburn MP. Unraveling the dynamics of protein interactions with quantitative mass spectrometry. Crit Rev Biochem Mol Biol. 2011 Jun;46(3):216-28. doi: 10.3109/10409238.2011.567244.
Kim D, Nita-Lazar A. Progress in mass spectrometry approaches to profiling protein-protein interactions in the studies of the innate immune system. J Proteins Proteom. 2020 Sep;15(3):545-559. doi: 10.1007/s42485-024-00156-6.
Xuegang Li, et al. Evolution of plasmid construction. Int J Biol Macromol. 2022. doi: 10.1016/j.ijbiomac.2022.04.094.
Liang Y, Zhang Y, Liu L. Intra-Molecular Homologous Recombination of Scarless Plasmid. Int J Mol Sci. 2020 Mar 2;21(5):1697. doi: 10.3390/ijms21051697.
Bi Y, Qiao X, Hua Z, Zhang L, Liu X, Li L, Hua W, Xiao H, Zhou J, Wei Q, Zheng X. An asymmetric PCR-based, reliable and rapid single-tube native DNA engineering strategy. BMC Biotechnol. 2012 Jul 6;12:39. doi: 10.1186/1472-6750-12-39.
Aguiar TQ, Oliveira C, Domingues L. Megaprimer-Based PCR to Synthesize Fusion Genes for Cloning. Methods Mol Biol. 2023;2967:193-207. doi: 10.1007/978-1-0716-3358-8_16.
Asad N, Smith E, Shakya S, Stegman S, Timmons L. Sustainable Methodologies for Efficient Gel Electrophoresis and Streamlined Screening of Difficult Plasmids. Methods Protoc. 2023 Mar 6;6(2):25. doi: 10.3390/mps6020025.
Cui Y, Gao C, Zhao Q, Jiang L. Using Fluorescent Protein Fusions to Study Protein Subcellular Localization and Dynamics in Plant Cells. Methods in Molecular Biology. 2016;1376:105-121. doi: 10.1007/978-1-4939-6352-2_7.
van Leeuwen J, Andrews B, Boone C, Tan G. Rapid and Efficient Plasmid Construction by Homologous Recombination in Yeast. Cold Spring Harb Protoc. 2015 Sep 1;2015(9):pdb.prot085100. doi: 10.1101/pdb.prot085100.
Tee KL, Wong TS. Polishing the craft of genetic diversity creation in directed evolution. Biotechnol Adv. 2013 Dec;31(8):1707-21. doi: 10.1016/j.biotechadv.2013.08.021.
Tolmachov O. Designing plasmid vectors. Methods Mol Biol. 2009;542:117-29. doi: 10.1007/978-1-59745-561-9_6.
Wang S, Huang Z, Liu Y, Shao S, Li L, Ma M. Application of the Nicotiana Allergic Necrosis Assay for the Validation of Protein-Protein Interactions between Fungal Effectors and Plant Receptor Kinases. Bio-protocol Preprint. bio-protocol.org/prep2729.
Results interpretation:
1.
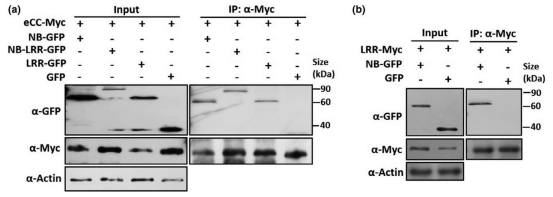
(a):
Experimental Design: The assay includes eCC-Myc, NB-GFP, NB-LRR-GFP, LRR-GFP, and GFP as proteins of interest.
Input: The presence of all proteins is confirmed in the input lanes, indicating successful expression and loading of the proteins.
IP: α-Myc:
A band is present in the eCC-Myc lane, indicating that eCC-Myc is successfully immunoprecipitated by the anti-Myc antibody.
Bands are present in the NB-GFP, NB-LRR-GFP, and LRR-GFP lanes, suggesting that these proteins interact with eCC-Myc and are co-immunoprecipitated.
No band is present in the GFP lane, indicating that GFP alone does not interact with eCC-Myc or is not efficiently co-immunoprecipitated.
(b):
Experimental Design: The assay includes LRR-Myc, NB-GFP, and GFP as proteins of interest.
Input: The presence of all proteins is confirmed in the input lanes.
IP: α-Myc:
A band is present in the LRR-Myc lane, indicating that LRR-Myc is successfully immunoprecipitated by the anti-Myc antibody.
A band is present in the NB-GFP lane, suggesting that NB-GFP interacts with LRR-Myc and is co-immunoprecipitated.
No band is present in the GFP lane, indicating that GFP alone does not interact with LRR-Myc or is not efficiently co-immunoprecipitated.
Conclusion:
(a), eCC-Myc interacts with NB-GFP, NB-LRR-GFP, and LRR-GFP, as indicated by their presence in the IP lane.
(b), LRR-Myc interacts with NB-GFP, as indicated by its presence in the IP lane.
2.
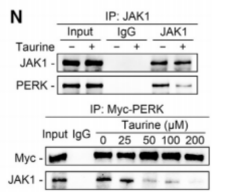
IP JAK1
Input: The presence of JAK1 and PERK in the input lanes indicates that these proteins are expressed in the cell lysate.
IP: JAK1
The IgG control shows no specific bands, indicating that the IgG does not precipitate PERK non-specifically.
The JAK1 IP lane shows a band corresponding to PERK, suggesting that PERK is associated with or bound to JAK1.
The presence of a band for JAK1 in the JAK1 IP lane confirms that JAK1 is being immunoprecipitated successfully.
IP Myc-PERK
Input: The presence of Myc and JAK1 in the input lanes at various concentrations (0, 25, 50, 100, 200) indicates that these proteins are expressed and that the amount of protein is being tested for the IP.
IP: Myc-PERK
The Myc IP lane shows a band corresponding to JAK1, suggesting that JAK1 is associated with or bound to Myc-PERK.
The presence of a band for Myc in the Myc IP lane confirms that Myc-PERK is being immunoprecipitated successfully.
Conclusion:
The results suggest that there is an interaction between JAK1 and PERK, as PERK is co-immunoprecipitated with JAK1.
Additionally, there appears to be an interaction between Myc-PERK and JAK1, as JAK1 is co-immunoprecipitated with Myc-PERK.
3.
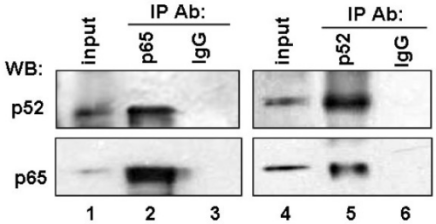
IP Ab: p65
Input: A band is present for p65, indicating its expression in the cell lysate.
IP: No band is present for p65 in the IgG IP lane, suggesting that IgG does not precipitate p65 specifically.
IP Ab: p52
Input: Bands are present for both p52 and p65, indicating their expression in the cell lysate.
IP: Bands are present for both p52 and p65 in the p52 IP lane, suggesting that p52 is associated with or bound to p65.
Conclusion:
The results indicate that p52 is capable of immunoprecipitating p65, suggesting an interaction between p52 and p65.
IgG does not immunoprecipitate p65, which serves as a negative control, confirming the specificity of the interaction detected by the p52 antibody.
4.
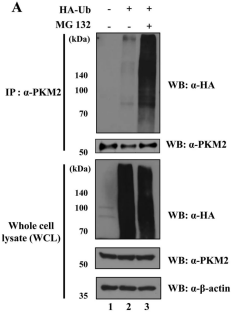
IP: α-PKM2
Input: The presence of HA-Ub and MG 132 in the input lanes indicates that these proteins are expressed in the cell lysate.
IP: Bands corresponding to HA-Ub and MG 132 are present in the IP lane when α-PKM2 antibody is used, suggesting that these proteins are immunoprecipitated by the α-PKM2 antibody, indicating an interaction or association between PKM2 and these proteins.
Whole Cell Lysate (WCL):
WB: α-HA A strong band is present in all lanes, indicating high expression levels of HA-Ub.
WB: α-PKM2 Bands are present in lanes 2 and 3, corresponding to the IP with α-PKM2, suggesting that PKM2 is present in the immunoprecipitate and interacts with HA-Ub and/or MG 132.
WB: α-β-actin A band is present in all lanes, serving as a loading control to ensure equal protein loading.
Conclusion:
The results suggest that PKM2 interacts with HA-Ub and MG 132, as evidenced by their co-immunoprecipitation with PKM2.
The presence of bands in the whole cell lysate indicates that the proteins are expressed and present in the cell lysate.
The β-actin control confirms equal loading and transfer efficiency across the samples.
5.
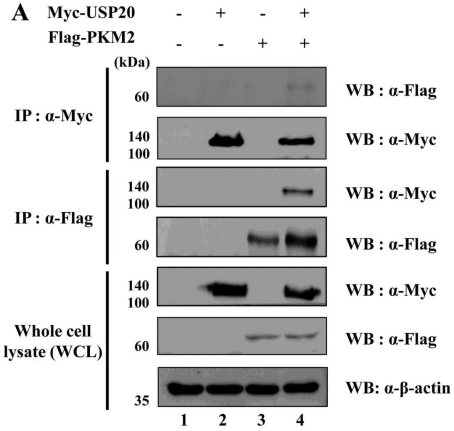
IP: α-Myc
Input: Bands are present for both Myc-USP20 and Flag-PKM2 in the input lanes, indicating that these proteins are expressed in the cell lysate.
IP: Bands are present for both Myc-USP20 and Flag-PKM2 in the IP lanes, suggesting that these proteins are immunoprecipitated by the α-Myc antibody, indicating an interaction or association between Myc-USP20 and Flag-PKM2.
IP: α-Flag
Input: Bands are present for both Myc-USP20 and Flag-PKM2 in the input lanes.
IP: Bands are present for both Myc-USP20 and Flag-PKM2 in the IP lanes, suggesting that these proteins are immunoprecipitated by the α-Flag antibody, indicating an interaction or association between Myc-USP20 and Flag-PK2.
Conclusion:
The results suggest that Myc-USP20 interacts with Flag-PKM2, as indicated by the presence of bands in the IP lanes for both α-Myc and α-Flag.
The presence of bands in the input lanes ensures that the proteins are present and the amounts are sufficient for the IP.
The α-β-actin control is used to confirm that the samples were loaded equally and that the IP was performed under similar conditions.
6.
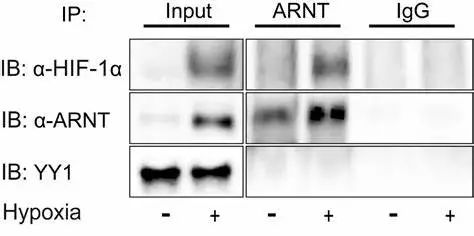
Input Control:
Bands for HIF-1α, ARNT, and YY1 are present in the input lanes, indicating that these proteins are expressed in the cell lysate.
IP: ARNT
Bands for HIF-1α and ARNT are present in the ARNT IP lane, suggesting an interaction between HIF-1α and ARNT.
A band for YY1 is also present in the ARNT IP lane, indicating that YY1 may also interact with ARNT or be part of the same protein complex.
IP: IgG (Negative Control)
No specific bands are present in the IgG IP lane, which is expected as IgG should not precipitate the proteins of interest non-specifically.
Effect of Hypoxia:
The presence or absence of hypoxia does not seem to significantly affect the interaction between HIF-1α and ARNT, as bands are present in both conditions.
The intensity of the YY1 band in the ARNT IP lane is slightly reduced under hypoxia, suggesting that hypoxia might influence the stability or abundance of the YY1-ARNT complex.
Conclusion:
HIF-1α and YY1 appear to interact with ARNT, as they are present in the ARNT IP lane.
Hypoxia does not seem to disrupt the interaction between HIF-1α and ARNT but may affect the level of YY1 in the complex.
7.
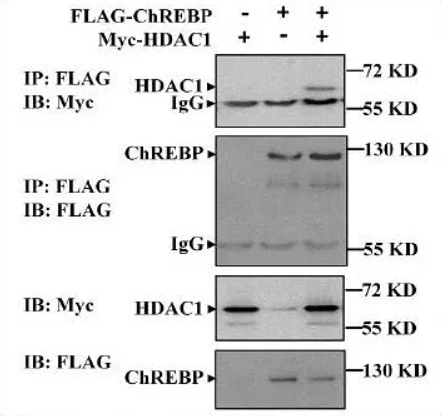
IP: FLAG\IB: Myc
A band is present in the lane where Myc-HDAC1 is present, indicating that Myc-HDAC1 is immunoprecipitated by the FLAG antibody and suggesting an interaction between FLAG-ChREBP and Myc-HDAC1.
IP: FLAG\IB: FLAG
Bands are present in the lanes where FLAG-ChREBP is present, confirming that FLAG-ChREBP is immunoprecipitated by the FLAG antibody.
IP: Myc\IB: Myc
Bands are present in the lanes where Myc-HDAC1 is present, confirming that Myc-HDAC1 is immunoprecipitated by the Myc antibody.
IP: Myc\IB: FLAG
Bands are present in the lane where FLAG-ChREBP is present, indicating that FLAG-ChREB is immunoprecipitated by the Myc antibody, which supports the interaction between FLAG-ChREBP and Myc-HDAC1.
Conclusion:
The results suggest that there is an interaction between FLAG-ChREBP and Myc-HDAC1, as both are co-immunoprecipitated in the respective IP experiments.
The presence of bands in the input lanes confirms that the proteins are present in the lysate before the IP.
The IgG control shows no specific bands, indicating that the IP is specific and not due to non-specific binding.
8.
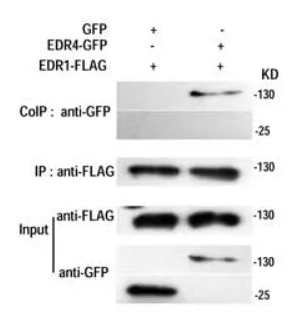
Co-Immunoprecipitation (CoIP): anti-GFP
A band is present in the lane where EDR1-FLAG is present, indicating that EDR1-FLAG is immunoprecipitated by the anti-GFP antibody and suggesting an interaction between EDR4-GFP and EDR1-FLAG.
IP: anti-FLAG
Bands are present in the lanes where EDR1-FLAG is present, confirming that EDR1-FLAG is immunoprecipitated by the anti-FLAG antibody.
A band is also present in the lane where EDR4-GFP is present, indicating that EDR4-GFP is immunoprecipitated by the anti-FLAG antibody, which supports the interaction between EDR4-GFP and EDR1-FLAG.
Input Control
Bands are present for all three proteins (GFP, EDR4-GFP, and EDR1-FLAG) in the input lanes, indicating successful expression of the proteins.
Conclusion:
The results suggest that there is an interaction between EDR4-GFP and EDR1-FLAG, as indicated by the presence of bands in the IP lanes for both antibodies.
The presence of bands in the input lanes ensures that the proteins are present and the amounts are sufficient for the IP.
The specific interactions need further validation, possibly through additional assays such as co-immunoprecipitation or yeast two-hybrid assays.
9.
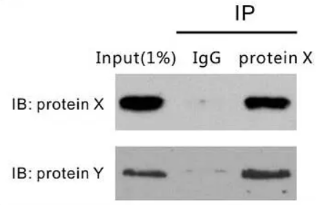
Input Control:
Bands are present for both protein X and protein Y in the input lanes, indicating that these proteins are expressed in the cell lysate.
IP: protein X
A band is present for protein X in the protein X IP lane, confirming that protein X is immunoprecipitated by the specific antibody against protein X.
A band is also present for protein Y in the protein X IP lane, suggesting that protein Y interacts with protein X and is co-immunoprecipitated.
IP: IgG (Negative Control)
No specific bands are present for protein X or protein Y in the IgG IP lane, which is expected as IgG should not precipitate the proteins of interest non-specifically.
Conclusion:
The results suggest that protein X interacts with protein Y, as protein Y is co-immunoprecipitated with protein X.
The presence of bands in the input lanes ensures that the proteins are present and the amounts are sufficient for the IP.
The absence of bands in the IgG IP lane confirms the specificity of the interaction detected.
10.
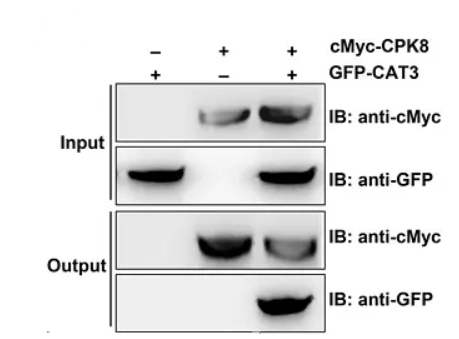
Input Control:
Bands are present for both cMyc-CPK8 and GFP-CAT3 in the input lanes, indicating that these proteins are expressed in the cell lysate.
Output:
Bands are present for both cMyc-CPK8 and GFP-CAT3 in the output lanes, suggesting that these proteins are present after the co-immunoprecipitation process.
IP: cMyc-CPK8
IB: anti-cMyc A band is present in the lane where cMyc-CPK8 is present, confirming that cMyc-CPK8 is immunoprecipitated by the anti-cMyc antibody.
IB: anti-GFP A band is present in the lane where GFP-CAT3 is present, indicating that GFP-CAT3 is immunoprecipitated by the anti-GFP antibody.
Conclusion:
The results suggest that there is an interaction between cMyc-CPK8 and GFP-CAT3, as both proteins are present in the output lanes after the co-immunoprecipitation process.
The presence of bands in the input lanes ensures that the proteins are present and the amounts are sufficient for the IP.
The specific interactions need further validation, possibly through additional assays such as co-immunoprecipitation or yeast two-hybrid assays.
11.
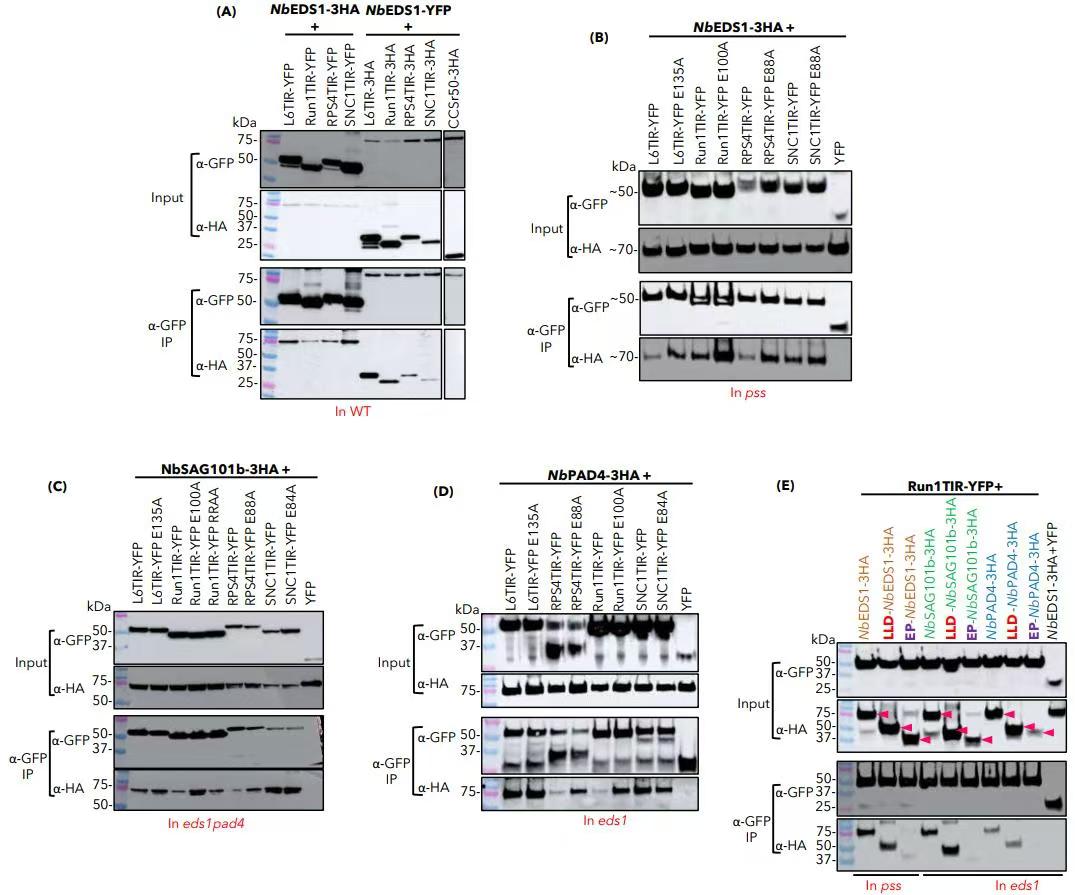
Panel A: NbEDS1-3HA + NbEDS1-YFP
Input: The presence of both NbEDS1-3HA and NbEDS1-YFP is confirmed in the input lanes, indicating successful expression of these proteins in the cell lysate.
Co-IP: Bands are present for both NbEDS1-3HA and NbEDS1-YFP in the Co-IP lane, suggesting an interaction between these two proteins. The presence of bands in the Co-IP lane indicates that NbEDS1-3HA and NbEDS1-YFP are co-immunoprecipitated, which is consistent with an interaction between these proteins.
Panel B: NbEDS1-3HA+
Input: The presence of NbEDS1-3HA is confirmed in the input lane.
Co-IP: Bands are present for NbEDS1-3HA in the Co-IP lane, indicating successful immunoprecipitation of NbEDS1-3HA. The presence of bands in the Co-IP lane suggests that NbEDS1-3HA is interacting with another protein, although the identity of the interacting protein is not provided in this panel.
Panel C: NbSAG101b-3HA+
Input: The presence of NbSAG101b-3HA is confirmed in the input lane.
Co-IP: Bands are present for NbSAG101b-3HA in the Co-IP lane, indicating successful immunoprecipitation of NbSAG101b-3HA. The presence of bands in the Co-IP lane suggests that NbSAG101b-3HA is interacting with another protein, although the identity of the interacting protein is not provided in this panel.
Panel D: NbPADA3HA+
Input: The presence of NbPADA3HA is confirmed in the input lane.
Co-IP: Bands are present for NbPADA3HA in the Co-IP lane, indicating successful immunoprecipitation of NbPADA3HA. The presence of bands in the Co-IP lane suggests that NbPADA3HA is interacting with another protein, although the identity of the interacting protein is not provided in this panel.
Panel E: Run1TR-YFP+
Input: The presence of Run1TR-YFP is confirmed in the input lane.
Co-IP: Bands are present for Run1TR-YFP in the Co-IP lane, indicating successful immunoprecipitation of Run1TR-YFP. The presence of bands in the Co-IP lane suggests that Run1TR-YFP is interacting with another protein, although the identity of the interacting protein is not provided in this panel.
Conclusion:
The results suggest that there are interactions between the proteins tested, as indicated by the presence of bands in the Co-IP lanes.
The presence of bands in the input lanes ensures that the proteins are present and the amounts are sufficient for the Co-IP.
The specific interactions need further validation, possibly through additional assays such as co-immunoprecipitation or yeast two-hybrid assays.
- Wang, S, Dong, J, Wang, S, Shi, X, Wang, S and Li, L(2024). Co-Immunoprecipitation (Co-IP) using pAN580 in Nicotiana benthamiana or Rice Protoplasts. Bio-protocol Preprint. 10.21769/p2756.
Do you have any questions about this protocol?
Post your question to gather feedback from the community. We will also invite the authors of this article to respond.
 Post a Question


