
- Home
- Protocols

-


Establishment and verification of a calibration method to determine the performance of Echo liquid-handling systems

Last updated date: Sep 27, 2024 DOI: 10.21769/p2719 Views: 202 Forks: 0
 Download PDF
 Ask a
question
Ask a
question
 How to
cite
How to
cite
 Favorite


Establishment and verification of a calibration method to determine the performance of Echo liquid-handling systems
Sun Mengsi1,3#, Lu Hailin1#, Wang Yi2, Hu Jiying1 *
1Biomedical Research Core Facilities, Shenzhen Bay Laboratory, Shenzhen 518000, China 2Centre of Translational Research, Shenzhen Bay Laboratory, Shenzhen 518000, China
3College of Horticulture and Landscape, Hunan Agricultural University, no.1 Nongda Road, Furong District, Changsha, Hunan 410000,China.
#These authors contributed equally
*Correspondence address. Tel: +86-755-26849227; E-mail: hujy@szbl.ac.cn
Automated high-throughput liquid handling systems have revolutionized various research fields by offering efficient and precise liquid transfer capabilities. These systems significantly improved the speed, accuracy, and reproducibility of experimental workflows by enabling the transfer of small liquid volumes between multiple samples [1-3]. Liquid-handling nano-dispensing devices can be generally classified as either contact or non-contact based on their delivery mechanism. Contact liquid handling involves physically contacting the pipette tip with the liquid surface in the source and target containers, bringing the risk of cross-contamination and compromising the accuracy and reproducibility of experiments. Non-contact liquid handling utilizes techniques such as acoustic or pneumatic droplet formation to transfer liquid without physical contact between the tip and the sample. This approach is particularly suitable for dispensing small volumes, in the nanoliter range, of reagents and samples, which is highly useful for high-throughput screening (HTS) applications and single-cell analysis, where minimal contamination and efficient liquid transfer are paramount.
Echo is a kind of non-contact liquid handling system which utilizes acoustic droplet ejection (ADE) technology [4]. This innovative system employs sound waves to generate and eject small droplets of liquid from a source plate to a destination plate. The volume of each droplet is controlled by the energy of the acoustic wave, while the number of droplets ejected is determined by the duration of the acoustic pulse. Echo ejects droplets in 2.5 nL or 25 nL increments, depending on the specific device model [4]. Echo has demonstrated superior accuracy, precision, and efficiency in liquid handling applications, including drug discovery, genomics, and synthetic biology.
Echo should undergo consistent and periodic calibration to ensure reproducibility, especially following any maintenance or repairs. This ensures consistent performance over time and mitigates the risk of inaccurate liquid transfers. Ideally, routine calibration protocols should be fast, cost-effective, and provide robust data on precision and accuracy across different laboratory settings. Precision, also referred to as reproducibility or repeatability, measures the closeness of a series of measurements to one another, irrespective of their proximity to the true value [5]. The relative standard deviation (RSD) or coefficient of variation (CV) is a commonly accepted parameter for assessing precision, expressed as a percentage. In drug discovery applications, a CV of less than 10% is often considered acceptable, although specific experiments and study requirements may dictate a need for a CV of less than 5% to ensure sufficient precision [5]. Accuracy, on the other hand, refers to the closeness of the actual drop volume to the target drop volume. It is calculated as the standard error (SE) of the expected volume using the formula SE = 100%*(mean-target)/target [5]. A robust correlation between the actual and predicted dispensed volume is vital to evaluate accuracy. For most applications, standard errors of less than 5% are deemed acceptable.
Typically, the confirmation of dispensed volumes in automated liquid handlers can be carried out by gravimetric, fluorometric, or photometric approaches[6]. Gravimetric measurements may not be reliable for assessing the accuracy of liquid handling nanodispensing devices, necessitating specialized conditions or equipment [6]. Fluorescence-based methods rely on a concentration measurement of a fluorophore and are often utilized for small volume calibration. However, fluorescence probes are typically expensive; for example, Oregon Green 488 (Invitrogen, USA) costs 64 euros per 10 mg [7]. Such expenses are impractical for routine calibration procedures. Additionally, certain fluorescence probes may exhibit instability over time, leading to variations in signal intensity.
Here, we introduced a rapid, efficient, and cost-effective absorbance-based calibration protocol for the routine and periodic calibration of Echo. The proposed protocol is based on absorbance measurements using tartrazine, a stable and economical probe with desirable properties. The calibration protocol comprises three main steps: (i) preparation of stock solutions and corresponding working solutions, (ii) generation of a calibration curve relating tartrazine concentration to absorbance, and (iii) calibration of Echo's performance based on the preceding steps (Figure 1). The entire protocol can be completed in approximately one hour, including the calibration curve generation.
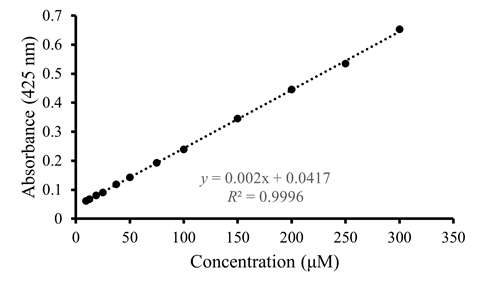
To construct a calibration standard curve, 1 mL and 0.75 mL of a 5 mM tartrazine (MedChemExpress, USA) stock solution in DMSO were diluted into 50 ml of 1x PBS, resulting in a 100 µM working solution A and a 75 µM working solution B, respectively. Subsequently, serial dilutions were performed to obtain working solutions of 50 μM, 25 μM, and 12.5 μM from solution A, as well as 37.5 μM, 18.75 μM, and 9.375 μM from solution B. These prepared working solutions were dispensed into individual wells of a clear 96-well plate (CLS3599, Corning, USA), with each well receiving 50 μl of the solution. The standard curve plate was centrifuged at 500*g for one minute and then incubated at room temperature for 30 minutes to ensure optimal conditions before absorbance measurements were taken at 425 nm using a Synergy H1 microplate reader (BioTek, USA) (Figure 1). The standard curve was generated by performing a linear fit of the tartrazine concentrations against the corresponding absorbance values. The slope, intercept, and R2 value of the standard curve were also determined (Figure 2). The comprehensive results obtained from the experiments are summarized in Table 1. Analysis of Table 1 reveals that the CV values associated with the manually diluted standard curve were consistently low, predominantly below 5%. This outcome signifies exceptional stability in the process of manual dilution.
Subsequently, an Echo test plate was meticulously prepared to assess the performance of the Echo system. Initially, 50 μl of a 5 mM stock solution of tartrazine in DMSO was manually dispensed into a Echo qualified 384-well polypropylene (PP) plate (PP-0200, Labcyte, USA), serving as the designated source plate. Employing the Echo plate reformat program, 250 nL of tartrazine were transferred to each well of a 96-well destination plate (CLS3599, Corning, USA), followed by the manual addition of 49.75 μl of 1x PBS to each well. The Echo test plate was then subjected to centrifugation at 500*g for one minute, and subsequent incubation at room temperature for 30 minutes, enabling optimal conditions prior to absorbance measurements at 425 nm using a Synergy H1 microplate reader (BioTek, USA). The recorded absorbance values from the Echo test plate were subsequently compared against the standard curve, allowing for the evaluation of the Echo system's performance. In essence, the absorbance values were utilized to calculate the actual drop volumes through the application of a linear equation derived from the fitting of the standard curve. Precision and accuracy were subsequently determined by employing the respective formulas as described in Table 1. As illustrated in Table 1, the results revealed an impressive precision value of 3.1% and an accuracy value of 1.3%, both well within the acceptable range of 5% or lower. These findings provide strong evidence of the Echo system's high accuracy and stability in liquid transfer.
Routine calibration of liquid-handling nano-dispensing devices is crucial to maintain reproducibility and accuracy in experimental workflows. The proposed calibration protocol utilizing tartrazine presents a rapid, efficient, and cost-effective alternative to traditional gravimetric or expensive fluorescence-based methods for calibrating the Echo system. This protocol can be implemented on a routine basis in HTS laboratories, promoting consistent and reproducible screening results and establishing the reliability of the equipment across different users. Moreover, in the event of observed or suspected issues with liquid dispensing, this calibration protocol should be employed to address and rectify any potential deviations.
Funding
This work was supported by the Shenzhen Postdoctoral Research Funding.
Conflict of Interest
The authors declare that they have no conflict of interest.
References
- Saitoh S, Yoshimori T. Fully Automated Laboratory Robotic System for Automating Sample Preparation and Analysis to Reduce Cost and Time in Drug Development Process. J Assoc Lab Autom 2008, 13: 265-74
- Tegally H, San JE, Giandhari J, de Oliveira T. Unlocking the efficiency of genomics laboratories with robotic liquid-handling. BMC Genomics 2020, 21: 729
- Capelle MA, Gurny R, Arvinte T. High Throughput Screening of Protein Formulation Stability: Practical Considerations. Eur J Pharm Biopharm 2007, 65: 131-148
- Nebane NM, Coric T, McKellip S, Woods L, Sosa M, Rasmussen L, Bjornsti MA, et al. Acoustic Droplet Ejection Technology and Its Application in High-Throughput RNA Interference Screening. J Lab Autom 2016, 21: 198-203.
- Rose D. Microdispensing technologies in drug discovery. Drug Discov Today 1999, 4: 411-419.
- Bessemans L, Jully V, de Raikem C, Albanese M, Moniotte N, Silversmet P, Lemoine D. Automated Gravimetric Calibration to Optimize the Accuracy and Precision of TECAN Freedom EVO Liquid Handler. J Lab Autom 2016, 21: 693-705.
- Rodríguez-Puente S, Linacero-Blanco J, Guasch A. A simple and effective calibration method to determine the accuracy of liquid-handling nano-dispenser devices. Acta Crystallogr Sect F Struct Biol Cryst Commun 2013, 69: 336-341.
Table 1. Standard curve and calibration results of Echo.
Standard Curve | ||||
Concentration (µM) | Drop volume (nL) | Average Abs (425nm) | CV (%) |
|
9.375 | 93.75 | 0.065 | 6.1 |
|
12.5 | 125 | 0.068 | 4.9 |
|
18.75 | 187.5 | 0.081 | 1.8 |
|
25 | 250 | 0.096 | 2.5 |
|
37.5 | 375 | 0.118 | 1.6 |
|
50 | 500 | 0.142 | 2.0 |
|
75 | 750 | 0.194 | 5.0 |
|
100 | 1000 | 0.246 | 3.9 |
|
| Echo Test | ||||
Target volume (nL) | Mean actual volume (nL) | Average Abs (425 nm) | CV (%) | SE (%) |
250 | 253.2 | 0.095 | 3.1 | 1.3 |
The precision is expressed as the coefficient of variability (CV) in percentage units. The accuracy is calculated as the standard error (SE) of the coefficient between the‘mean actual volume’ and the target volume. CV (%) = 100 (σ/μ), where σ and μ are the standard deviation and the mean value, respectively. SE (%) = 100 [(actual-target)/target].
Figure 1. Diagram showing a schematic representation of the workflow of the calibration protocol.
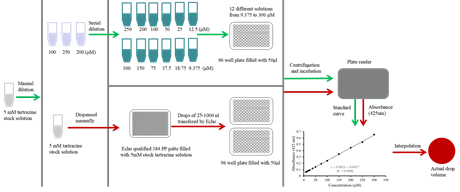
Figure 2. Standard curve of absorbance of 425nm versus tartrazine concentration. The overall regression curve for concentrations in the range 9.375-100 μM is shown.
- SUN, m, HU, j, Lu, h and Wang, y(2024). Establishment and verification of a calibration method to determine the performance of Echo liquid-handling systems. Bio-protocol Preprint. 10.21769/p2719.
Do you have any questions about this protocol?
Post your question to gather feedback from the community. We will also invite the authors of this article to respond.
 Post a Question


