
- Home
- Protocols

-

Bacterial quantification
Last updated date: Apr 11, 2023 Views: 202 Forks: 0
Expanded protocols for Bacterial quantification from:
Characterization of cerebrospinal fluid (CSF) microbiota from patients with CSF shunt infection and reinfection using high throughput sequencing of 16S ribosomal RNA genes.
Whitlock, K. B., C. E. Pope, P. Hodor, L. R. Hoffman, D. L. Limbrick, P. J. McDonald, J. S. Hauptman, J. G. Ojemann, T. D. Simon and Cerebrospinal FLuId MicroBiota in Shunts Study Group (CLIMB) Group (2021).
PLoS One. 2021 Jan 6;16(1):e0244643. doi: 10.1371/journal.pone.0244643. PMID: 33406142; PMCID: PMC7787469.
Background.
These expanded protocols describe, in detail, the quantification of the total bacteria load from purified DNA samples using the real-time detection of PCR amplicons. Quantification of these PCR amplicons is enabled by the inclusion of a fluorescent reporter molecule in each reaction well. Fluorescence intensifies with the increasing amount of PCR amplicon. The reaction and recording of the resulting fluorescence are carried out using a Real-Time PCR Detection System (e.g., Bio-Rad CFX96 Touch Real-Time PCR Detection System, Roche LightCycler 480 Real-Time PCR System, Qiagen Rotor-Gene Q Real-Time PCR System). The results from samples with known quantities of amplicon targets are compared to a standard curve comprising of a known quantity of bacterial genome copies enabling the quantification of the total bacterial load in these samples.
Note: These protocols describe the use of specific pieces of equipment and reagents from named suppliers. Alternatives can of course be used. The authors have no affiliation with the companies described in these protocols.
Reagents, media, supplies, and equipment:
• 1.5- or 2.0-mL sterile microfuge tubes (e.g., USA Scientific, Cat. # 1615-5510)
• Adjustable pipettors and tips
• Blood Agar (TSA w/5% Sheep Blood; Remel, Cat. # R111007)
• DNA-Erase™ Decontamination Solution (VWR, Cat.#IC821805)
• DNeasy Blood and Tissue Kit (50), (Qiagen, Cat. # 69504)
• Dry block incubator (Thermo Scientific, Cat.# 88870006)
• EDTA 0.5M pH 8.0 (Invitrogen, Cat. # 15575-038)
• Ethanol, Absolute (200 Proof, Molecular Grade) (Decon Labs, Cat. # 71006-012)
• Freezer: -80°C
• Lysozyme (5 g) (MilliporeSigma, Cat. # L6876-5G)
• Microcentrifuge
• Molecular grade water, sterile (Corning, Cat. # 46000CV)
• Phosphate Buffered Saline (PBS) 1X pH 7.4 (Gibco, Cat. # 10010031)
• PowerUp SYBR Green Master Mix (Applied Biosystems, Cat. # A25779)
• Proteinase K, supplied in DNeasy Blood and Tissue Kit (below)
• qPCR 16S rRNA gene Primers
· Forward: 5' TCCTACGGGAGGCAGCAGT '3
· Reverse: 5' GGACTACCAGGGTATCTAATCCTGTT 3'
Reagents, media, supplies, and equipment- continued:
• qPCR optical PCR reaction tubes, suitable for the machine to be used.
• Quant-iT Qubit dsDNA BR Assay Kit:
· dsDNA BR Standards (Invitrogen, Cat. # Q33263)
· dsDNA BR Working solution (Invitrogen, Cat. # Q33262)
• Qubit 4 Fluorometer (Invitrogen, Cat.# Q33238)
• Qubit Assay Tubes (Invitrogen, Cat. # Q32856)
• Sterile cotton swabs (Fisher, Cat. # 22363173)
• Streptococcus mitis NCTC-12261 (American Type Culture Collection, Cat. # 49456)
• Syringe filter unit 0.22 μm (33 mm) (MilliporeSigma, Cat. # SLGPR33RS) and syringe
• Thin walled 0.2 mL PCR tubes
• Tris-HCl 1M pH 8.0 (Invitrogen, Cat. # AM9856)
• Triton X-100
Contents
1. Culture of S. mitis
2. Extraction of the DNA from 1 mL of S. mitis suspended in PBS.
3. Qubit fluorometric DNA quantification.
4. Dilution and storage of S. mitis DNA.
5. 16S rRNA gene qPCR for the prediction of bacterial genome equivalents (GE) in DNA extracted samples.
5.1 Preparing the Assay Standard Curve from purified S. mitis stock DNA (20 ng/μL).
5.2 Setting up the reaction tubes for qPCR analysis.
5.3 Data analysis
5.3.1 Quality Control (QC) of the qPCR controls, standards, and unknown samples
5.3.2 Converting qPCR results to express GE per mL of the original sample.
Procedures
1. Culture of S. mitis
1.1 A pure stock of S. mitis stored in LB broth with 20% glycerol at -80°C was sub-cultured onto blood agar (5% sheep’s blood) and incubated aerobically, overnight at 37°C.
1.2 The next day, the plate was visually checked for culture purity, indicated by the presence of uniform colony morphology (Table 1).
Table 1: Colony and growth appearance of S. mitis on blood agar
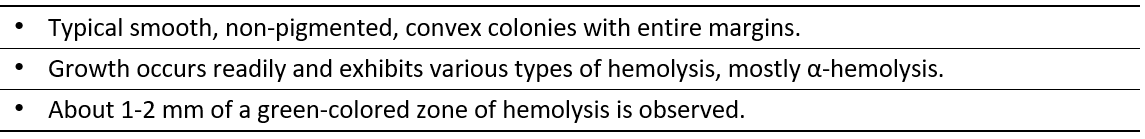
1.3 The resulting growth was harvested from the plate using a sterile cotton swab and suspended in 1 ml of PBS to an OD600 of approximately 1.00. This suspension was then used in the DNA extraction protocol: 2. Extraction of the DNA from 1 mL of S. mitis suspended in PBS.
2. Extraction of the DNA from 1 mL of S. mitis suspended in PBS.
From the DNeasy® Blood and Tissue Handbook July 2020 (Qiagen).
2.1 Pellet the suspended cells, from Step 1.3, in a microcentrifuge tube by centrifuging for 10 min at 5000 x g (7500 rpm). Discard supernatant.
2.2 Resuspend the pellet in 180 µl of Enzymatic Lysis Buffer (Table 2) and add 20 µl of lysozyme (stock:180 mg/mL) to a final concentration of 20 mg/ml.
Table 2: Enzymatic lysis buffer
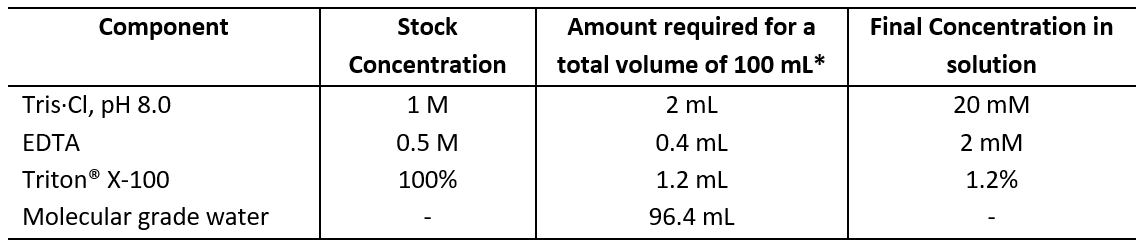
* Filter sterilize using a 0.22μm syringe filter.
2.3 Incubate the suspension for 30 min at 37°C.
2.4 To the suspension, add 25 μl proteinase K, then 200 µl Buffer AL. Mix thoroughly by vortexing and incubate at 56°C for 30 min.
2.5 Add 200 μl ethanol (96–100%), mix thoroughly by vortexing.
2.6 Pipet the mixture from step 2.5 into the DNeasy Mini spin column placed in a 2 ml collection tube. Centrifuge at 6000 x g (8000 rpm) for 1 min. Discard flow-through and collection tube.
2.7 Place the DNeasy Mini spin column in a new 2 ml collection tube, add 500 μl of Buffer AW1, and centrifuge for 1 min at 6000 x g (8000 rpm). Discard flow-through and collection tube.
2.8 Place the DNeasy Mini spin column in a new 2 ml collection tube add 500 μl of Buffer AW2, and centrifuge for 3 min at 20,000 x g (14,000 rpm) to dry the DNeasy membrane. Discard flow-through and collection tube.
2.9 Place the DNeasy Mini spin column in a clean, sterile 1.5 ml or 2 ml microcentrifuge tube and pipet 200 μl Buffer AE directly onto the DNeasy membrane. Incubate at room temperature for 1 min, and then centrifuge for 1 min at 6000 x g (8000 rpm) to elute.
2.10 Continue on to the protocol: 3. Qubit fluorometric DNA quantification or store the DNA at -80°C until required.
3. Qubit fluorometric DNA quantification.
The DNA quantification protocol follows the instructions provided by Invitrogen for the Qubit dsDNA (Broad Range) BR Assay kit.
3.1 Set up the required number of thin-wall, clear 0.5 mL PCR tubes for the 2 standards and samples to be measured.
3.2 Label the lids of two standard tubes as S1 (Standard 1) and S2 (Standard 2) and additional assay tubes with the appropriate identification number for each sample to be tested.
3.3 Prepare the standard and sample assay tubes according to table 3.
Table 3: Qubit Assay Tube set up
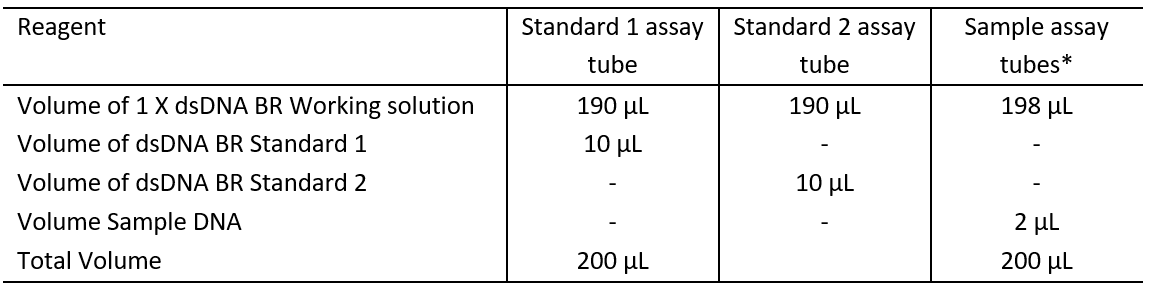
*If a larger volume of DNA is added to the assay, reduce the volume of 1 X dsDNA BR Working solution by the volume of DNA added above 2 μL.
3.4 Mix the standard and sample tubes by vortexing gently for 2-3 seconds. Be careful not to create bubbles.
3.5 Incubate all tubes at room temperature for 3 minutes in the dark
3.6 Following the instructions for the Qubit 4 Fluorometer read the tubes containing Standard 1 and Standard 2.
3.7 The Fluorometer is ready to read the DNA concentration of your sample DNA.
3.8 Record the DNA concentrations as ng/μL of DNA.
3.9 Proceed on to 4. Dilution and Storage of S. mitis DNA
4. Dilution and storage of S. mitis DNA
4.1 Using the Qubit DNA Concentration results adjust the concentration of S. mitis stock DNA to 20 ng/μL in the Qiagen AE buffer from step 2.9 from the protocol: 2.Extraction of the DNA from 1 mL of S. mitis suspended in PBS.
4.2 Aliquot 20 μL of this DNA into thin walled 0.2 mL PCR tubes. Label and store at -80°C until required.
5. 16S rRNA gene qPCR for the prediction of bacterial genome equivalents (GE) in DNA extracted samples.
5.1 Preparing the Assay Standard Curve from purified S. mitis stock DNA (20 ng/μL).
Notes on the S. mitis standard-curve.
- The original protocol used an in-house S. mitis strain which cannot be shared. For this protocol we have described using the readily available S. mitis type strain NCTC-12261 which has a slightly smaller genome than the strain used in the publication. This, however, does not change the validity of this assay.
- The standard curve is made fresh each day.
- The standard curve is run as a 1:10 dilution series between 20,000-pg to 0.2-pg of S. mitis genomic DNA.
- GE/μL was calculated using the “Calculator for determining the number of copies of a template” found at: https://cels.uri.edu/gsc/cndna.html, the calculator requires the genome size of the S. mitis type strain NCTC-12261 (1,868,883 -bp) and the DNA concentration of the stock DNA (20 ng/μL) as prepared in 4. Dilution and storage of S. mitis DNA.
- Using this calculation, the dilution series will be equivalent to 9.91 x 10⁶ - 9.91 x 101 genome equivalents (GE) per μL of S. mitis DNA.
- The assay is linear within this range. The limit of detection is 9.91x101 GE. The limit of quantification is 9.91x101 GE. Dilutions for the standard curve should be prepared with the same buffer used to elute DNA.
5.1.1 On ice, thaw the tube containing the 20 ng/μL stock of S. mitis genomic DNA.
5.1.2 Set up five microfuge tubes containing 45 μL of the AE elution buffer from the Qiagen DNeasy Mini kit. Label the first as 9.91 x 10⁵ GE and subsequently down to 9.91 x 101 GE. The 20 ng/μL stock DNA will represent the most concentrated standard sample of 9.91 x 10⁶ GE per μL of S. mitis.
5.1.3 Take 5 μL from the stock (20 ng/μL) S. mitis genomic DNA and add to the first tube containing 45 μL of the AE elution buffer. Mix well and spin the tube to collect all liquid from the sides of the tube.
5.1.4 Repeat step 5.1.3 using the DNA from this newly created DNA concentration. Continue as a serial dilution to the last tube representing 9.91x101. Keep the tubes on ice until required.
5.2 Setting up the reaction tubes for qPCR analysis.
5.2.1 Set up each reaction tube or well (if using a PCR plate) as described in Table 4.
Table 4: qPCR master mix reaction tube set up
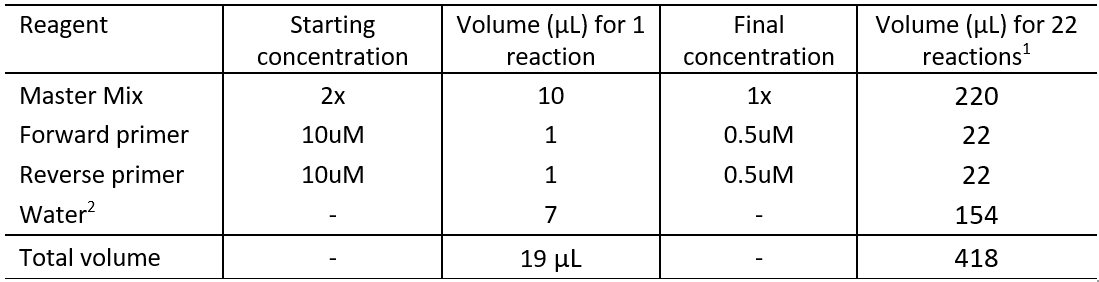
1This number of reactions is equivalent to 6 standard curve reactions in duplicate, a NTC in duplicate, 3 unknown samples (in duplicate), and two extra samples to consider pipetting errors.
2This protocol assumes 1 μL DNA template per reaction. The volume of water should be adjusted accordingly if other DNA volumes are used.
5.2.2 Also include, in duplicate, a No template Control (NTC) tube. This is the negative control.
5.2.3 Aliquot 19 μL of the master mix to each reaction tube/well.
5.2.4 Add 1 μL of DNA to the appropriate reaction tube/well.
5.2.5 Add 1 μL of AE buffer from the Qiagen DNeasy DNA extraction kit to the NTC tube.
5.2.6 Seal the reaction tubes/wells.
5.2.7 Run the assay on the Real-Time PCR Detection System of choice using these running conditions:
95°C 3 mins then [95°C 1min + 60°C 1 min]40 cycles
5.3 Data Analysis
5.3.1 Quality Control (QC) of the qPCR controls, standards, and unknown samples
Once the qPCR is complete the results must pass a set of QC parameters to be considered valid:
- The Cq difference between standard and unknown sample replicates and must not exceed 0.5.
- The Cq value is the PCR cycle number at which your sample’s reaction curve intersects the threshold line.
- The PCR efficiency of the standard curve must be >0.9 and <1.05
- PCR efficiency refers to whether the qPCR displays a doubling of florescence detection and is an indicator of correct PCR efficiency. This value is calculated using the results from the standard curve.
- The R2 of the curve must be ≥0.98
- R2 is an indicator of how well your standard curve results fit the predicted standard curve slope.
- The NTC must not amplify less than three cycles after the assay limit of detection.
Note: It’s not unusual for the no template control (NTC) to display an amplification curve with 16S rRNA targets qPCR.
e. Amplification of the unknown samples must occur between the highest standard and the limit of quantification.
· Samples where the unknown sample assay amplifies before the highest standard dilute the unknown sample DNA 1:10 or higher (depending on how early it amplified) and repeat the qPCR.
· Samples where the assay amplifies below the limit of quantification repeat the qPCR using 2-5 μL of template DNA.
· Remember to adjust the amount of water in the reaction according to how much more or less DNA is added to the tube (Table 4).
5.3.2 Converting qPCR results to express GE per mL of the original sample.
- Results from the qPCR are expressed in Genome Equivalents (GE). This represents the number of GE in the volume added to the qPCR assay. These results should be converted to express GE per mL of CSF (for e.g.).
- The duplicate GE values for each sample are averaged. These results are used to calculate the GE of the total bacterial load present in the original sample.
- The conversion is achieved by using the formula displayed in table 5, here each component of the formula is described.
Table 5: Formula to convert qPCR quantification results to GE per volume of sample
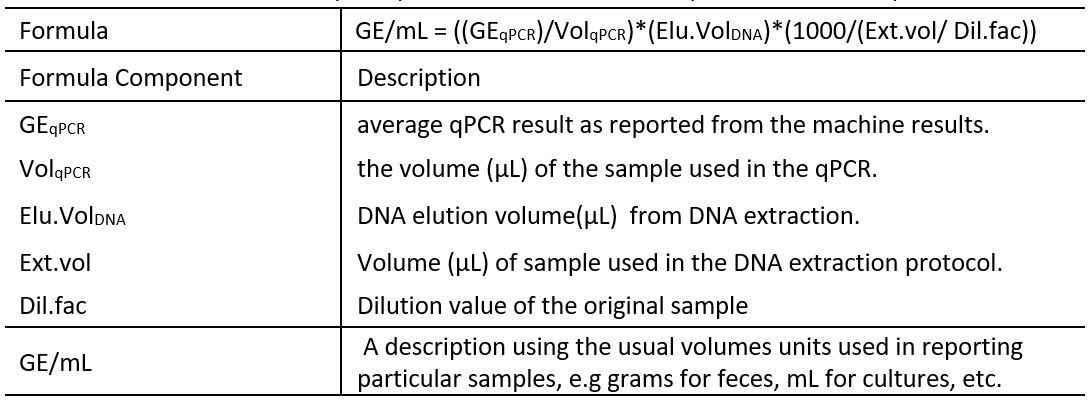
Table 6 shows an example of the values required to calculate the GE/mL of CSF.
Table 6: Example calculation using the GE conversion formula of qPCR results.
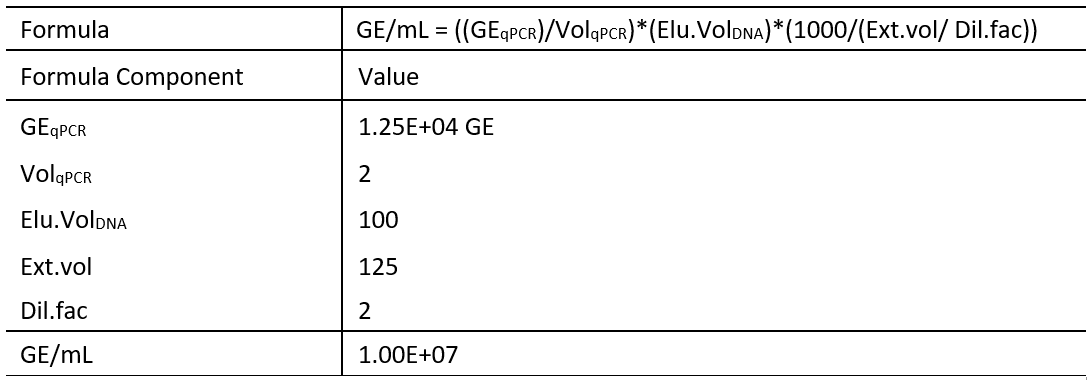
In this example DNA was extracted from 125 μL (Ext.vol) of CSF and the sample had been diluted 1:1 with PBS (Dil.fac).
The resulting purified DNA was eluted in 100 μL (Elu.VolDNA) of buffer. From this eluted DNA 2 μL (VolqPCR) was used in the qPCR to estimate the total bacterial load present in the original CSF sample.
The average GE returned from the qPCR for Sample-1 was 1.25E+04 GE (GEqPCR).
Using this information, it was possible to back calculate using the formula and report:
In the original CSF Sample-1 the total bacterial load was estimated to be 1.00E+07 GE/mL of CSF.
This completes the Expanded protocols for Bacterial quantification from the article:
Characterization of cerebrospinal fluid (CSF) microbiota from patients with CSF shunt infection and reinfection using high throughput sequencing of 16S ribosomal RNA genes.
- Pope, C and Simon, T(2023). Bacterial quantification. Bio-protocol Preprint. bio-protocol.org/prep2199.
- Whitlock, K. B., Pope, C. E., Hodor, P., Hoffman, L. R., Jr., D. L. L., McDonald, P. J., Hauptman, J. S., Ojemann, J. G. and Simon, T. D.(2021). Characterization of cerebrospinal fluid (CSF) microbiota from patients with CSF shunt infection and reinfection using high throughput sequencing of 16S ribosomal RNAgenes. PLoS ONE 16(1). DOI: 10.1371/journal.pone.0244643
Do you have any questions about this protocol?
Post your question to gather feedback from the community. We will also invite the authors of this article to respond.