
- Home
- Protocols

-

Detection of mitochondrial ROS levels using flow cytometry
Last updated date: Apr 3, 2023 Views: 854 Forks: 0
Xiaowei Zheng1, Sergiu-Bogdan Catrina1,2,3
1Department of Molecular Medicine and Surgery, Karolinska Institutet, Stockholm, Sweden.
2Department of Endocrinology and Diabetes, Karolinska University Hospital, Stockholm, Sweden.
3Center for Diabetes, Academic Specialist Centrum, Stockholm, Sweden
Background:
This protocol was used to analyze mitochondrial ROS levels in mIMCD-3 cells using MitoSOX Red Mitochondrial Superoxide Indicator (Thermo Fisher Scientific) on a Cyan ADP analyser (Beckman Coulter) (Zheng et al., 2022). Flow cytometry (FACS) analysis was performed using FlowJo software.
Cell culture:
mIMCD-3 cells were cultured in 6-well plate with 2 mL culture medium in each well.
Planning of the experiments:
Each experiment must have the following control samples. We used cells that were exposed to 30mM glucose in hypoxia for 24 hours as positive controls. Cells cultured under normal conditions were negative controls.
- Negative control_no MitoSOX Red staining. This sample is used for the basic FACS settings (FSC and SSC).
- Negative control_MitoSOX Red. This sample should have low MitoSOX Red fluorescent signal.
- Positive control_MitoSOX Red. This sample should have high MitoSOX Red fluorescent signal.
Preparation:
- MitoSOX Red Mitochondrial Superoxide Indicator, for live-cell imaging (ThermoFisher Scentific, #M36008)
- Aluminum foil
- Warm trypsin, PBS and culture medium
- Marked Eppendorf tubes (2.0 mL)
- Marked FACS tubes
- 10 ml tips and pipettes
- Timer
- FACS buffer: Dilute MACS BSA Stock Solution (Miltenyi Biotec # 130-091-376) 1:20 with autoMACS Rinsing Solution (Miltenyi Biotec # 130-091-222)
- Cell strainer 100 mm (Fisher Scientific, #11517532)
Note: MitoSOX Red is sensitive to light. Whenever possible
- Work fast to limit oxygen exposure.
- Minimize time when tubes/wells are wide open.
- Cover with aluminum foil where applicable.
MitoSOX Red staining and sample preparation for FACS analysis:
1) Prepare 5mM MitoSOX Red stock solution.
Add 13µL DMSO to each 50µg tube of MitoSOX, vortex.
(Important: protect from oxygenation by keeping the lid closes, and protect from light.)
2) Bring cells out from the incubator.
3) Immediately add 2.0 µL of 5mM MitoSOX Red stock solution to each well (2 mL medium, final concentration is 5 mM MitoSOX), and swirl to mix well. Be quick! Cover the plate with aluminum foil.
4) Incubate for 10 min in the 37C cell incubator.
5) Remove MitoSOX Red solution from the wells. Wash the cells once with 1ml PBS. Add 300µL Trypsin-EDTA to each well and incubate until cells detach (the same procedure as cell subculture).
6) Block Trypsin with 1mL medium in each well, make sure most of the cells are single cells and transfer to 2.0 mL Eppendorf tubes. Centrifuge @300Xg for 3min at room temperature (the same centrifugation protocol as cell subculture).
7) Remove supernatant, be careful not to dislodge the pellet. Resuspend in 0.8 mL PBS and Centrifuge again @300Xg for 3min at room temperature.
8) Remove supernatant again and resuspend in 0.5 mL FACS buffer. Filter through cell strainer and collect in FACS tubes. Cover with aluminum foil.
9) Run FACS immediately.
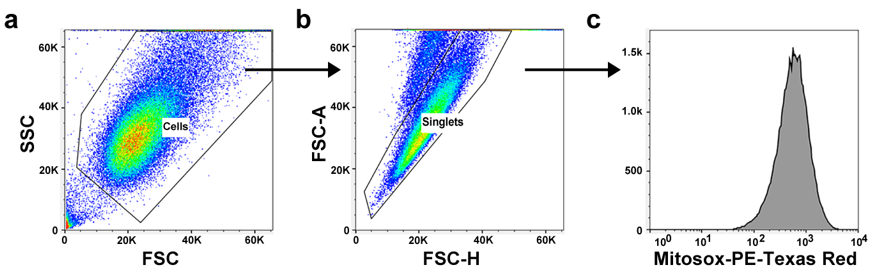
Flow Cytometry analysis of MitoSOX Red signal:
1) Set FSC and SSC to have most of the cells in the center of the plot (Fig. a). Select the cell population (P1).
2) Show P1 in FSC-H and FSC-A plot, and select Singlets (P2) (Fig. b).
3) Plot P2 in histogram of MitoSOX Red on PE-Texas Red (Fig. c). Adjust the FACS settings for the maximum difference in MitoSOX Red signal between negative and positive controls.
4) The median MitoSOX Red intensity indicates mitochondrial ROS levels in the cells.
Reference:
Zheng, X., Narayanan, S., Xu, C., Eliasson Angelstig, S., Grunler, J., Zhao, A., Di Toro, A., Bernardi, L., Mazzone, M., Carmeliet, P., et al. (2022). Repression of hypoxia-inducible factor-1 contributes to increased mitochondrial reactive oxygen species production in diabetes. Elife 11, e70714.
- Zheng, X and Catrina, S(2023). Detection of mitochondrial ROS levels using flow cytometry. Bio-protocol Preprint. bio-protocol.org/prep2187.
- Zheng, X., Narayanan, S., Xu, C., Eliasson Angelstig, S., Grünler, J., Zhao, A., Di Toro, A., Bernardi, L., Mazzone, M., Carmeliet, P., Del Sole, M., Solaini, G., Forsberg, E. A., Zhang, A., Brismar, K., Schiffer, T. A., Rajamand Ekberg, N., Botusan, I. R., Palm, F. and Catrina, S.(2022). Repression of hypoxia-inducible factor-1 contributes to increased mitochondrial reactive oxygen species production in diabetes. eLife. DOI: 10.7554/eLife.70714
Do you have any questions about this protocol?
Post your question to gather feedback from the community. We will also invite the authors of this article to respond.