
- Home
- Protocols

-

BIOMOL ATP hydrolysis assay
Last updated date: Sep 14, 2022 Views: 894 Forks: 0
[From Methods] ATP hydrolysis assay. Rad50 ATP hydrolysis assays were performed essentially as described by Boswell et al. (Boswell et al., 2018). 0-300 µM ATP was titrated into microfuge tubes containing either 2.5 µM MRNBD complex or 2 µM full-length MR complex and 50 mM Tris, 80 mM NaCl, 1% glycerol, 5 mM MgCl2, pH 7. Reactions without protein were included for each ATP concentration to control for ATP degradation and PO4 contamination. 60 µL reactions were incubated at 65 °C for 60 min after which the tubes were placed on ice. 50 µL of each reaction was then transferred to the wells of clear, flat-bottom 96-well plates and 100 µL of cold BIOMOL Green (Enzo Lifesciences) colorimetric reagent was added. After a 30 min incubation at room temperature to allow the color to develop, the amount of inorganic phosphate released by hydrolysis was quantified using the absorbance mode on a Synergy Neo2 multi-mode plate reader. BIOMOL Green signal (A640) was corrected by subtracting the A640 values of the ATP only reactions at each ATP concentration and then transformed into pmols of PO4 released/min based on a PO4 standard curve incubated in BIOMOL Green reagent for 30 min at room temperature. Plots of PO4 released/min (v0) versus ATP concentration were fit to the Michaelis-Menten equation including a Hill coefficient (n).
NOTES:
The Rad50 in the MR complex is notoriously slow at hydrolyzing ATP. This protocol works well for MR but may have disadvantages for proteins with faster hydrolysis rates.
The Mre11 and Rad50 proteins we use are from a hyperthermophilic organism, and so we must control for the background hydrolysis of ATP at the high temperatures where we incubate our reactions. Hence, the ‘ATP only’ titration control (reactions without protein).
The incubation times of the hydrolysis reactions and with the BIOMOL reagent must be optimized so that the BIOMOL Green A640 signal is in the linear portion of its development curve, before the complexed inorganic phosphate starts precipitating in the plate.
Stocks:
- 2X ATPase Buffer: 100 mM Tris pH 7.5, 160 mM NaCl, 2% glycerol, 10 mM MgCl2
- 1 mM ATP in 10 mM Tris pH 7.5
- 15 µM protein stock (here M2R2) in its storage buffer
- BIOMOL Green (Enzo cat# BML-AK111-1000), stored at 4 °C.
For 2 μM M2R2 hydrolysis reactions:
- For each titration, pipette 60 μL reactions into microfuge tubes (see scheme below).
- Also set up an ‘ATP only’ titration as a control (i.e., no protein): add 8 µL protein storage buffer to each reaction instead of protein.
- Spin tubes in microfuge to mix reactants.
- Incubate tubes for 60 min at 65 °C in heat block.
- Transfer tubes to ice for 2 min to stop the reaction.
- Spin tubes at max speed for 1 min to collect condensation.
- Transfer 50 µL of each sample into wells of a clear, flat-bottom 96-well plate.
- Add 100 µL cold BIOMOL Green reagent to each well.
- Start the 30 min timer, then spin down the plate (2 min at 500 x g).
- Incubate at room temp (should be close to 20 °C) for exactly 30 min.
- Read absorbance at 640 nm in BioTek Synergy Neo2 plate reader (with path length correction).
- Subtract the ‘ATP only’ A640 value at each ATP concentration from the A640 value of the corresponding ATP concentration in all of the titrations with protein.
- Then, using the values that resulted from Step 12, subtract the ‘0 ATP’ value from all other points in a given titration to get the corrected A640 values.
- Divide all of the corrected A640 values by the slope of the phosphate standard curve (see below).
- Finally, divide each value by 60 min to get units of nmol PO4/min.
- Plot nmol PO4 released/min versus ATP concentration and fit curves to the Michaelis-Menten equation including a Hill coefficient.
Pipetting scheme:
| Stock: | 0 ATP | 10 μM | 25 μM | 37.5 μM | 50 μM | 75 μM | 150 μM | 300 µM |
| 2X Buffer Mix | 30 μL | 30 | 30 | 30 | 30 | 30 | 30 | 30 |
| 1 mM ATP | -- | 0.6 μL | 1.5 | 2.25 | 3 | 4.5 | 9 | 18 |
| 15 µM M2R2 or Buffer | 8 μL | 8 | 8 | 8 | 8 | 8 | 8 | 8 |
| Water | 22 μL | 21.4 | 20.5 | 19.75 | 19 | 17.5 | 13 | 4 |
Inorganic phosphate standard curve (in triplicate):
- The 800 µM PO4 standard solution is provided with the BIOMOL Green reagent.
- Add 2.5 µL of 800 µM PO4 stock to 97.5 µL 1X ATPase Buffer (50 mM Tris pH 7.5, 80 mM NaCl, 1% glycerol, 5 mM MgCl2) in Well A for 20 μM PO4.
- Pipette 50 µL of Buffer into wells 2-8.
- Remove 50 µL from well A and add to B (A now at 50 µL and B at 100 µL). Mix.
- Remove 50 µL from well B and add to C (B now 50 µL and C at 100 µL). Mix.
- Repeat for wells C - G.
- Discard 50 µL from well G to leave 50 µL as the final volume.
- H is the blank: 50 µL Buffer only.
- Add 100 µL cold BIOMOL Green to each well, spin plate, and incubate at room temp for 30 min (this should be the same protocol as for the hydrolysis reactions above).
- Read absorbance at 640 nm in BioTek Synergy Neo2 plate reader (with path length correction).
| Wells | A | B | C | D | E | F | G | H |
| µM PO4 | 20 | 10 | 5 | 2.5 | 1.25 | 0.625 | 0.313 | 0 |
| nmol PO4 in well | 1 | 0.5 | 0.25 | 0.125 | 0.0625 | 0.031 | 0.015 | 0 |
Example of standard curve results:
nmol Pi | A640 | ||
1.000 | 0.720 | 0.731 | 0.744 |
0.500 | 0.436 | 0.464 | 0.449 |
0.250 | 0.261 | 0.273 | 0.268 |
0.125 | 0.186 | 0.183 | 0.181 |
0.0625 | 0.144 | 0.141 | 0.145 |
0.03125 | 0.130 | 0.127 | 0.130 |
0.015625 | 0.123 | 0.119 | 0.123 |
0.000 | 0.123 | 0.119 | 0.123 |
Plot of standard curve:
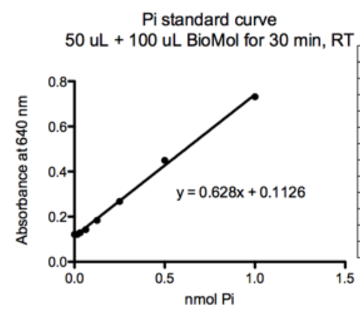
The BIOMOL Green literature states that Phosphate released = (OD640 – Yint)/slope.
Since the ‘0 ATP’ values (Yint) have already been subtracted from the A640 for each data point in the titration, solving for the PO4 reduces to just dividing the corrected A640 by the slope. Then divide that number by 60 min to get units of nmol PO4/min.

- Latham, M P and Canny, M D(2022). BIOMOL ATP hydrolysis assay. Bio-protocol Preprint. bio-protocol.org/prep1937.
- Canny, M. D. and Latham, M. P.(2022). LRET-derived HADDOCK structural models describe the conformational heterogeneity required for DNA cleavage by the Mre11-Rad50 DNA damage repair complex. eLife. DOI: 10.7554/eLife.69579
Do you have any questions about this protocol?
Post your question to gather feedback from the community. We will also invite the authors of this article to respond.