
- Home
- Protocols

-

Exercise training
Last updated date: Aug 4, 2022 DOI: 10.21769/p1842 Views: 906 Forks: 0
Drosophila exercise training
A Sujkowski, RJ Wessells and SV Todi.
The protocol described here was based on (Damschroder et al. 2018), www.bio- protocol.org/e3037. We provide below a distilled version of that protocol, modified for the specific experiments performed in (Sujkowski et al. 2022), in response to requests. The language and images provided come from, or are modified from (Damschroder et al. 2018), which was co-authored by AS and RJ Wessells., with RW being senior author.
Materials and Reagents
- Drosophila Vials (VWR, catalog number: 89092-722)
- Drosophila (Bloomington Drosophila Stock Center: https://bdsc.indiana.edu/)
- Carbon Dioxide
- ImageJ (National Institutes of Health, Bethesda, Maryland, USA)
- Fly Food made by experimenter (see Recipes)
- Brewer's Yeast (MP Biomedicals, catalog number: 903312)
- Sucrose (Sigma-Aldrich, catalog number: 84097-5KG)
- Agar (MoorAgar, catalog number: 41080)
- Methyl 4-hydroxybenzoate (Sigma-Aldrich, catalog number: H5501-5KG)
- Propionic Acid (Sigma-Aldrich, catalog number: P1386-1L)
Equipment
- Power Tower
- Jaece Identi-plugTM Plastic Foam Stopper (Fisher Scientific, Jaece, catalog number: 14-127-40C)
- 25C Incubator with 12h:12h light/dark timer
- Square Rectangular Grid Screen (Grainger, catalog number: 49N590)
- 10” Bungee Cord (Home Depot, catalog number: 56052)
- Bel-Art No Wire Test Tube Rack (Bel-Art, catalog number: F18745-0004)
- Traceable Nano Timer (Thermo Fisher Scientific, Fisherbrand, catalog number: 1464983)
- Camera
- Dissecting Microscope (Olympus, catalog number: SZ61)
- Hemostat Straight (Specialized products, part number 083X020)
Procedure
A. Power Tower Setup
Set up the Power Tower as displayed in Figure 1. For a detailed set up of the Power Tower refer to Tinkerhess et al. (Tinkerhess et al. 2012).
B. Endurance Training Protocol
1. Anesthetize flies using CO2 and collect 400 males for each genotype. Female flies have a blunted exercise response (Sujkowski et al. 2017), so males are better for evaluating genetic and pharmacological modifiers. Female flies have displayed some phenotypic improvement in disease models (Sujkowski et al. 2022), but full characterization of exercise adaptations in female Drosophila is still in progress. Collect into 20 vials with each vial containing 20 flies (Figure 2). Distributing flies at lower density reduces the flies’ response to the Power Tower. To ensure age matching, all flies should be collected within three days.
Note: Collected flies can be increased or decreased depending on experimental requirements (Figure 2).
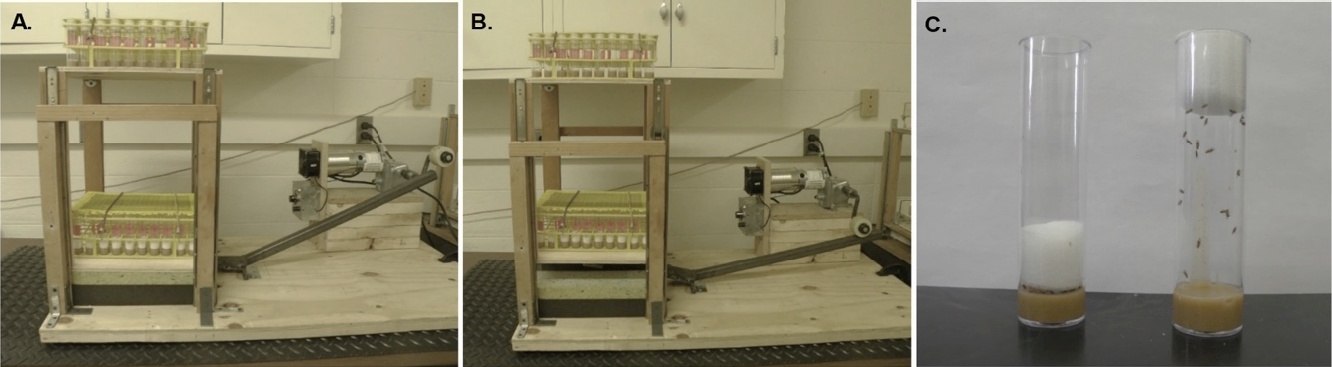
Figure 1: The Power Tower initiates negative geotaxis in Drosophila. A. The Power Tower in its resting position. The lower tier of the power tower contains vials with the foam stopper pushed down to prevent any running. The vials on the top tier have the foam stopper up, which allows the flies to run. B. The rotating arm presses down on the lever, which elevates the Power Tower platforms. When the rotating arm releases the lever, the platforms drop, which knocks the flies off the sides of the vials onto the food. After the platforms drop, flies begin to climb. C. Flies in the exercised group go on the machine with their foam stopper up (right), while flies that are unexercised have their foam stopper pushed down (left). Figure from (Damschroder et al. 2018).
2. Divide each genotype into 2 equal groups: exercised (experimental) and unexercised (control) (Figure 2).
3. Perform any pre-training assessments prior to the first day of exercise training.
4. Prior to exercise, flip flies into a new vial with fresh food. Flies left in used food vials tend to have a reduced response to negative geotaxis induction. The food provides a softer landing for the flies when they are knocked down by the Power Tower and reduces injury.
5. Both exercised and unexercised flies are placed on the Power Tower. Unexercised flies are placed on the Power Tower to control for any non-specific machine effects. To restrict movement of the unexercised group, push the foam stopper down toward the bottom of the vial leaving approximately 2-3 mm of space between the food and the foam stopper (Figure 1C). Make sure no flies are stuck between the stopper and the walls of the vial. A tool like a straight hemostat can be used to pull the foam stopper to the top of the vial and it can be used to release any stuck flies back into the vial.
Note: Continuously tap the vial on a soft surface so flies are at the bottom of the vial and then start pushing the foam stopper down. Pushing in the middle of the stopper with even pressure helps minimize trapped flies on the side of the vial.
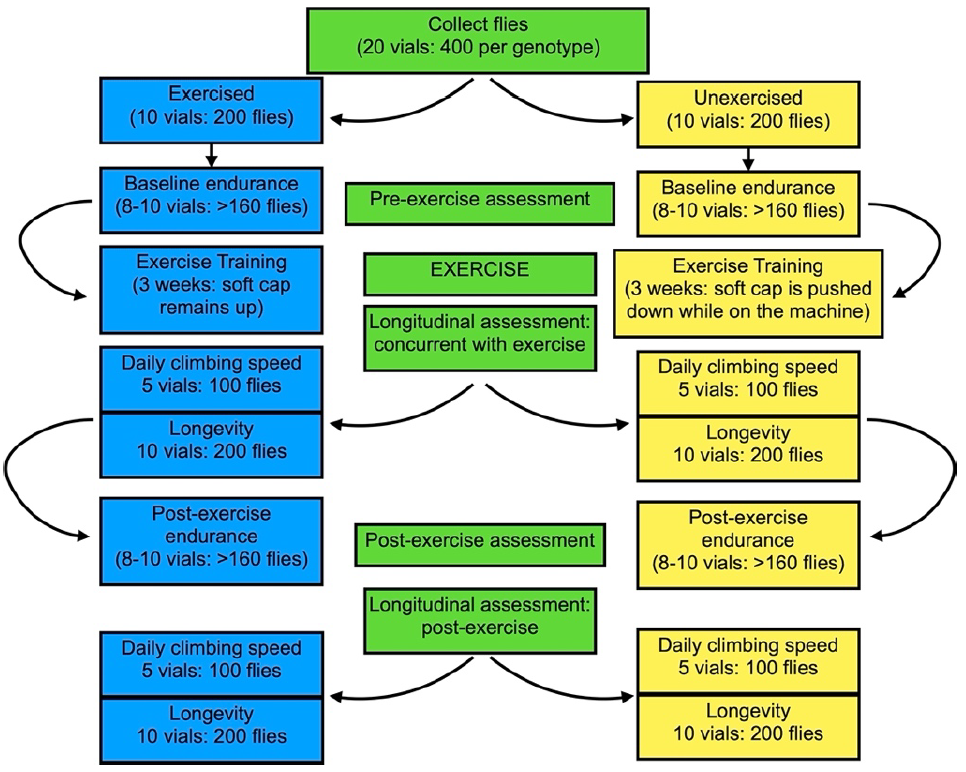
Figure 2: Workflow. Prior to exercise training, a total of at least 400 flies should be collected per genotype being assessed. The same vials of flies can be used for all assessments listed, but additional flies are needed if endpoint analyses (i.e.Western blot, histology, etc) are required. Refer to (Damschroder et al. 2018) for additional information.
6. Place both the exercised and unexercised groups on the Power Tower. Our Power Tower has 2 tiers and there are no tier-dependent effects. Place the rectangular grid screen over the vials and secure with bungee cords. Turn the Power Tower on for the required amount of time for that day (Table 1).
Note: Exercise training should be done at approximately the same time of day. We try to start our training as close to lights on as possible to avoid any circadian effects.
7. When exercise is finished, turn the machine off and remove the flies from the Power Tower.
Pull the foam stoppers to the top of vials of the unexercised group(s) by using a hemostat or an equivalent tool and return flies to the incubator until the next training day.
8. Maintain flies in a 25 °C incubator with a 12-h light/dark cycle.
After 3 weeks of training perform the desired post-training assessments and complete them within one week of the last training day.
Note: Performance in post-training assessments may decrease if done more than one week after the last training day.
9. Post-exercise longitudinal assessment can be continued for as long as required. Longevity is performed until the day the last fly dies.
Table 1. Ramped Exercise Training Protocol
| Week | Time on the machine (hours/day) |
| 1 | 2.0 |
| 2 | 2.5 |
| 3 | 3.0 |
C. Endurance
1. The endurance assessment is conducted both pre- and post-exercise training (Figure 2). The post-training endurance assessment is performed after the three weeks of training.
Note: Perform the pre-exercise endurance at least 48 hours after all flies are collected, since endurance is reduced in very young flies (less than 3 days old). Effects from the pre- exercise endurance do not affect overall results since flies from both exercised and unexercised cohorts perform the pre-endurance test. Additionally, after the endurance assay, flies should rest at least 12 hours before being used for other experiments to guarantee complete recovery and to ensure succeeding physiological outputs are not impacted.
2. Flip at least 8 vials of both exercised and unexercised flies from each genotype into new vials containing food.
Note: Count the number of flies in the vial prior to starting the test. We start with 20 flies per vial for pre-training assessment. It is normal to experience some death during the exercise training protocol. After training, the number of flies per vial should be at least 5. If the number is lower than five, combine vials to reach an n ≥ 5.
3. Place those vials on the Power Tower and separate for optimal viewing. Do not push the foam stoppers down of the vials in the unexercised group. Secure the rectangular grid screen on top of the vials with bungee cords.
4. Turn the Power Tower on and exercise the flies until fatigue. A vial is defined as fatigued when 80% or more of the flies have stopped climbing one centimeter or more up the vial before being knocked down again for 3 consecutive drops.
Note: Threshold for fatigue may be varied if experimental flies have a motor defect that diminishes their climbing ability.
5. Remove fatigued vials from the Power Tower while keeping the Power Tower running and record the time at which the vial was removed. Vials are treated statistically as individuals.
6. Initially, monitor vials approximately once every hour. As vials appear to be nearing fatigue, they should be checked more frequently.
7. Endurance is performed in triplicate, looking for general trends between genotypes. For example, if genotype A ran significantly shorter than genotype B, we look for this same trend across replicates.
Note: Flies experience substantial aging during the 3 weeks of training, so their endurance is not higher after training than before. However, it is typically much higher than unexercised, age-matched controls. In our experience, the 8 vials tested for this assessment accurately represents the endurance capacity of the population.
D. Climbing Speed
1. This assessment is used to examine the longitudinal decline of climbing speed and should be done at least three times a week both during training and post-training (Figure 2). This method is modified from (Gargano et al. 2005).
Note: This assessment should be completed prior to the exercise training session for that day and flies should be returned to the group for training after the assessment.
2. Randomly select 5 vials from each group for this assessment.
Note: The same five vials will be used throughout the experiment in order to accurately measure the longitudinal decline of climbing speed.
3. Place a Bel-Art No-Wire rack against a white background or tape white printer paper around the back and sides of the rack.
4. Place camera ~20 cm away from the front of vial rack. Keep the distance consistent throughout the experiment.
5. Flip five vials of flies from one cohort into five new empty vials.
Note: Flies climb better in fresh vials, so it is imperative to flip flies into new vials every day in order to measure climbing speed accurately.
6. Place the vials into the front row of the vial rack and secure them to the bottom with tape (Figure 3). Place the same vial in the identical spot of the vial rack each day the assessment is performed. This allows you to track the climbing speed of each individual vial.
7. Set a timer to count down from two seconds.
8. Lift the vial rack up and hit it down onto the surface of the tabletop until all the flies drop to the bottom of the vials.
9. Start the timer as soon as the flies drop to the bottom of the vials.
10. Photograph immediately after the timer counts down from two seconds.
11. Repeat Steps D6-D9 4 more times totaling 5 pictures for that group.
12. Photograph 5x per cohort per day on assessment days (2-5 days per week, depending on experimental design) and any additional days after completion of training. Each day's 5 pictures are averaged to generate a single climbing index per vial per day.
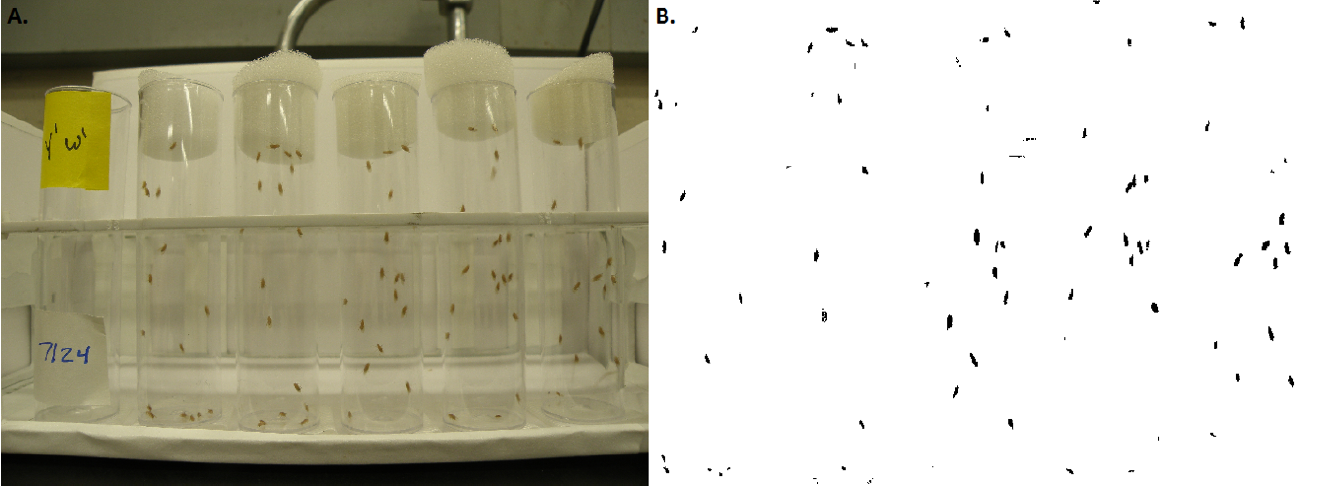
Figure 3. Climbing Speed. A. Setup and sample photograph of the longitudinal climbing assessment. B. High contrast version of A. that is used for data analysis. Figure from (Damschroder et al. 2018).
E. Longevity
1. Longevity is tracked longitudinally for the entire lifespan of the flies.
2. During exercise, deaths are tracked daily before flipping flies onto fresh food and prior to placing cohorts onto the machine.
3. After exercise training is complete, longevity can be scored every 2nd to 3rd day, usually Monday, Wednesday, and Friday, and until the last fly dies.
Note: We have sometimes observed higher mortality during the training period, usually a result of injury to legs or wings that cause the flies to become stuck to the food. There is no significant difference between exercised and unexercised groups. This underscores the importance of unexercised cohorts as a control for machine-related, but exercise independent effects.
Data analysis
To ensure repeatability and accuracy, it is recommended to repeat entire experiments along with controls in triplicate and not to compare data from various repetitions directly. Look for general consistent trends throughout biological repetitions. This controls for any subtle environmental variations that may influence the quantitation of some assessments. While variations in the specific measured values are common, repetitions typically provide identical rank orders and statistical differences. We use ImageJ to analyze the climbing speed.
A. Endurance
Each vial of 20 flies is recorded as a single datum. The time each vial reaches ‘fatigue’ is recorded in minutes and considered an event. Time-to-fatigue is plotted as a curve (sometimes called a runspan curve) and analyzed for significance by log-rank.
B. Climbing Speed
High-contrast photographs are optimal for analysis. Adjust the photo's brightness and contrast so imaging software will be able to clearly detect flies as dark spots on a bright background (Figure 3). Adjust parameters, like pixel size and circularity, so that the imaging software recognizes the black dot as data points. Use the software to calculate XY coordinates of the flies once you have identified their location on the photograph. Output your image analysis data as a text file so that the data can be exported to a stats program for analysis.
The data can be analyzed in different ways. We have previously analyzed our data by calculating the climbing index of each vial. The climbing index is the average quadrant score for the vial. To determine quadrant scores, a vial is horizontally divided into four quadrants and the number of flies in each quadrant is calculated. The number of flies in each quadrant is then divided by the total number of flies in the vial to calculate quadrant scores. The average quadrant score is the climbing index for that vial.
Recently, we have modified our climbing apparatus so that lighting and focal distance are uniform across genotypes, allowing us to calculate absolute distance climbed for each fly. This setup allows for batch processing of data in programs like Image J. Raw data can then be plotted, converted to quadrants, or normalized based on experimental requirements.
As mentioned above, raw data or normalized data may be used for analysis. If the main objective is investigating the differences in climbing speed between genotypes, then the raw data should be used. If investigating the decline in climbing speed, then normalized data should be used. To measure change from each cohort’s starting point, climbing height can be normalized to the average values from the first 2-4 days of climbing. Climbing height typically declines with age, but chronic exercise slows age-related declines in climbing speed (Piazza et al. 2009). Normalized or raw averaged climbing index for all five vials can be plotted as data points in a line graph. Use multivariate regression or a two-way ANOVA with a Bonferroni post-hoc correction to determine significance.
C. Longevity
Differences in lifespan are analyzed by log-rank.
Notes
Exercise Response: Modifications to the ramped exercise protocol may be made, however the degree of training response may vary due to any modification. Diet, temperature, bacterial infection, genetic intervention, and time on the machine are all factors that influence adaptations to exercise and may impact the training response. Additionally, various backgrounds respond to endurance training to varying degrees. To get the best training response, we recommend that flies are healthy, clear of any bacterial infections, and to abort the experiment if bacteria or fungus becomes visible in vials during the training period.
Techniques specific to (Sujkowski et al. 2022) are presented here and have been slightly modified from previous methods publications. For additional information and protocols used to examine Drosophila exercise adaptations, please see (Damschroder et al. 2018) and (Tinkerhess et al. 2012).
Recipes
1. Fly Food
10% yeast
10% sucrose
2% agar
0.1% propionic acid
0.1% methyl 4-hydroxybenzoate
Note: Variation to diet may alter exercise response.
References
Damschroder, D., T. Cobb, A. Sujkowski and R. Wessells (2018). "Drosophila Endurance Training and Assessment of Its Effects on Systemic Adaptations." Bio-Protocol8(19).
Gargano, J. W., I. Martin, P. Bhandari and M. S. Grotewiel (2005). "Rapid iterative negative geotaxis (RING): a new method for assessing age-related locomotor decline in Drosophila." Exp Gerontol 40(5): 386-395.
Piazza, N., B. Gosangi, S. Devilla, R. Arking and R. Wessells (2009). "Exercise-training in young Drosophila melanogaster reduces age-related decline in mobility and cardiac performance." PLoS One 4(6): e5886.
Sujkowski, A., D. Ramesh, A. Brockmann and R. Wessells (2017). "Octopamine Drives Endurance Exercise Adaptations in Drosophila." Cell Rep 21(7): 1809-1823.
Sujkowski, A., K. Richardson, M. V. Prifti, R. J. Wessells and S. V. Todi (2022). "Endurance exercise ameliorates phenotypes in Drosophila models of spinocerebellar ataxias." Elife 11.
Tinkerhess, M. J., S. Ginzberg, N. Piazza and R. J. Wessells (2012). "Endurance training protocol and longitudinal performance assays for Drosophila melanogaster." J Vis Exp(61).
- Sujkowski, A, Wessells, R and Todi, S(2022). Exercise training. Bio-protocol Preprint. 10.21769/p1842.
- Sujkowski, A., Richardson, K., Prifti, M. V., Wessells, R. J. and Todi, S. V.(2022). Endurance exercise ameliorates phenotypes in Drosophila models of spinocerebellar ataxias. eLife. DOI: 10.7554/eLife.75389
Do you have any questions about this protocol?
Post your question to gather feedback from the community. We will also invite the authors of this article to respond.