
- Home
- Protocols

-

Measurement of the cADPR levels in DRGs
Last updated date: May 9, 2022 Views: 1014 Forks: 0
Measurement of cellular cADPR levels by the cycling assay
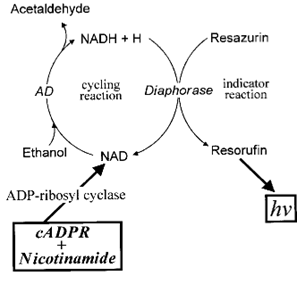
ADP-ribosyl cyclase normally catalyzes the synthesis of cADPR from NAD, but the reaction can be reversed in the presence of a high concentration of nicotinamide, producing NAD from cADPR stoichiometrically. The resultant NAD can then be coupled to a cycling assay involving alcohol dehydrogenase and diaphorase. Each time NAD cycles through these coupled reactions, a molecule of highly fluorescent resorufin is generated. The reaction can be conducted for hours, resulting in more than a thousand-fold amplification of cADPR.
Reagents:
| Vendor | Catalog | working | |
| Perchloric acid, PCA | Sigma | 244252 | 0.6 M |
| Chloroform | Sigma | 288306 | |
| Tri-n-octylamine | TCI | T0502 | |
| Tris | Sangon biotech | A600194 | 10 mM |
| MgCl2 | Sangon biotech | A601336 | 1 mM |
| NADase | Sigma | N9879 | Test before use |
| Ethanol | Sigma | 1.00983 | 2% |
| Alcohol dehydrogenase | Sigma | A7011 | 100 μg/ml |
| Resazurin | Sigma | R7017 | 10 μM |
| Diaphorase | Sigma | D5540 | 10 μg/ml |
| FMN | Sigma | F8399 | 10 μM |
| Nicotinamide | Sigma | N3376 | 10 mM |
| ADP ribosyl cyclase | Homemade[2] | 2 μg/ml |
Method
- Cells are cultured in a 24-well plate for a desired period of time.
- Cells are then washed with PBS carefully to avoid detachment and lysed by adding 200 μl of ice-cold 0.6 M PCA.
- Cell lysate fluids are carefully collected into fresh 1.5 ml Eppendorf (EF) tubes. Note: Avoid disturbing and collecting the cell debris.
- Dissolve the cell debris remained in the wells with 1 M NaOH and used for protein quantification with the Bradford assay or the BCA (Bicinchoninic acid) assay.
- Prepare the cADPR standards (0, 10, 20, 40 nM) in 0.6 M PCA.
- Extract PCA in the cell lysates from Step 3 and cADPR standards from Step 5 with 4 volumes of Chloroform/Tri-n-octylamine (v/v=3:1) solution. Vortex for 1 min and centrifuge for 10 min at 12,000 g at 4℃. Remove 170 μl of the top aqueous layer and put into a new 1.5 ml EP tube.
- Add 1.7 μl of 1M Tris (pH7.5), 1.7 μl of 100 mM MgCl2 (working concentrations of Tris and MgCl2 are 10 mM and 1 mM, respectively), 3μl of NADase (the amount should be adjusted; enough to digest all NAD after incubation) and incubate overnight at 37℃.
- Samples are then transferred to a MultiScreen filter plate (Millipore, MSIPN4510) to remove the NADase.
- Prepare the solution for the cycling assay, which contain ethanol, alcohol dehydrogenase, resazurin, diaphorase, FMN, and nicotinamide in PBS at concentrations specified in the reagent table listed above, with or without cyclase (as background control).
- Add 20 μl of sample (triplicated) into a 96-well white plate, and start the fluorescence measurement immediately after adding 100 μl of the cycling assay solution (3 wells: without cyclase; 3 wells: with cyclase).
- Measure the fluorescence kinetics using a plate reader (544 nm excitation and 590 nm emission).
- Calculate the initial slope (RFU/min) in the linear range. The background signals (without cyclase) are subtracted from the corresponding sample signals (with cyclase). The corrected slopes are converted into cADPR concentrations through the standard curve, which further are divided by the total protein amount in the sample to obtain the cADPR contents in pmol cADPR/mg protein. The volume of the samples in each step should be noted as it is required for calculating the pool value of cADPR.
- In addition to the background control without cyclase, other controls described in the reference should be done.
Reference
1. Graeff, R. and H.C. Lee, A novel cycling assay for cellular cADP-ribose with nanomolar sensitivity. Biochem J, 2002. 361(Pt 2): p. 379-84.
2. Munshi, C. and H.C. Lee, High-level expression of recombinant Aplysia ADP-ribosyl cyclase in offhia pastoris by fermentation. Protein Expr Purif, 1997. 11(1): p. 104-10.
- Li, W, Lee, H and Zhao, Y(2022). Measurement of the cADPR levels in DRGs. Bio-protocol Preprint. bio-protocol.org/prep1665.
- Li, W. H., Huang, K., Cai, Y., Wang, Q. W., Zhu, W. J., Hou, Y. N., Wang, S., Cao, S., Zhao, Z. Y., Xie, X. J., Du, Y., Lee, C., Lee, H. C., Zhang, H. and Zhao, Y. J.(2021). Permeant fluorescent probes visualize the activation of SARM1 and uncover an anti-neurodegenerative drug candidate. eLife. DOI: 10.7554/eLife.67381
Do you have any questions about this protocol?
Post your question to gather feedback from the community. We will also invite the authors of this article to respond.