
- Home
- Protocols

-

Principal components analysis
Last updated date: Oct 6, 2021 Views: 733 Forks: 0
Summary of Cooke et al. PCA steps
Dataset construction
PCA was conducted usinga dataset based on the Simons Genome Diversity Panel(SGDP), filtered for autosomal transversions-only SNPs with a minor allele frequency of 1% (3,867,366 SNP sites). A high-quality single base (bq30) at each SNP was called in each ancient individual (listed in Cooke et al Table S4 ) using GATK version 3.7-0 to create a pseudo-diploid genotype. All present- day and ancient individuals were merged into a single dataset using plink.
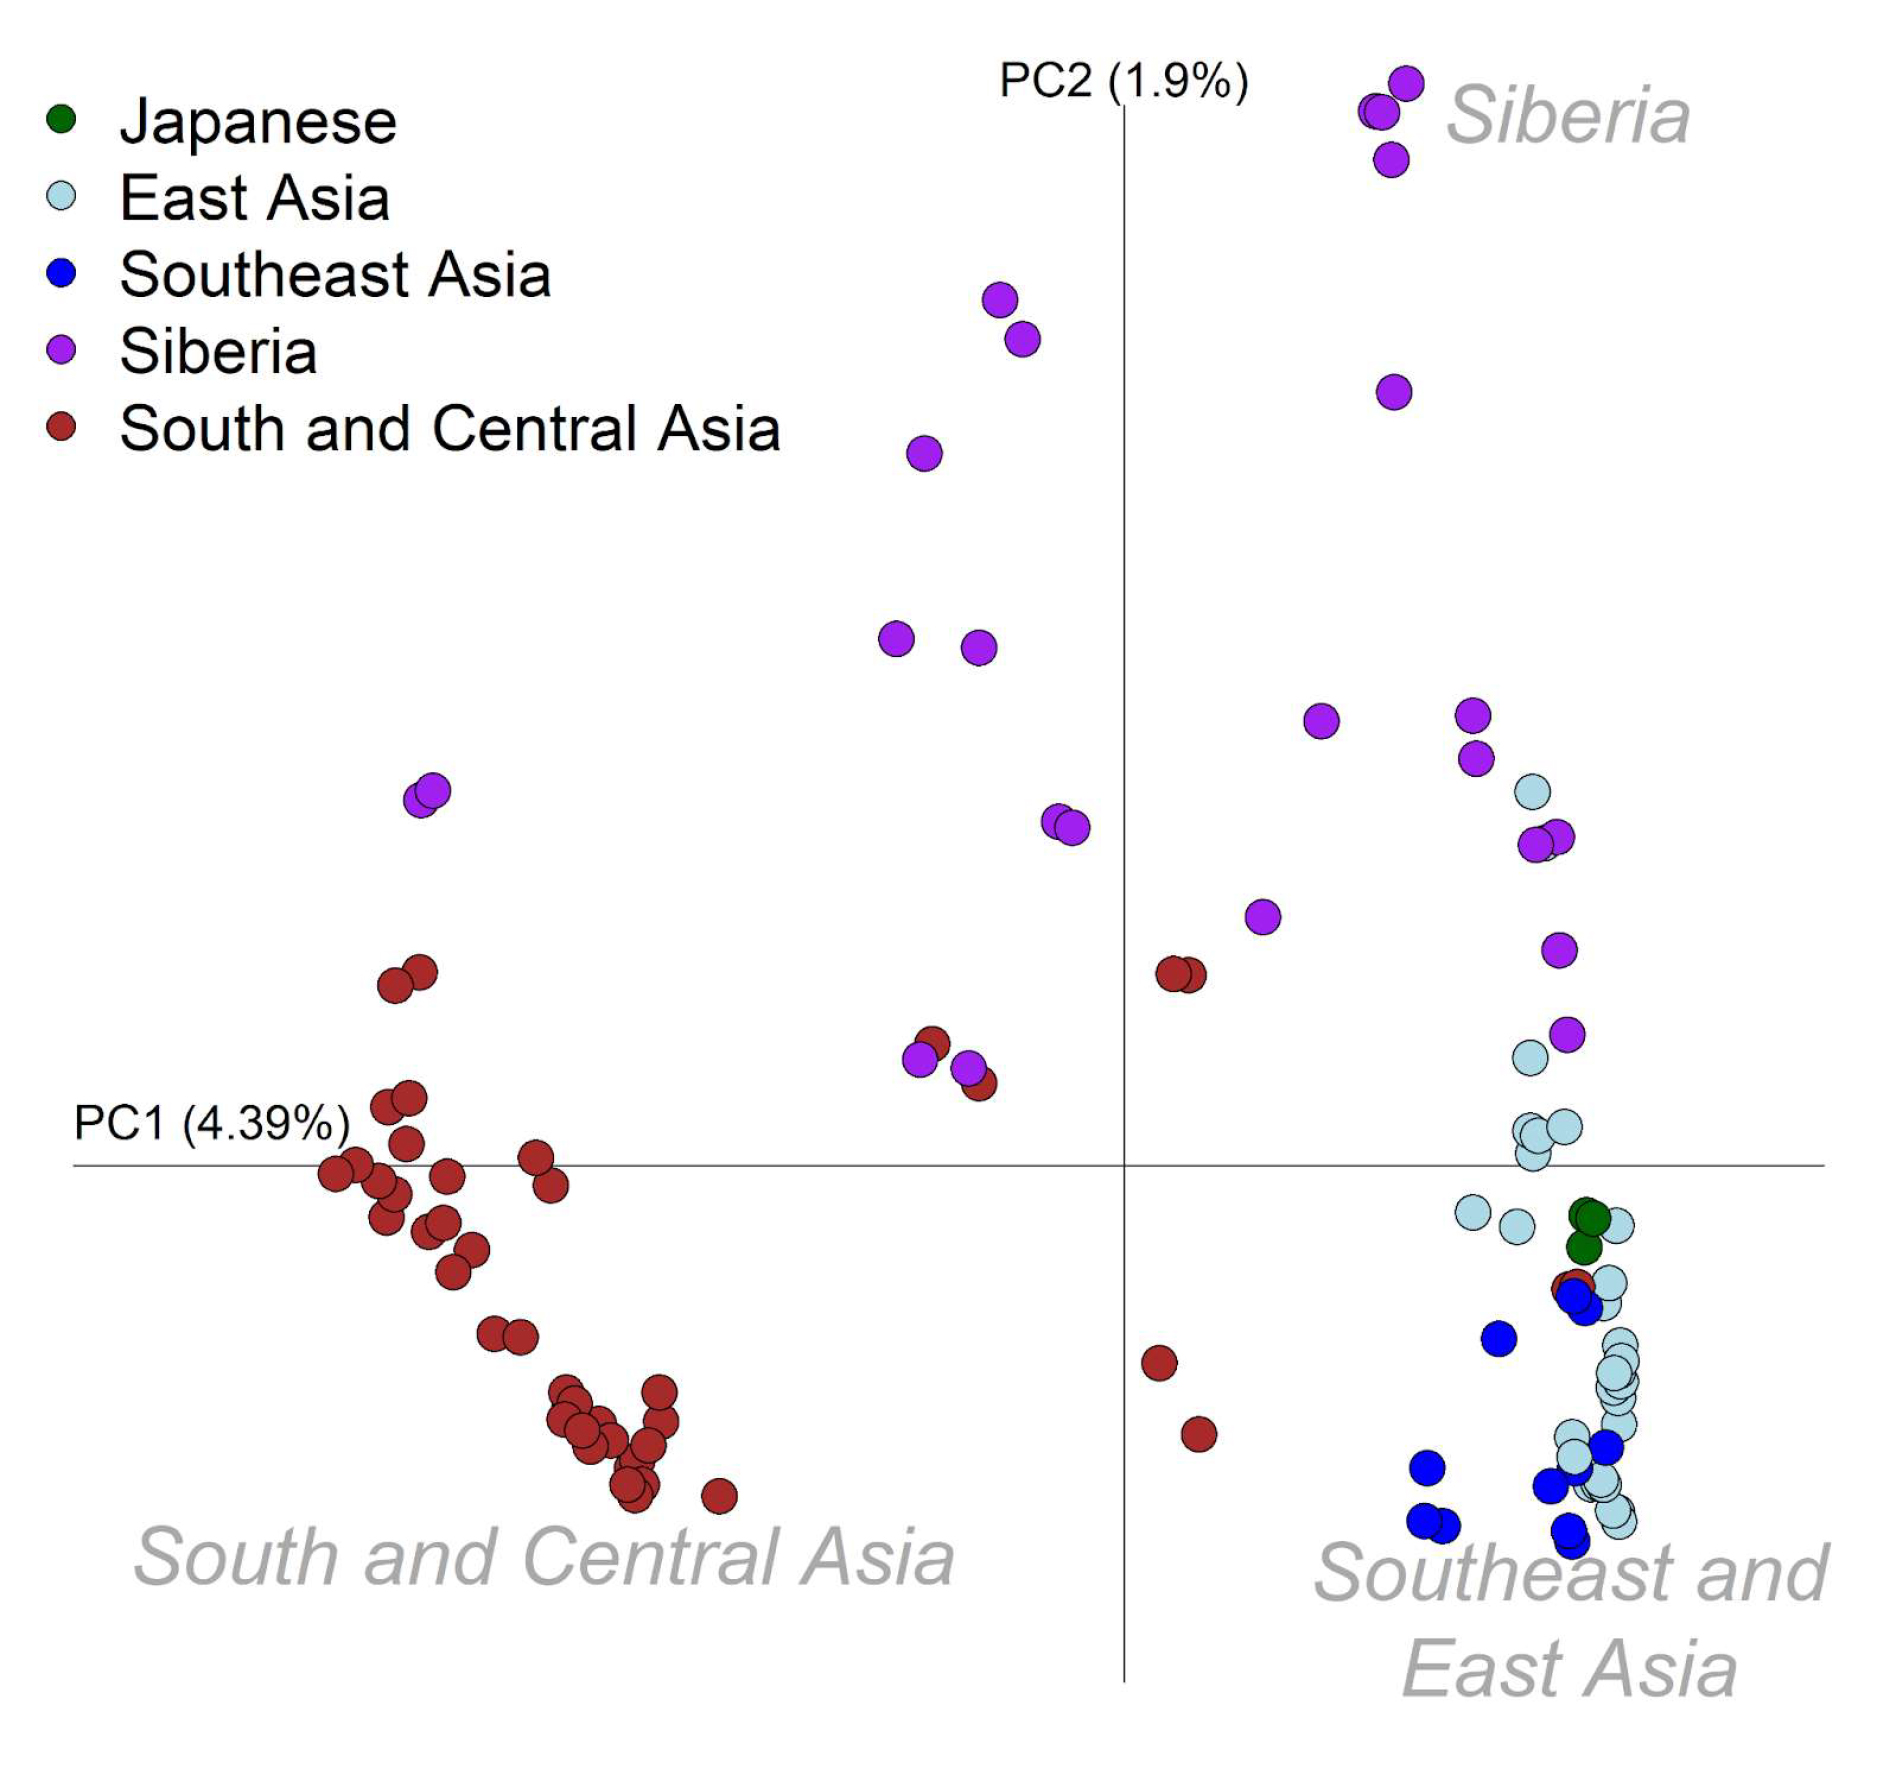
Only a subsetof the largerdataset was included in PCA in order to just focuson Asian populations and ancient individuals. Presentday populations (n=112)were chosen based on geography:
- East Asia: Ami, Atayal,Dai, Daur, Han, Japanese, Korean,Lahu, Miao, Mongola,Oroqen, She, Tu, Tujia, Uygur, Xibo
- Southeast Asia: Burmese, Cambodian, Dusun, Kinh,Thai, Yi
- Central and South Asia: Balochi, Bengali, Brahmin, Brahui, Burusho, Hazara, Irula, Kalash, Kapu, Kusunda, Kyrgyz, Madiga, Makrani, Mala, Naxi, Pathan, Punjabi, Relli, Sindhi, Tajik, Yadava
- Siberia: Aleut, Altaian, Chukchi,Eskimo (Chaplin), Eskimo (Naukan), Eskimo(Sireniki), Even, Hezhen, Itelman,Mansi, Russian, Tubalar,Ulchi
These populations, along with all ancient individuals, were extracted from the larger dataset using plink.
Running smartpca
The subset of the data was converted from plink to EIGENSTRAT format using convertf. Principal components weredetermined using the variation foundwithin present-day individuals only with ancients projected onto this variation. In the example parameter file all present-day individuals were listed as “MODs.list”.
The parameter file (“par.example.smartpca”) genotypename: example.eigenstratgeno Snpname: example.snp
Indivname: example.ind
Evecoutname: example.autoshrink.smartpcaevec Evaloutname: example.autoshrink.smartpcaeval Killr2: YES
R2thresh: 0.2
Numoutlieriter: 0
Poplistname: MODs.list
Lsqproject: YES Autoshrink: YES
This parameter file was run using the smartpca(v16000) from the EIGENSOFT package(v7.2.0):
smartpca -p par.example.smartpca > example.smartpca.log;
Plotting
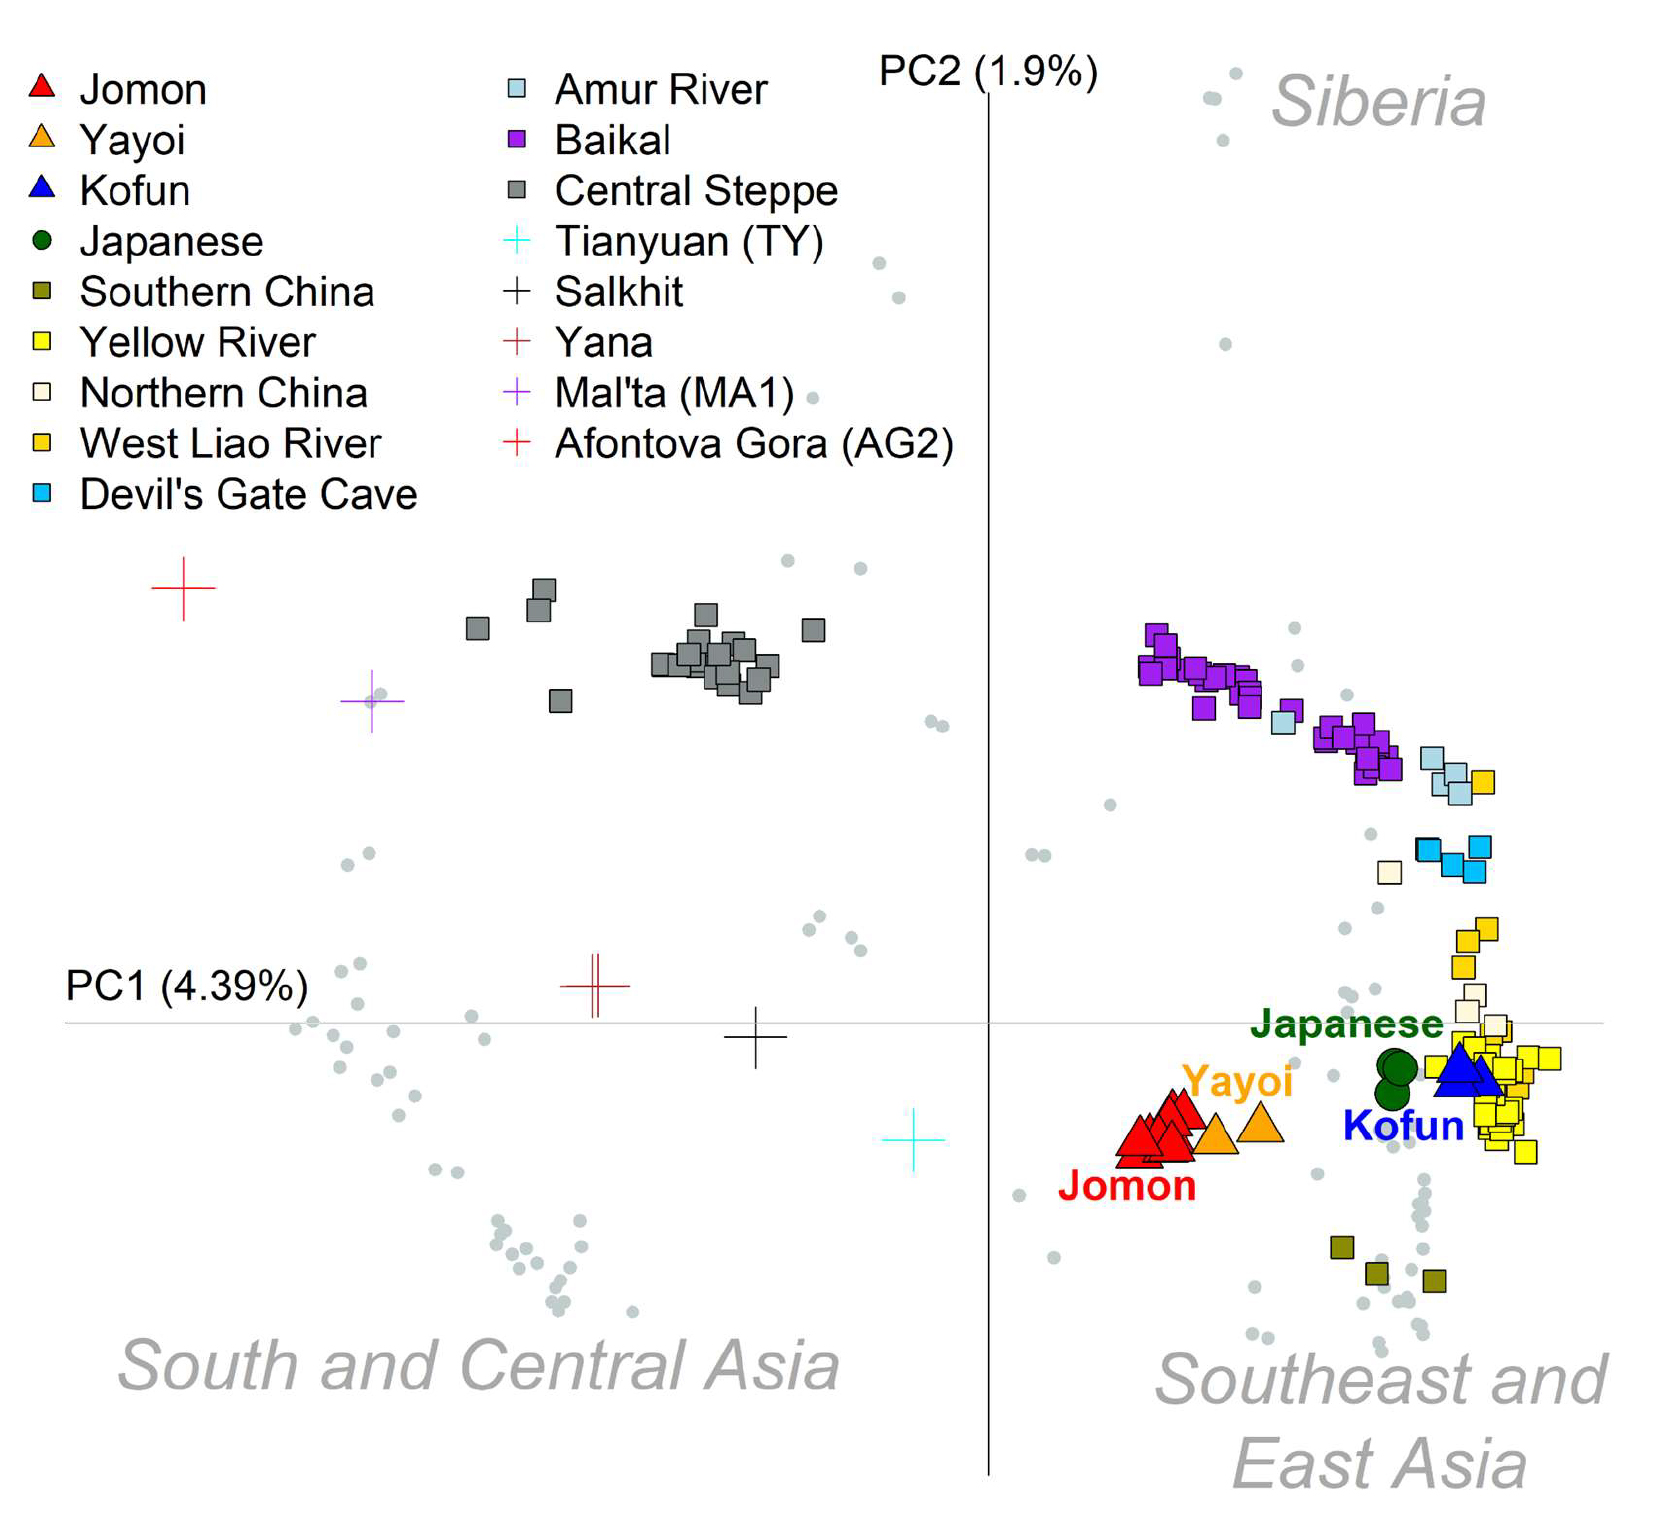
Plotting was done in R usingthe “example.autoshrink.smartpcaevec” file.With the exception of “Yayoi_1”, only ancient individuals with at least 100,000 SNP sites were included in the plot (number of SNPs per individual can be determined using plink --missing). The percentage variation explained by each principal component was calculated using the output in the “example.autoshrink.smartpcaeval” file. Axes were adjusted to better match the geographic distribution of these samples. All present-day individuals were represented by gray circles,with the exception of present-day Japanese which is highlighted in green (a modern only plot was included in the supplementary figure 4). Ancients were grouped in the following categories:
- Jomon
- Yayoi
- Kofun
- Southern China (Liangdao1, Liangdao2, Xitoucun)
- Yellow River (Upper_YR_IA, YR_LN, YR_LBIA, Upper_YR_LN, YR_MN)
- Northern China (Bianbian, Boshan, Xiaogao, Yumin)
- West Liao River (WLR_BA, WLR_BA_o, WLR_MN, WLR_LN, HMMH_MN)
- Devil’s Gate Cave (DevilsCave_N)
- Amur River (AR_Xianbei_IA, AR_EN, AR_IA)
- Baikal (Shamanka_EN, Shamanka_EBA, Lokomotiv_EN, Ust_Ida_LN, Ust_Ida_EBA, Kurma_EBA, UstBelaya_N, UstBelaya_EBA)
- Central Steppe (Botai, CentralSteppe_EMBA, Okunevo_EMBA)
- Upper Paleolithc individuals were highlighted by crosses - Tianyaun, Salkhit, Yana, Mal’ta, AG2
- Niall, C, Bradley, D, Gakuhari, T and Nakagome, S(2021). Principal components analysis. Bio-protocol Preprint. bio-protocol.org/prep1394.
- Cooke, N. P., Mattiangeli, V., Cassidy, L. M., Okazaki, K., Stokes, C. A., Onbe, S., Hatakeyama, S., Machida, K., Kasai, K., Tomioka, N., Matsumoto, A., Ito, M., Kojima, Y., Bradley, D. G., Gakuhari, T. and Nakagome, S.(2021). Ancient genomics reveals tripartite origins of Japanese populations. Science Advances 7(38). DOI: 10.1126/sciadv.abh2419
Do you have any questions about this protocol?
Post your question to gather feedback from the community. We will also invite the authors of this article to respond.