
- Home
- Protocols

-

ER and mitochondrial ATP level analysis by flow cytometry
Last updated date: Apr 23, 2021 Views: 1406 Forks: 0
First, you will need an ER ATP/ADP ratio reporter cell line _
Construction of ERAT4 reporter cell lines
CHO cells were transfected with the reporter plasmids using the Amaxa Nucleofector II electroporation system in the Mirus Ingenio solution (Cat # MIR 20114). For reporter plasmids with G418 resistance, a brief G418 selection (0.5 mg/mL) was applied on transfected CHO cells for one week. The population of surviving cells was allowed to recover for two weeks before they were used for ER ATP analysis by flow cytometry. For reporter plasmids without a mammalian selection marker, a puromycin resistance cassette (~1.23 kb, amplified from plasmid pGL4.21) was co-transfected using the Amaxa Nucleofector II electroporation system in the Mirus Ingenio solution. After a brief puromycin selection (5 µg/mL for five days), cells were allowed to recover for two weeks before they were used for fluorescence ratio analysis by flow cytometry. Specifically, the plasmid encoding the ERAT4.01N7Q reporter was purchased from Next Generation Fluorescence Imaging Company (NGFI, Austria).
Secondly, you probably want to select a single clone of ERAT4 reporter cell line, to minimize ERAT4 protein expression level variance.
Thirdly, you can go ahead with flow cytometry analysis of ATP-to-ADP ratio by monitoring the FRET signal from the ERAT4 probe (now part of your single clone, in the cell of interest):
ER and mitochondrial ATP level analysis by flow cytometry
For FRET-based ATP determination, a Novocyte 3000 flow cytometer (ACEA BioSciences) was used to record ERAT fluorescence at channels with Ex/Em filters set as following: 1). 405 nm/ 445 (band width: 45) nm; 2). 405 nm/ 530 (band width: 30) nm. ER and mitochondrial ATP levels for individual cells were defined as the ratio of fluorescence intensity of channel 2 (Ex/Em: 405/530) divided by that of channel 1 (Ex/Em: 405/445), similar to parameters used previously (Imamura et al., 2009; Vishnu et al., 2014). In addition, fluorescence intensities of the following channels were recorded for probe abundance quantification, and for data validity verification: 1) 405 nm/ 572 (band width: 28) nm; 2) 488 nm/ 530 (band width: 30) nm; and 3) 488 nm/ 572 (band width: 28) nm.
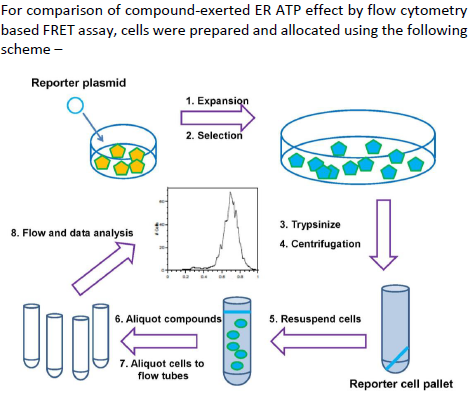
Here is an illustration of workflow for your information-
- Yong, J(2021). ER and mitochondrial ATP level analysis by flow cytometry. Bio-protocol Preprint. bio-protocol.org/prep1034.
- Yong, J., Bischof, H., Burgstaller, S., Siirin, M., Murphy, A., Malli, R. and Kaufman, R. J.(2019). Mitochondria supply ATP to the ER through a mechanism antagonized by cytosolic Ca2+. eLife. DOI: 10.7554/eLife.49682
Do you have any questions about this protocol?
Post your question to gather feedback from the community. We will also invite the authors of this article to respond.