
- Home
- Protocols

-

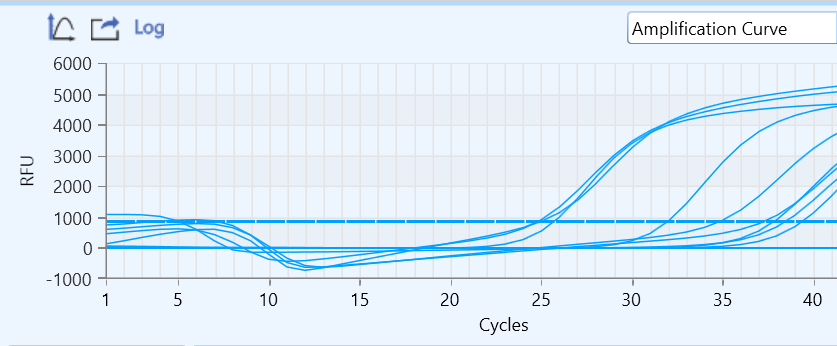
Why is my qPCR amplification number dropping suddenly?

We all know that the fluorescence quantitative dissolution curve will be relatively stable after entering the plateau period from the exponential period, and then there will be no fluctuations, but the dissolution curve of a batch of qPCR that I recently carried out has some strange phe
Read more
John Khalil Answered Oct 28, 2022
St Georges University
1. The main reason for the decline in the curve may be that the template concentration is too high, and the time to enter the exponential period is earlier than normal, but due to the machine setting, the default is still in the baseline period, and the automatic correction makes the curve suddenly drop. In this case, the baseline data can be modified according to the experimental parameters and the experiment can be re-conducted.
2. If there are bubbles left in the reaction well, the bubbles will rupture during the reaction process and it will affect the fluorescence value detected by the machine, so that the curve drop. Therefore, it is necessary to check whether there are air bubbles in the reaction solution before the reaction begins.

David Shafi Answered Nov 1, 2022
California State University, Chico
The main reason may be that the concentration of the template is too high and the peaks are initiated within the baseline period. The instrument will default to the baseline part of the line where the peaks are initiated and pull down the amplification curve towards the baseline position, which can be caused by reducing the baseline endpoint (e.g. changing the default 3-15 cycles of the baseline period to 3-10 cycles) and re-analyzing the data, which usually gives a better result.

Ravi Tauran Answered May 11, 2023
hgv
My qPCR curves are dropping giving rise to foxtails in the initial few cycles. I tried to dilute or reduce the DNA quantity to PCR but still arises. How to control them? This occurs sometimes in the high copy number samples and sometime in low copy number samples as random.
My answer
Write your answer...
References (optional)
![]() Add more
Add more