
- Home
- Protocols

-

Utilisation of Methylome Data to Identify Stably Unmethylated Regions in Plant Genomes
Published: Feb 20, 2024 DOI: 10.21769/BioProtoc.4944 Views: 421
Abstract
DNA methylation is a key chromatin modification that provides a mechanism for epigenetic inheritance. However, DNA methylation profiles can also be used to annotate or filter plant genomes by partitioning a genome into methylated and unmethylated regions (UMRs). UMRs comprise only a very small fraction of moderate to large plant genomes, yet these regions are known to be highly enriched in functionally significant genomic sequences, including genes and cis-regulatory elements. Therefore, methods to efficiently and accurately identify UMRs in plant genomes are useful for genome annotation and functional genomics and potentially for crop improvement. In this protocol, we provide a reproducible vignette to identify UMRs in the maize methylome, starting from raw fastq files obtained by whole-genome bisulfite sequencing. This method determines the average methylation per 100 bp tile of the genome and classifies tiles as methylated and unmethylated. To support training and learning, this step-by-step guide uses a small data subset corresponding to a 20 Mb region of the maize genome so that this analysis could be completed on a standard desktop computer with minimal computational resources.
Keywords: DNA methylationBackground
Groundbreaking research into epigenetics has opened up possibilities for its application to human diseases, modern agriculture, synthetic biology, and studies of evolution. Covalent attachment of a methyl group to the 5′ carbon of cytosine in DNA (5-methylcytosine) is generally known as DNA methylation, and 5-methylcytosine is sometimes referred to as the fifth base [1]. DNA methylation can provide a mechanism for epigenetic inheritance of phenotypes and, accordingly, is often referred to as an epigenetic modification. DNA methylation plays critical roles in transposon silencing, genome stability and organisation, heterochromatin formation, gene regulation, development, and imprinting [2]. More recently, we have demonstrated that there is great utility in identifying regions of the genome that lack DNA methylation, referred to as unmethylated regions (UMRs) [3]. In this protocol, we provide a step-by-step guide to identify UMRs from DNA methylation sequencing data.
There are a variety of technologies that can be used to detect and quantify the levels of DNA methylation at a particular locus, and many of these methods can also be scaled to genome-wide profiling of the entire methylome [4,5]. Technologies include bisulfite based, digestion based, or affinity based. Whole-genome techniques include whole-genome bisulfite sequencing (WGBS), enzymatic methyl-seq (EM-seq), reduced representation bisulfite sequencing (RRBS-seq), which uses bisulfite coupled with enzymatic digestions, and methyl-DNA immunoprecipitation (MeDIP), which attracts methylation through antibody enrichment [6–9]. In addition, over the last few years, nanopore sequencing has emerged as another alternative, allowing direct detection of DNA and RNA methylation on long reads [10]. Importantly, the ability to identify methylation at single-base-pair resolution has allowed specific understanding of how methylation—or the lack thereof—influences specific regions of the genome, including regulatory regions that may be important for transcriptional changes and phenotypic variation for traits of interest. In this protocol, we analyse WGBS sequence data; we routinely apply the same analysis pipeline to EM-seq data, to which it is equally applicable. Together, these methyl-seq whole-genome sequencing approaches (WGBS and EM-seq) are the current gold standard for DNA methylation profiling, as they provide a whole-genome analysis of regions that are methylated and the types of methylation present [11,12].
The key step in WGBS involves treating genomic DNA with sodium bisulfite, which converts unmethylated cytosines to uracils by deamination (which are converted to thiamine following PCR amplification), while 5’-methylcytosines remain unaffected [8]. After bisulfite treatment is complete, converted DNA can be prepared for sequencing, commonly on the Illumina platforms, allowing inference of methylation at single-base resolution by comparison to a reference genome. Due to the cytosine conversion step in WGBS (and in EM-seq), a key requirement in the bioinformatic analysis is to use bisulfite aware mapping software to identify the T-converted unmethylated cytosines, which will appear as polymorphisms compared to a reference genome. Commonly used mapping software includes BSMAP, BWA-meth, and Bismark [13,14].
In plants and animals, DNA methylation occurs in different sequence contexts including CG, CHG, and CHH (where H is A, T, or C). Studies have found that the type of methylation can correspond to different functions; for example, CG-only methylation has been correlated with actively transcribed gene bodies, while transcriptionally silenced regions are associated with high levels of methylation in all contexts (CHH, CHG, and CG) [15]. The output of this analysis pipeline includes files for visualisation of each type of methylation. Recently, the research community has demonstrated that regions that lack DNA methylation in all contexts are of particular significance [3,15–23]. Partitioning genomic regions into different categories of methylation types allows us to identify unmethylated regions (UMRs). This approach can be very useful for annotating a genome [24] because UMRs tend to align with regions containing functional genes and also cis-regulatory elements (CREs) [3,25]. CREs are non-coding elements and include enhancers, promoters, and silencers, which can influence gene expression. These have the potential to be important targets for selection and breeding and also as targets for genetic engineering. Researchers have yielded promising results from genetic modification of CREs for tailoring gene expression without causing developmental problems [26,27]. For example, improvements in yield in rice [28,29], maize [30], and tomato [31–33] have been produced by gene editing non-coding cis-regulatory promoter alleles. However, efficiently identifying functional regions of regulatory importance is challenging [3]; identification of UMRs can narrow the search for genetic targets. As genomic sequencing and tools for genome annotation improve, our ability to understand the functionality of the genome is made increasingly powerful when combining knowledge of transcription binding sites, conservation of sequences through evolution, epigenomic markers for transcriptional activity, and other emerging technologies.
In the case study outlined below, we have provided a subset of raw WGBS reads extracted from SRX5532987, a published study of DNA methylation in maize leaf tissue [3]. This subset of reads aligns to a small 20 Mb region of maize chromosome 1; we provide this subset of the genome as a reference sequence for mapping. These files enable processing this example data with minimal computational resources and could be completed on a basic laptop computer with the appropriate software installed. The pipeline was originally optimised for maize, but it is generally applicable to other species without modification [34]; however, users could consider modifying the thresholds in the UMR-calling step if applied to a plant genome that has particularly unusual levels or distribution of DNA methylation. The key steps of the workflow are outlined in Figure 1.
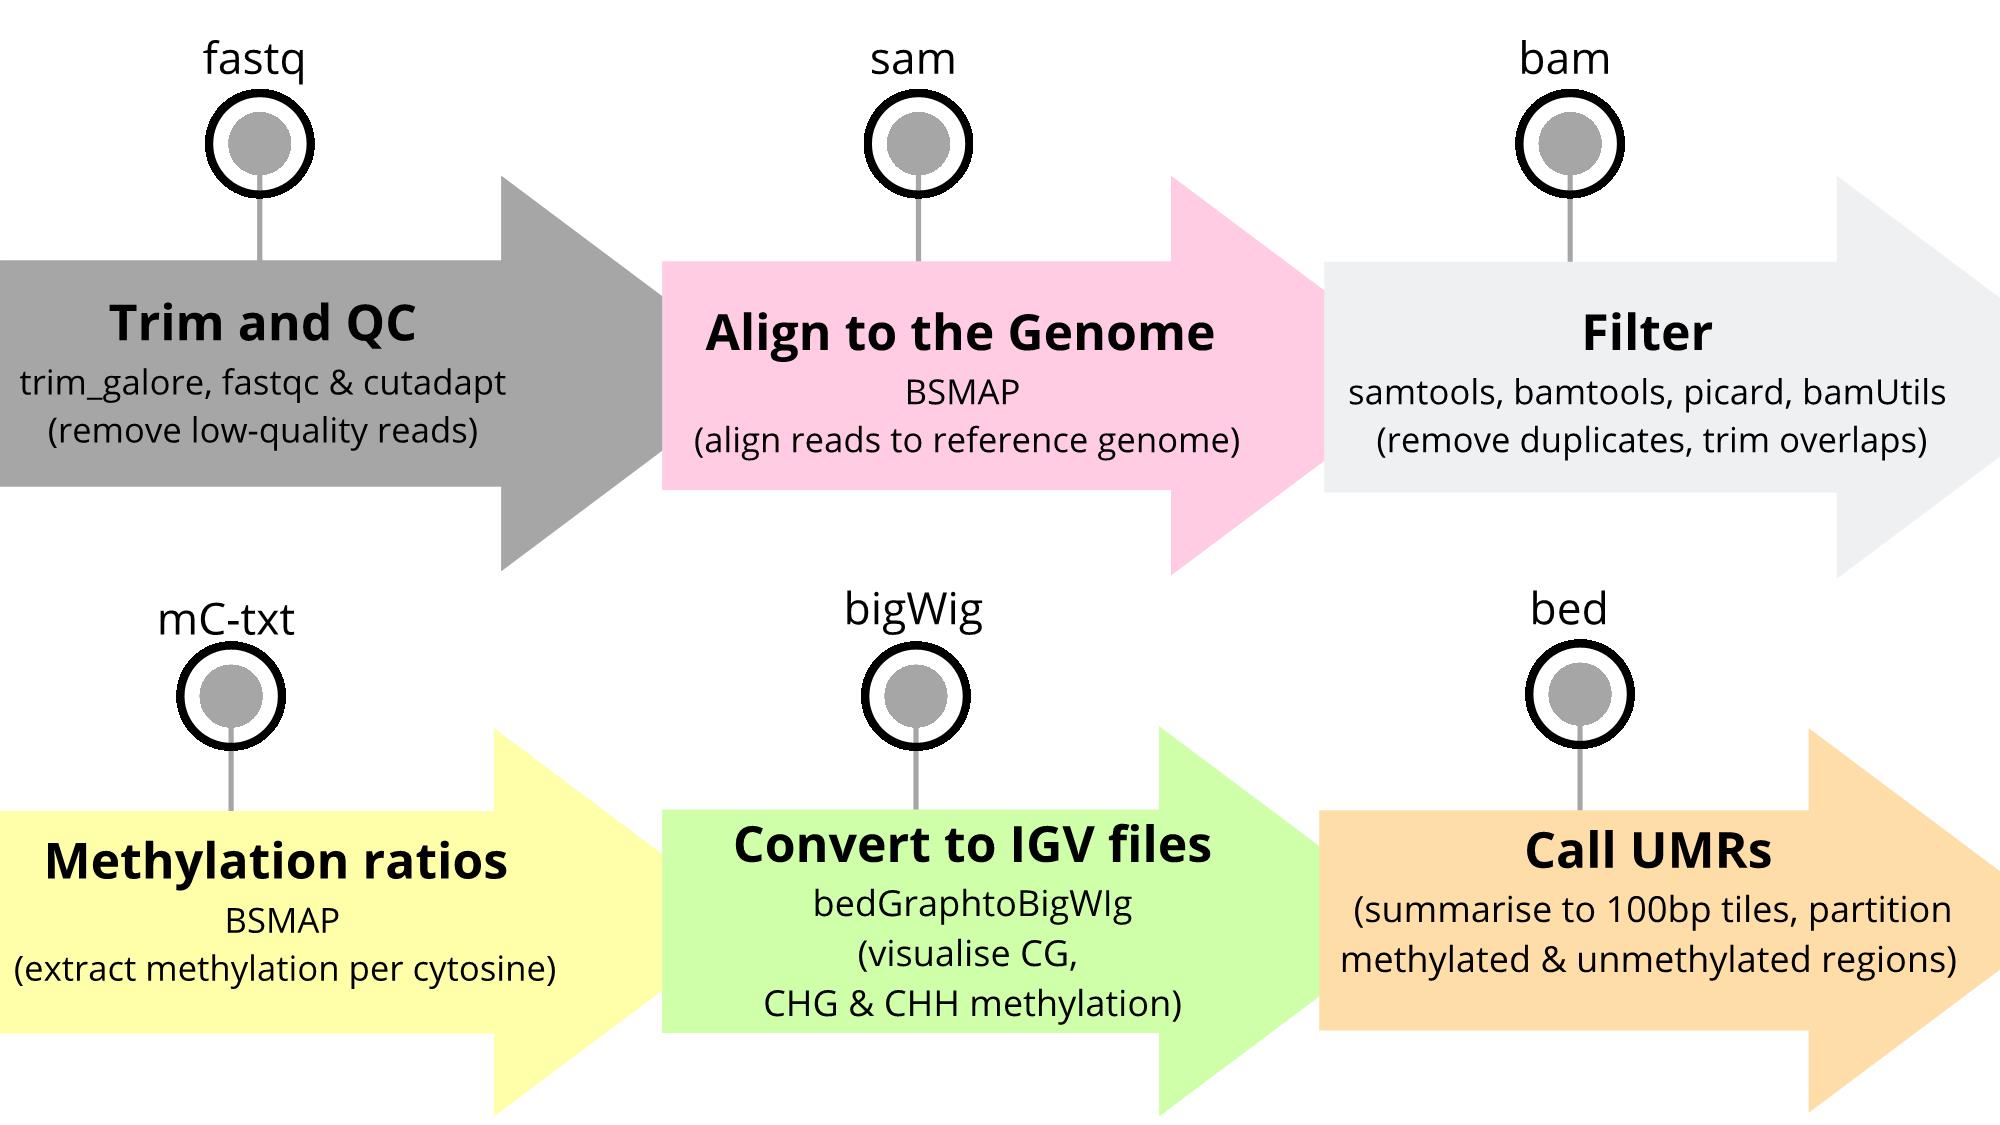
Overview of the workflow to identify unmethylated regions (UMRs) in a plant genome. The bioinformatic workflow presented in the protocol includes six major steps: 1) read trimming, 2) read mapping, 3) filtering, 4) extraction and quantification of methylation levels per cytosine, 5) data visualisation, and lastly 6) summarisation and identification of UMRs. The output file formats are indicated above each step and the software tools and their purpose are summarised.
Software and datasets
The required software, references, and websites for download are provided below:
trim_galore! [16], v0.6.4_dev ( https://github.com/FelixKrueger/TrimGalore)
cutadapt [20], v1.8.1 ( https://cutadapt.readthedocs.io/en/stable/)
fastQC [3], v0.11.5 ( https://www.bioinformatics.babraham.ac.uk/projects/fastqc/)
BSMAP [45], v2.74 ( https://bmcbioinformatics.biomedcentral.com/articles/10.1186/1471-2105-10-232 )
samtools [9], v1.16 ( https://github.com/samtools/samtools)
bamtools [4], v2.4.0 ( https://github.com/pezmaster31/bamtools/)
Java [1], v1.8.0_45 ( https://www.oracle.com/java/technologies/javase/8u45-relnotes.html )
Picard, v2.9.0 ( https://broadinstitute.github.io/picard/)
bamUtil [15], v1.0.13 ( https://genome.sph.umich.edu/wiki/BamUtil)
Python [39], v2.7.5 (https://www.python.org/)
bedGraphToBigWig (UCSC; download from http://hgdownload.soe.ucsc.edu/admin/exe/ )
perl [40], v5.26.2 (https://www.perl.org/)
IGV [32], v2.5.3 ( https://software.broadinstitute.org/software/igv/)
R, v4.1 (https://www.r-project.org/ )
Each of the above software was run in a terminal application on a server running the software Linux but could also be run on any personal machine running Linux or macOS.
Input data
To demonstrate the identification of UMRs from WGBS data, we have provided a small subset of reads (3,396 reads) for analysis in paired fastq files (“B73_chr1_subset_reads_1.fastq” and “B73_chr1_subset_reads_2.fastq”). These reads were extracted from SRR8738272 [7] SRA PRJNA527657, WGBS from a maize B73 seedling, V1 stage, leaf shoot. These reads map to a section of the maize V4 genome between 80 and 100 kb on chromosome 1. We have provided a fasta reference sequence for this portion of the maize genome for mapping the reads (“maize_chr1_reference.fa”). This minimal example will run with minimal hardware requirements and should only take a few seconds per step.
Users interested in analysing their own data should first perform a quality check before proceeding with this pipeline. For example, FastQC can be used to perform basic checks of sequence data quality. Additionally, when analysing bisulfite data, it is critical to check the conversion efficiency. This is not performed in this example for simplicity; however, it should be performed on every dataset. This can be done either by using a spike-in unmethylated DNA sequence such as lambda gDNA and then mapping reads to this reference sequence or, in plants, mapping to the unmethylated chloroplast genome; good conversion rates should preferably be >99%. In this example, the WGBS data is paired end data; however, this pipeline can equally be run on single-end data; paired end data is not a requirement for UMR analysis.
All steps in this pipeline are run in the same folder that contains the provided input data and other required files. The output files are written to the same folder.
Link to the input data and scripts:
Repository: https://github.com/Bio-protocol/unmethylated-regions_UMR-extractor-WGBS/tree/master
Input data located in `/input`
Other required scripts in `/lib`
Procedure
© 2024 The Author(s); This is an open access article under the CC BY license (https://creativecommons.org/licenses/by/4.0/).
Category
Plant Science
Molecular Biology > DNA > DNA modification
Bioinformatics and Computational Biology
Do you have any questions about this protocol?
Post your question to gather feedback from the community. We will also invite the authors of this article to respond.