
- Home
- Protocols

-

Identification of Expression QTL by QTLtools in a Rice Recombinant Inbred Line Population
Published: Jun 20, 2022 DOI: 10.21769/BioProtoc.4445 Views: 921
Edited by: Jinfeng Chen Reviewed by: Chao JiangHassan Rasouli
Abstract
Expression QTL (eQTL) analysis assesses the association between the expression levels of target genes and genotypes of genetic markers to identify loci that regulate the expression of target genes. eQTL results can be used to construct genetic regulatory networks as well as increase our understanding of the regulatory mechanisms of phenotypic variation. In this protocol, we demonstrate how to use the R packages QTLtools and qqman to identify eQTLs and visualize the results using expression profiles of flag leaves from 210 rice recombinant inbred lines at the heading stage.
Keywords: eQTLBackground
A comprehensive eQTL study requires first obtaining genetic markers and expression profiles for each individual in the population, then taking the expression of each target gene as a trait (termed an expression trait, eTrait) and determining whether some markers are statistically associated with the eTrait by association analysis, and finally identifying candidate genes or regulatory sequences around the associated markers through various additional evidence. Usually, eQTL can be classified into two types: cis and trans. A cis-acting eQTL is an eQTL for a gene that is localized around that gene, indicating that sequence differences around that gene result in changes in expression levels. A trans-acting eQTL is an eQTL that is positioned distantly from the target gene it regulates, indicating that the expression level of the target gene is genetically regulated by distal factors (e.g., upstream transcription factors).
Many methods have been developed for eQTLs analysis, such as Matrix eQTL (Shabalin, 2012), FastQTL (Ongen et al., 2016), and QTLtools (Delaneau et al., 2017). To date, Matrix eQTL has been used in several large-scale studies (GTEx Consortium, 2015; Lappalainen et al., 2013), and it supports additive linear and ANOVA models with covariates, including models with correlated and heteroskedastic errors, and addresses the issue of multiple testing by calculating false discovery rates. However, the method lacks an efficient built-in permutation scheme. Another tool, fastQTL, is a user-friendly QTL mapper that implements a fast and efficient permutation scheme, capable of calculating and adjusting P-values for all significant levels with a short time (Ongen et al., 2016). The recently developed QTLtools is a modular framework that are implemented based on C++ and thus faster than the previous two tools (Delaneau et al., 2017). It also provides extensive functions, including checking the quality of the sequence data, quantifying gene expression, stratifying individuals, and integrating QTLs with GWAS results and other functional data.
In the following protocol, we explain how to use QTLtools to identify cis- and trans- eQTL and use qqman to visualize the results. The relevant code and instructions are available on GitHub (https://github.com/Bio-protocol/eQTL_Analysis_for_Rice_RIL_population).
Equipment
Personal computer, preferably with multiple processors (CPUs) to speed up computations. A Unix/Linux operating system is preferred.
Software
QTLtools (Delaneau et al., 2017) https://qtltools.github.io/qtltools/binaries/QTLtools_1.2_CentOS7.8_x86_64.tar.gz
G++ 4.8.5 (https://gcc.gnu.org/gcc-4.8/changes.html)
Glibc 2.17 (https://sourceware.org/glibc/wiki/Release/2.17)
R 3.6.1(http://www.R-project.org/)
Htslib (Bonfield et al., 2021) https://github.com/samtools/htslib/releases/download/1.12/htslib-1.12.tar.bz2
Samtools (Danecek et al., 2021) https://github.com/samtools/samtools/releases/download/1.12/samtools-1.12.tar.bz2
Bcftools (Danecek et al., 2021) https://github.com/samtools/bcftools/releases/download/1.12/bcftools-1.12.tar.bz2
Note: Before installing QTLtools, you will need to install some dependencies such as G++ 4.8.5, Glibc 2.17, HTSlib 1.9, and R 3.6.1. Details on how to install these dependencies are available in the respective software links. Installation details for Htslib, Samtools, and Bcftools can be found athttps://github.com/samtools. We recommend using Anaconda (https://www.anaconda.com/) to install the software, and the installation command is shown in the command box below.
## Installing Anaconda
wget https://mirrors.tuna.tsinghua.edu.cn/anaconda/archive/Anaconda3-4.1.0-Linux-x86.sh
bash Anaconda3-4.1.0-Linux-x86.sh
echo 'export PATH="~/anaconda2/bin:$PATH"' >> ~/.bashrc
source ~/.bashrc
## Installing Htslib
conda install -c bioconda htslib
## Installing Bcftools
conda install -c bioconda bcftools
## Installing Samtools
conda install -c bioconda samtools
## Installing R 3.6.1
conda install r-base=3.6.1
## Installing QTLtools(download and unzip to use)
wgethttps://qtltools.github.io/qtltools/binaries/QTLtools_1.2_CentOS7.8_x86_64.tar.gz
tar xzvf QTLtools_1.2_CentOS7.8_x86_64.tar.gz
cd QTLtools_1.2_CentOS7.8_x86_64
ln -s QTLtools_1.2_CentOS7.8_x86_64 QTLtools
echo 'export PATH="~/QTLtools_1.2_CentOS7.8_x86_64:$PATH"' >> ~/.bashrc
source ~/.bashrc
Data source
A population with 210 rice recombinant inbred lines (RILs) derived from a cross between two indica rice lines (Zhenshan 97 and Minghui 63) was used in this protocol (Xing et al., 2002). Expression profiles of flag leaves at the heading stage (the day of the panicle emergence) were obtained for each RIL using the Affymetrix GeneChip Rice Genome Array. The raw data are available from the National Center for Biotechnology Information Gene Expression Omnibus database under the accession number GSE49020 (Wang et al., 2014). On the microarray, the expression of a gene is measured by a group of probe pairs called a probe set. Probe sets flagged as “Present” or “Marginal” by the MAS 5.0 algorithm for at least one-third of the RILs were used as eTarits for eQTL analysis (Wang et al., 2014). A bin map with 1619 bins and 210 RILs was used as genotype data in this analysis, which was constructed from an ultrahigh-density SNP map, with complete linkage SNPs defined as a bin (Yu et al., 2011).
Preparing input files
Genotype data (VCF/BCF format, see Supplementary file)
Either the VCF or BCF format is accepted. The following example shows the format of a VCF file. Details of the VCF file can be obtained from http://vcftools.sourceforge.net/specs.html.
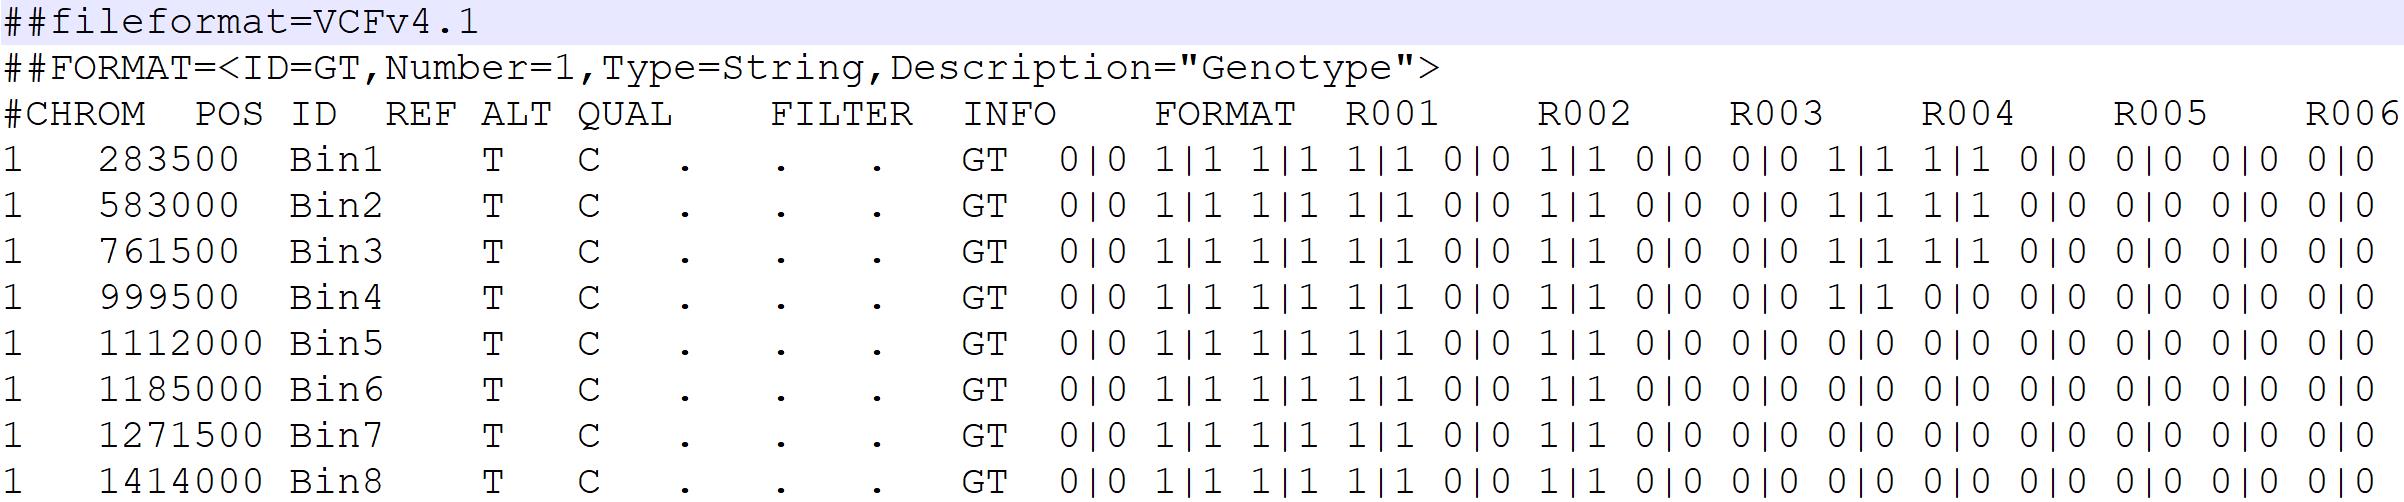
Figure 1. A screenshot of the genotype data file (VCF format).Note: The VCF/BCF file can be viewed by Bcftools.
Bcftools view myGenotypes.vcf.gz | less -SBcftools view myGenotypes.vcf.gz | less -S eTrait/phenotype data (BED format, see Supplementary file)
eTrait/phenotype data is specified using an extended UCSC BED format. One eTrait per line. The first six columns are,
Chromosome ID [string; required]
Start genomic position of each eTrait gene (e.g., the transcription start site of gene1) [integer; required]
End genomic position of each eTrait gene (e.g., the transcription termination site of gene1) [integer; required]
eTrait/phenotype ID [string; required]
Gene ID [string; optional]
Strand orientation. Missing values should be encoded as NA [+/-; optional]
The latter columns are the eTrait data of each sample.
The following is an example of a BED file.
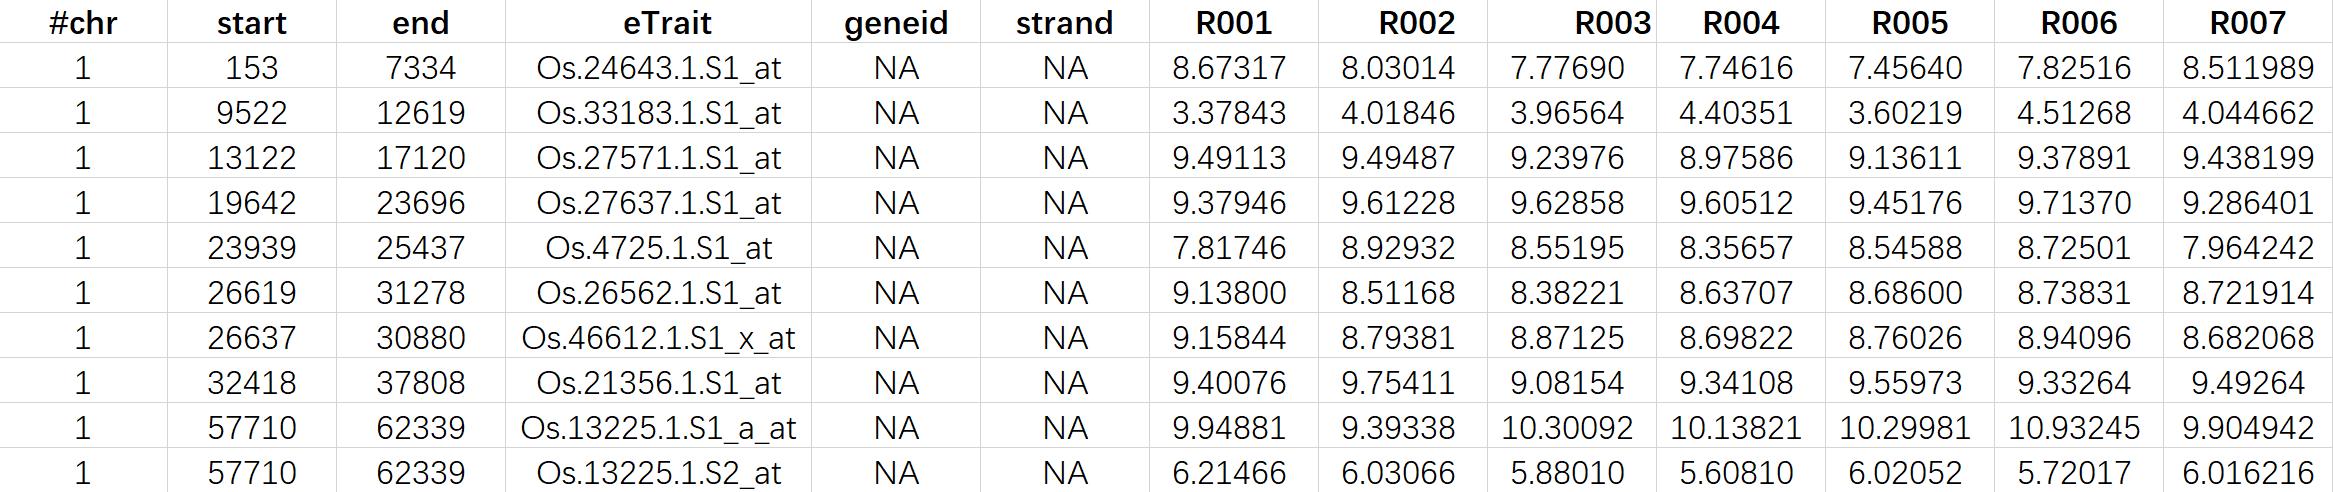
Figure 2. A screenshot of the eTrait data file (BED format).
Procedure
Category
Plant Science > Plant molecular biology > Genetic analysis
Systems Biology > Transcriptomics > Microarray
Systems Biology > Genomics > Functional genomics
Do you have any questions about this protocol?
Post your question to gather feedback from the community. We will also invite the authors of this article to respond.