
- Protocols

- About
-


Estimating phycobilisome coupling to photosystems I and II and the PSII:PSI ratio in cyanobacteria using low-temperature (77 K) fluorescence spectroscopy


Last updated date: Oct 2, 2026 DOI: 10.21769/p3003 Views: 37 Forks: 0
 Download PDF
 Ask a
question
Ask a
question
 How to
cite
How to
cite
 Favorite


Estimating phycobilisome coupling to photosystems I and II and the PSII:PSI ratio in cyanobacteria using low-temperature (77 K) fluorescence spectroscopy
Tomáš Zavřel1, Anna Segečová1, Mariann Kis2, Eva Kotabová3, Ondřej Prášil3, Jan Červený1, Gábor Bernát2
1Department of Adaptive Biotechnologies, Global Change Research Institute, Czech Academy of Sciences, Brno, Czechia
2HUN-REN Balaton Limnological Research Institute, Tihany, Hungary
3Centre Algatech, Institute of Microbiology of the Czech Academy of Sciences, Novohradská 237, Trebon 379 01, Czechia
Abstract
In cyanobacteria, phycobilisomes (PBS) harvest light and distribute the absorbed energy between photosystem II (PSII) and photosystem I (PSI), while a fraction of PBS remains functionally uncoupled from both photosystems. This energy distribution, together with the PSII:PSI ratio and the phycocyanin:phycoerythrin (PC:PE) ratio within PBS, underpins cellular acclimation to the light environment. Low-temperature (77 K) fluorescence spectroscopy is a well-established, non-invasive method to evaluate this PBS-PSII or PBS-PSI interaction. However, extracting quantitative parameters from the overlapping emission bands of intact cells is laborious and can result in inter-laboratory variability. Here, we present a complete workflow for acquiring 77 K excitation-emission spectra from filtered cyanobacterial biomass and deriving parameters of PBS coupling to photosystems (PBS-PSII, PBS-PSI, and PBS-free), the PSII:PSI ratio, and the PC:PE balance within PBS. We validate this fixed-wavelength reference method against Gaussian deconvolution. We further describe sampling conditions and sample processing steps that most strongly influence the results, and show that the semi-quantitative parameters are well suited for comparing relative changes between strains, treatments, or time points.
Key features
Enables semi-quantitative estimation of photosystem stoichiometry (PSII:PSI ratio), the phycocyanin:phycoerythrin (PC:PE) ratio, as well as the phycobilisome energy allocation (PBS-PSII, PBS-PSI, and PBS-free fractions) from low-temperature (77 K) fluorescence excitation-emission spectra of intact cyanobacterial cells.
Applies to both PC- and PE-rich cyanobacteria and is validated across four strains with diverse PC:PE compositions, including a phycobilisome-free control.
Combines a detailed experimental protocol with a freely available, standardized analysis pipeline (https://www.cyano.tools/EEM) that imports data from common spectrofluorometer formats and applies Rayleigh scattering and spectral cross-contamination corrections.
The pipeline computes the parameters using a robust fixed-wavelength reference method, and cross-validates the results against Gaussian peak deconvolution and PARAFAC using identical input data, allowing results to be directly compared, exported, and reproduced across laboratories.
Keywords
Cyanobacteria, Phycobilisome, Phycobiliproteins, 77 K fluorescence spectroscopy, Excitation-emission spectra, Photosystem stoichiometry, Energy transfer, State transitions
Graphical overview
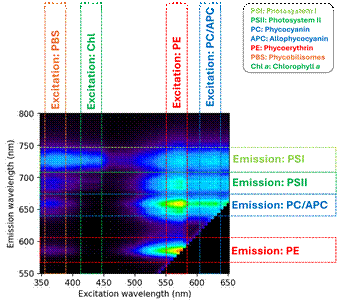
3D fluorescence excitation-emission matrix of cyanobacterial strain containing both phycocyanin and phycoerythrin in its phycobilisomes. The figure shows a 3D excitation-emission fluorescence map of the cyanobacterium Nostoc sp. CCAP 1453/38, with the schematically represented excitation and emission wavelength ranges of the individual pigments. The Nostoc sp. CCAP 1453/38 contains chlorophyll a in photosystem II (PSII) and photosystem I (PSI) as well as phycocyanin (PC) and phycoerythrin (PE) in phycobilisome (PBS) rods (Zavrel et al., 2026). This strain is a chromatic acclimator type 3, allowing for adjusting PC:PE ratio in the PBS rods (Sanfilippo et al., 2019).
Background
Cyanobacteria harvest light using an apparatus distinct from that of green algae and plants. In addition to chlorophyll a (Chl a), which forms the internal antennae of photosystem II (PSII) and photosystem I (PSI), most cyanobacteria assemble large, water-soluble phycobilisomes (PBS) on the stromal face of the thylakoid membrane. PBS consist of phycobiliproteins — allophycocyanin (APC) in the core, phycocyanin (PC) in the rods, and, in some strains, phycoerythrin (PE) at the rod periphery. PBS absorb predominantly between 500–650 nm, where Chl a absorbs only weakly, thereby extend the usable spectral range for photosynthesis (Bryant and Gisriel, 2024; Zheng et al., 2021). This extended absorption is particularly advantageous in underwater habitats, where the available light spectrum can differ substantially from sunlight (Holtrop et al., 2021).
The spectral properties of individual phycobiliproteins are determined by its covalently bound bilin chromophores. APC and PC carry phycocyanobilin (PCB), whereas PE carries predominantly phycoerythrobilin (PEB). Some strains additionally employ phycourobilin (PUB) or phycoviolobilin (PVB, the chromophore of phycoerythrocyanin), and some remodel their antennae under far-red light, incorporating red-shifted phycobiliproteins together with chlorophyll d and f, thereby extending light harvesting beyond 700 nm (Sanfilippo et al., 2019). The following protocol has been developed for strains whose phycobiliproteins contain PCB and PEB; PUB- and PVB-containing pigments and far-red acclimation states are outside its scope.
PBS distribute absorbed energy between PSII and PSI, while a fraction remains functionally uncoupled from both photosystems. Excitation energy reaches PSI by two routes: (i) transfer from the PBS terminal emitters via specific PBS–PSI coupling and (ii) indirect spillover from PSII; both mechanisms have been resolved by time-resolved fluorescence (Biswas et al., 2023; van Stokkum et al., 2023). This energy distribution is actively regulated through state transitions (van Stokkum et al., 2025), adjustment of the PSII:PSI ratio, and, in some strains, by orange-carotenoid-protein-mediated quenching (Domínguez-Martín et al., 2022). Because measurements described in this protocol are performed on intact cells, the resulting parameters reflect the net delivery of PBS excitation energy to each photosystem rather than physical attachment per se.
Steady-state fluorescence spectroscopy at 77 K (-196 °C) provides a minimally invasive way of probing PBS-PSII and PBS-PSI organization. At room temperature, the PSII and PSI emission bands overlap and the PSI contribution is weak, which prevents efficient resolving of the two emission bands in intact cells. Cooling samples to liquid nitrogen temperature suppresses thermally activated non-radiative decay and photochemistry reactions, increases the fluorescence yield, and sharpens the otherwise overlapping bands of PSII (~685, 695 nm), PSI (~720 nm), and phycobiliproteins (~650–665 nm) (Lamb et al., 2018; Remelli and Santabarbara, 2018). Recording fluorescence emission upon excitation of different pigment types yields an excitation-emission matrix from which PBS coupling (PBS-PSII, PBS-PSI, and PBS-free), and the PSII:PSI and PC:PE ratios can be estimated semi-quantitatively (Kis et al., 2026; Luimstra et al., 2020; Zavrel et al., 2026).
However, reliable estimation of these parameters requires standardized sample preparation and analysis. The choice of excitation and emission wavelengths, the correction for light scattering and spectral cross-contamination all influence the resulting estimates (Remelli and Santabarbara, 2018). This protocol provides a detailed description of the full workflow to address these limitations. It describes (i) a detailed instructions for acquiring 77 K excitation-emission spectra from intact cells of PC-, PE-, and PC/PE-containing cyanobacteria, and (ii) a standardized analytical pipeline to derive PBS coupling alongside the PSII:PSI and PC:PE ratios. The pipeline includes correction for scattering, reconstruction of 2D and 3D spectra, deriving the relevant parameters using a fixed-wavelength reference method, and cross-validation of the results against Gaussian peak deconvolution and parallel factor analysis (PARAFAC). This allows the outputs to be directly compared and reproduced across laboratories.
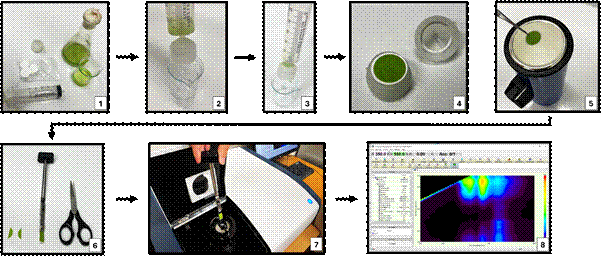
Figure 1. Summary of the measurement procedure. A 50 mL syringe and Swinnex filter holder are prepared (1), cells are harvested by filtration (2), and excess water is removed by passing additional 50 mL of air through the filter (3). The filter containing biomass is immediately frozen in liquid nitrogen (4–5) and can be stored at −80 °C. A piece of the frozen filter is cut to fit the spectrofluorometer sample holder (6), mounted onto a transparent Dewar finger (7), and measured at 77 K (8).
Materials and Reagents
Biological material
This protocol is applicable to cyanobacterial strains containing in their PBS rods either PC alone or both PC and PE. For strains containing other phycobiliproteins or far-red acclimation pigments it is necessary to verify both excitation and emission wavelength ranges before the parameters described below can be derived. This protocol was validated using excitation-emission spectra from the following strains:
Synechocystis sp. PCC 6803 (PC-rich)
Cyanobium sp. NIVA-CYA 375 (PE-rich)
Nostoc sp. CCAP 1453/38 (containing both PC and PE in the PBS rods)
Synechocystis sp. PCC 6803 PAL mutant (PBS-free control)
Laboratory supplies
Whatman® glass microfiber filters, grade GF/C or GF/B (Merck, cat. no. WHA1822024)
Swinnex® 25 mm filter holder with rubber O-ring and Luer-Lok™ (Merck, cat. no. SX0002500)
50 mL PP/PE syringe with Luer-Lok™ (VWR, cat. no. BD309653)
Hemispherical low-form Dewar flask (Merck, cat. no. SYNF241000)
Liquid nitrogen
Tweezers, 30 cm length (Merck, cat. no. F4642)
Scissors
Deionized or distilled water
Equipment
Spectrofluorometer (FP-8550, Jasco, Tokyo, Japan) equipped with a liquid-nitrogen cooling unit (PMU-130, Jasco)
−80 °C freezer (Revco™ ExF −86 °C Upright Ultra-Low Temperature Freezer, Thermo Fisher Scientific, cat. no. EXF24086V); alternatively, a −20 °C freezer (LCexv 4010, Liebherr, cat. no. 9005382197172).
Software and datasets
A freely available, standardized data analysis pipeline is accessible at https://www.cyano.tools/EEM (Zavřel, 2026). The pipeline accepts excitation-emission maps recorded at both 77 K and room temperature, imports data from several common spectrofluorometer formats including FP-8550, corrects spectra for Rayleigh scattering, and reconstructs individual excitation and emission spectra alongside complete 3D excitation-emission maps. It further computes PBS coupling to both photosystems (PBS-PSII, PBS-PSI, and PBS-free) as well as the PSII:PSI and PC:PE ratios using a fixed-wavelength reference method at 77 K (see the next section for details). Furthermore, the pipeline performs Gaussian peak deconvolution to resolve the major fluorescence components, including PSII, PSI, and PBS, and supports parallel factor analysis (PARAFAC), which includes the core consistency diagnostic (CORCONDIA) to determine the optimal number of components.
Procedure
Harvesting the biomass
Prepare the liquid culture, the filtration apparatus, and a 50 mL syringe (see Note 1).
Draw the cyanobacterial culture into the 50 mL syringe (see Note 2).
Transfer the culture onto the filter using the Swinnex® filter holder.
Pass an additional 50 mL of air (i.e., one syringe volume) through the filter to remove excess water (see Note 3).
Immediately freeze the biomass-containing filter in liquid nitrogen (see Note 4).
Optional: For long-term storage, keep the filters at −80 °C.
Cut a piece of the frozen filter (approximately 2.4 × 0.5 cm), place it in the spectrofluorometer sample holder, and insert the holder into the transparent Dewar finger (see Note 5).
Record the 3D excitation-emission spectra (see Note 6).
Recording 3D excitation-emission spectra
The following settings are optimized for the Jasco FP-8550 spectrofluorometer. For other instruments, equivalent settings must be verified prior to measurement. Recommended settings for the Jasco FP-8550 are as follows:
- Measurement mode: 3D spectra measurement
- Response: 20 ms
- Excitation bandwidth: 5 nm
- Emission bandwidth: 5 nm
- Sensitivity: low
- Excitation range: 350–650 nm (step: 5 nm)
- Emission range: 500–800 nm (step: 0.5 nm)
- Scan speed: 2000 nm/min
- Wavelength limit: Start ex. + 10 nm (see Note 7)
Data analysis
The measured fluorescence spectra allow for the semi-quantitative estimation of chlorophyll a fluorescence originating from PSII (Chl-PSII) and PSI (Chl-PSI), as well as of PBS fluorescence coupled to PSII (PBS-PSII), coupled to PSI (PBS-PSI) or functionally uncoupled from either photosystem (PBS-free). For PE-containing strains, the PC:PE ratio within the PBS can be estimated using the following equations, where Ex and Em denote the excitation and emission wavelengths, respectively ((Kis et al., 2026; Zavrel et al., 2026); see also Graphical overview ad Figure 2 for further details):
PBS attachment to PSII and PSI: PC-containing strains
 (1)
(1)
 (2)
(2)
 (3)
(3)
 (4)
(4)
PBS attachment to PSII and PSI: PE+PC-containing strains
 (5)
(5)
 (6)
(6)
 (7)
(7)
 (8)
(8)
Composition of PBS rods: PE+PC-containing strains
 (9)
(9)
PSII and PSI content: all strains
 (10)
(10)
 (11)
(11)
 (12)
(12)
Ratio of PSII internal antenna proteins CP43 and CP47: all strains
 (13)
(13)
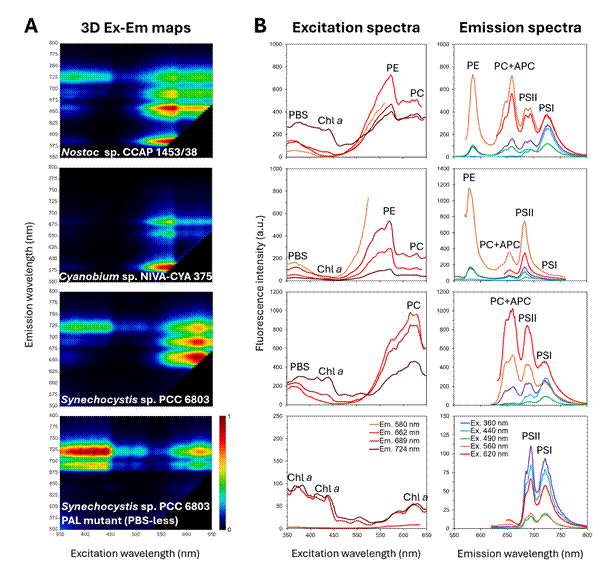
Figure 2. Representative 3D excitation-emission maps (A) and corresponding relevant excitation and emission spectra (B) of cyanobacterial strains with distinct composition of phycobilisome (PBS) rods. Nostoc sp. CCAP 1453/38 and Cyanobium sp. NIVA-CYA 375 contain both phycocyanin (PC) and phycoerythrin (PE) in the PBS rods and allophycocyanin (APC) in the PBS core, with Nostoc having a higher PC content than Cyanobium. Synechocystis sp. PCC 6803 contains only PC and APC, whereas the PBS-free control strain, Synechocystis sp. PCC 6803 PAL mutant, lacks phycobilisomes entirely (Ajlani and Vernotte, 1998). Chlorophyll a (Chl a) associated with photosystem I and II (PSI and PSII) is present in all strains.
General notes
Because the energy transfer from PBS to photosystems change during state transitions and non-photochemical quenching, cells should be brought to a defined reference state before harvesting (e.g., dark-acclimated or exposed to light of a defined intensity and spectral quality for a defined period). When the effect of a particular factor is studied, only that factor should be varied while all other cultivation and acclimation conditions should be held constant across the samples being compared.
The amount of culture sampled depends on the density of the culture suspension. An optimal biomass loading of approximately 4 µg Chl a per filter is recommended. At lower loadings, minor fluorescence peaks cannot be reliably distinguished from the dominant peaks. At higher loadings, fluorescence reabsorption increases, leading to overestimation of PSI fluorescence (see Figure 3). The Chl a concentration in the culture suspension should be therefore determined beforehand (e.g., by methanol extraction (Zavrel et al., 2015)) so that the filtered volume provides the target biomass loading.
Removing excess water from the filter minimizes ice crystal formation in the Dewar finger during measurement.
Sample handling should be both rapid and consistent across all samples. Functional PBS coupling to the photosystems can change within less than 30 s under extreme conditions, such as high light (Zavřel et al., 2026), whereas under moderate irradiance, state transitions typically occur on a timescale of minutes (Calzadilla and Kirilovsky, 2020).
During the measurement, monitor both the level and clarity of the liquid nitrogen in the Dewar finger. Ice crystals gradually accumulate and can introduce artifacts in the Rayleigh scattering region. When this occurs, discard the liquid nitrogen along with the ice crystals and refill the Dewar finger with fresh liquid nitrogen.
The full 3D excitation-emission maps are required for cross-validation of the results from a fixed-wavelength method against both Gaussian peak deconvolution and PARAFAC. In case the complete 3D excitation-emission matrix cannot be recorded, the minimum set of excitation and emission wavelengths required to derive all studied parameters depends on the pigmentation of the strain analyzed (see section Data analysis for further details).
If supported by the spectrofluorometer, setting the emission scan to start at a wavelength higher than the excitation wavelength reduces the extent of Rayleigh scattering and the need for subsequent correction.
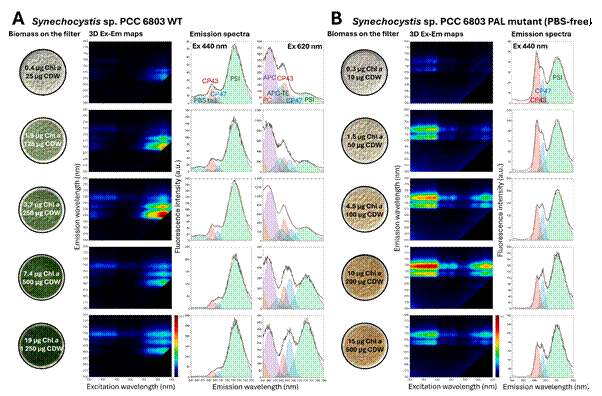
Figure 3 Biomass loading test. Representative 3D excitation-emission maps and corresponding emission spectra of Synechocystis sp. PCC 6803 WT (A) and the PBS-free PAL mutant (B) upon excitation at 440 nm and 620 nm, recorded on filters containing 0.3-19 μg Chl a, corresponding with 10-1250 μg cellular dry weight (CDW). Emission spectra were fitted with Gaussian function (Zavřel, 2026) to resolve the fluorescence contributions of the PBS tail, PSII (CP43 and CP47), and PSI (both strains), and of phycocyanin (PC), allophycocyanin (APC), APC terminal emitters (APC-TE), along with PSII and PSI (WT only). Only the fluorescence components used for parameter estimation in this protocol, along with APC-TE, are shown; other fitted components (Remelli and Santabarbara, 2018) are omitted for clarity. The APC-TE fluorescence may originate from multiple emitters (Zheng et al., 2021).
Validation
The parameters defined in this protocol, along with the accompanying analysis pipeline, have been validated in studies of spectral acclimation of cyanobacteria strains with contrasting pigment compositions. These include the PE-rich Cyanobium sp. NIVA-CYA 375 (Kis et al., 2026), the PC-rich Synechocystis sp. PCC 6803 (Zavřel et al., 2024; Zavrel et al., 2026), and Nostoc sp. CCAP 1453/38 which is a type 3 chromatic acclimator, whose PC and PE content vary depending on the wavelength of the cultivation light (Sanfilippo et al., 2019; Zavrel et al., 2026).
In addition, two factors with the greatest influence on the derived parameters were examined here. First, biomass loading on the filter should be maintained close to 4 µg Chl a (Figure 3). At lower loadings, minor emission features, such as the CP47 shoulder of PSII, are poorly resolved against the dominant fluorescence bands, reducing the reliability of peak-based parameters. At higher loadings, the total fluorescence signal decreases, while the apparent contribution of longer-wavelength emission, particularly from PSI and PBS-PSI, increases. This effect is consistent with self-shading and the reabsorption of shorter-wavelength (PSII) fluorescence within thick cell layers, leading to an underestimation of PSII fluorescence and a corresponding overestimation of PSI and PBS-PSI (Remelli and Santabarbara, 2018; Weis, 1985).
Second, the fixed-wavelength method was compared directly with Gaussian peak deconvolution. Across all three strains and the full light-quality gradient (Kis et al., 2026; Zavřel et al., 2024; Zavrel et al., 2026), the two approaches produced strongly correlated estimates (Figure 4). A systematic offset was observed between the two methods. This difference arises from (i) spectral overlap at individual emission wavelengths and (ii) the different normalization strategies of the two methods. However, as the offset is consistent across all samples, it does not affect relative comparisons. In other words, both methods rank samples similarly and capture the same trends, supporting the use of the simpler fixed-wavelength method with confidence for comparative analyses, provided that absolute values are not compared directly between methods. We note that limitation becomes apparent when one photosystem is present at very low abundance, such as in the low-PSI Cyanobium sp. NIVA-CYA 375 (Kis et al., 2026), where the weak PSI signal enters the denominator of the normalized PSII fraction. Consequently, even small differences in estimating the PSI contribution are magnified differently during normalization, which can result in varying estimation of the PSII fraction using the two methods.
Parallel factor analysis (PARAFAC) is included as a third, complementary analytical approach but requires more careful interpretation. Unlike the fixed-wavelength and Gaussian methods, which analyze each spectrum independently, PARAFAC decomposes the complete set of 3D excitation-emission matrices into a limited number of components, each sharing a common excitation and emission profile across all samples. By resolving these components, PARAFAC can separate overlapping fluorescence bands and estimate the contribution of individual emitters at their nominal peak wavelengths, providing information that cannot be obtained using point-based methods. Reliable results, however, depend on appropriate model specification. Because the optimal number of components is not known a priori, it should be determined using initial diagnostics such as the core consistency criterion (CORCONDIA) and split-half validation; over- or under-estimating the number of factors can merge or artificially split otherwise meaningful fluorescence components (Bro and Kiers, 2003; Murphy et al., 2013). PARAFAC is therefore best regarded as a tool for exploratory and comparative analyses rather than a direct replacement for the fixed-wavelength method.
Finally, the parameters derived by this protocol should be regarded as semi-quantitative. Absolute values are not expected to match those obtained by independent biochemical assays. For example, absolute PC:PE ratios determined by spectroscopic quantification of phycobiliproteins in cell extracts (Zavřel et al., 2018) differ from those estimated by the 77 K fluorescence method (Zavrel et al., 2026). Nevertheless, both approaches capture the same relative changes across strains and treatments. Accordingly, the method is best suited for comparing relative differences between strains, light conditions, or time points rather than for determining absolute stoichiometries.
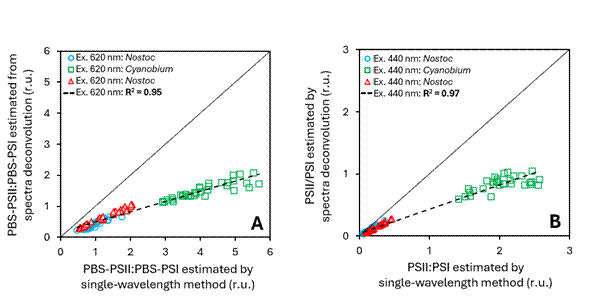
Figure 4. Comparison of the PBS-PSII:PBS-PSI ratio following PC excitation at 620 nm (A) and the PSII:PSI ratio following Chl a excitation at 440 nm (B), as estimated using the fixed-wavelength method (Equations 1-4 and 10-12; x-axis) and Gaussian peak deconvolution (y-axis). The dataset was obtained from recent studies of light-quality acclimation in Synechocystis sp. PCC 6803 (PC-rich), Cyanobium sp. NIVA-CYA 375 (PE-rich), and Nostoc sp. CCAP 1453/38 (PC- and PE-varying) (Kis et al., 2026; Zavřel et al., 2024; Zavrel et al., 2026); n = 108.
Acknowledgments
Conceptualization, T.Z., Investigation, T.Z., A.S., M.K., E.K., G.B., Writing—Original Draft, T.Z., Writing—Review & Editing, all authors, Funding acquisition, T.Z., J.Č., G.B., Supervision, T.Z. This work was supported by the Ministry of Education, Youth and Sports of the Czech Republic (LUAUS24149), and by the National Multidisciplinary Laboratory for Climate Change (RRF-2.3.1-21-2022-00014) project within the framework of Hungary's National Recovery and Resilience Plan, supported by the Recovery and Resilience Facility of the European Union. The original research papers in which the protocol was described and validated include:
Zavřel, T., Pohland, A.-C., Kis, M., Lukeš, M., Segečová, A., Kovács, L., Mareš, J., Novák, Z., Červený, J. and Bernát, G. (2026). Metabolic cost as a determinant of light quality acclimation: a full-PAR characterization of the CA3 cyanobacterium Nostoc sp. CCAP 1453/38. In bioRxiv. bioRxiv. https://doi.org/10.64898/2026.07.27.740936
Competing interest
The authors declare no conflicts of interest
Disclosures
The authors have no conflicts of interest to declare.
References
- Zavřel, T, Segečová, A, Kis, M, Kotabová, E, Prášil, O, Červený, J and Bernát, G(2026). Estimating phycobilisome coupling to photosystems I and II and the PSII:PSI ratio in cyanobacteria using low-temperature (77 K) fluorescence spectroscopy . Bio-protocol Preprint. 10.21769/p3003.
Do you have any questions about this protocol?
Post your question to gather feedback from the community. We will also invite the authors of this article to respond.
 Post a Question


