
- Protocols

- About
-


A fluorescent-based high-throughput method to quantitatively measuring PSS1-mediated phosphatidylserine synthesis

Last updated date: Sep 14, 2026 Views: 26 Forks: 0
 Download PDF
 Ask a
question
Ask a
question
 How to
cite
How to
cite
 Favorite


Abstract:
With phosphatidylcholine and L-serine, phosphatidylserine synthase 1 (PSS1) synthesizes phosphatidylserine, a phospholipid that is a key component in cell membranes. Here, we provide a step-by-step protocol examining the enzymatic acidity of PSS1 in vitro. This in vitro assay quantitatively measures Choline, a byproduct generated in the biochemical reaction, featuring simple operation, high sensitivity and low cost without the requirement for radioactive labeling. It enables rapid evaluation of PSS1 activity and is applicable to high-throughput screening of PSS1 inhibitors.
Keywords: PSS1, phosphatidylserine, phospholipid
Introduction:
Lipid metabolic dysregulation is one of the hallmark features of cancer. Tumor cells promote and sustain rapid growth, metastasis, and immune evasion through multiple mechanisms, including alterations in fatty acid synthesis, desaturation, uptake, metabolism of microenvironmental and dietary lipids, and lipid-mediated signaling pathways[1]. Targeting lipid metabolic pathways represents a promising direction for cancer therapy, with particularly rapid progress in the development of anticancer agents targeting phospholipid metabolic regulatory pathways[2].
Phospholipids are essential components of biological membranes, including phosphatidylcholine (PC), phosphatidylserine (PS), phosphatidylethanolamine (PE), and phosphatidylinositol (PI). Their relative proportions play crucial roles in maintaining membrane stability and regulating phospholipid-mediated signaling pathways[3]. Among these, PS accounts for approximately 2–15% of cellular phospholipids. Despite its relatively low abundance, PS occupies a central position in phospholipid metabolism[3].
In human cells, intracellular PS synthesis is catalyzed by two isoforms: phosphatidylserine synthase 1 (PTDSS1, also known as PSS1) and phosphatidylserine synthase 2 (PTDSS2, also known as PSS2)[4]. PSS1 can catalyze the conversion of either PC or PE into PS and is frequently overexpressed in various tumor cell types. In contrast, PSS2 specifically utilizes PE as a substrate for PS synthesis and is deficient in certain cancer types. Based on their distinct protein functions and existing literature, PSS1 and PSS2 constitute a promising synthetic lethal gene pair. Targeted inhibition of PSS1 can selectively kill tumor cells with PSS2 deficiency, representing a potential cancer therapeutic target[5].
Targeted inhibition of PSS1, leading to reduced levels of newly synthesized PS in cells, may exert cytotoxic effects through multiple mechanisms, including modulation of tumor immunity, suppression of angiogenesis, and attenuation of PI3K/AKT pathway activation[6]. Such an approach could be effective either as monotherapy or in combination with other targeted therapies, antibody-based drugs, or immunotherapies to achieve antitumor efficacy. Its potential indications may extend beyond PSS2-deficient tumors, highlighting its significant cancer therapeutic value.
Basic protocol
In this protocol, recombinant PSS1 is generated to synthesize PS in the presence of PC and L-serine. In this biochemical reaction, Choline is generated along with PS as a byproduct. The synthesized Choline is treated with Choline oxidase to produce H2O2, which reacts with Amplex Red in the presence of horseradish peroxidase (HRP) to for resorufin. Resorufin is a highly red fluorescent product that can be quantitatively measured by luminometer. We have pretreated PSS1 by its specific inhibitors DS55980254 and DS68591889[7], and demonstrated the inhibition of PSS1 in this in vitro assay.
Materials and Reagents
- HEPES/NaOH pH=7.5 (Gibco, catalog number: 15630080)
- CaCl2 (Sangon Biotech, catalog number: A501330-0500)
- Choline oxidase (Sigma, catalog number: C5896)
- HRP (Beyotime, catalog number: ST2569)
- Amplex Red (Beyotime, catalog number: ST010)
- L-serine (Sigma-Aldrich, catalog number: P0474)
- PC (Sigma, catalog number: P3556)
- CulturePlate-384 (PerkinElmer, catalog number: 6007680)
- Microplate sealing film (Beyotime, catalog number: FSF025)
- Dimethyl sulfoxide (DMSO) (Absin, catalog number: abs9187)
Equipment
- Nano Drop (Thermo, NanoDrop™ One/One C)
- Multi-channel pipette (Thermo, E1-ClipTip)
- Temperature-controlled incubator (Boxun, HPX-9162MBE)
- Automated liquid handler (ThermoFisher, Multidrop Pico 8)
- Microplate luminometer (Thermo, VarioskanLUX)
- Horizontal plate centrifuge (Cence, TDZ5-WS)
- Microplate thermo-shaker (ALLSHENG, MS-100)
- Ultrapure water system (Merck, Milli-Q)
- Pipettor (Eppendorf)
Software
GraphPad Prism 10.1
Procedure
- Purification of PSS1.
- The plasmid encoding full length PSS1 with an N-terminal Flag and His tag and a C-terminal HA tag was constructed. Recombinant PSS1 protein was expressed via the SF9 cell expression system, followed by collection of the membrane fraction. The harvested protein stock, with a concentration of 34.520 mg/mL, was preserved in storage buffer (20 mM Tris/HCl, 20% glycerol, 1 mM TCEP, pH 7.8) and ready for subsequent activity assays.
- In vitro PSS1 Assay
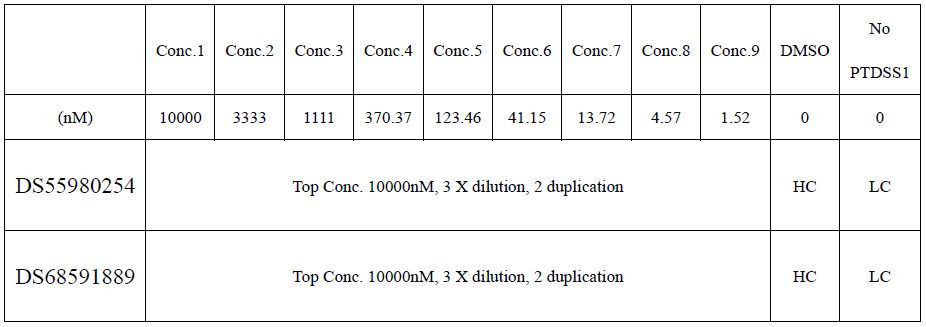
- Test compounds DS55980254 and DS68591889 were pre-diluted to a concentration of 0.5 mM, and subsequently transferred into a 384-well microplate by a Multidrop Pico 8 liquid handler. The liquid handler was programmed to add serially diluted test compounds at designed assay concentrations (top concentration of 10 μM with 3-fold serial dilution and 2 replicate wells per concentration.). Dimethyl sulfoxide (DMSO) was used for signal normalization. The detailed plate map is presented below.
Table-1. The detail of the assay plate map. DMSO group served as the high control (HC) without test compounds, while the group without PSS1 protein was set as the low control (LC).
- Prepare reaction buffer-1 (see Recipes) as general working buffer.
- Prepare 2× PSS1 reaction solution (see Recipes) mixture by reaction buffer-2 (see Recipes) and reaction buffer-3 (see Recipes).
- Add 25 μL of the 2 × PSS1 reaction solution mixture to each well of the 384-well plate.
- Centrifuge the 384-well plate at 1000 rpm for 1 minute using a horizontal plate centrifuge, followed by incubation at 26 °C for 90 minutes in a constant-temperature incubator.
- Prepare 6 × choline oxidase solution (see Recipes) by reaction buffer-4 (see Recipes).
- Add 5 μL of the 6 × choline oxidase solution mixture to each well of the 384-well plate.
- Place the microplate into the thermomixer and pre-incubate with shaking at 26°C for 1 minute.
- Centrifuge the 384-well plate at 1000 rpm for 1 minute using a horizontal plate centrifuge, followed by incubation at 26 °C for 2 hours in a constant-temperature incubator.
- Prepare 2.5 × HRP/Amplex Red working solution (see Recipes) with reaction buffer-5 (see Recipes) following standard preparation instructions.
- Add 20 μL of the 2.5 × HRP/Amplex Red mixture to each well of the 384-well plate.
- Centrifuge the 384-well plate at 1000 rpm for 1 min using a horizontal plate centrifuge, followed by incubation at 26 °C for 10 minutes in a constant-temperature incubator.
Measure luminescence signals with a microplate reader; set the reading integration time per well to 1000 ms.
Data Analysis
Quality Control (QC): Calculate CV% (Low control), CV% (High control), and Z' factor separately using the formulas listed below. The assay passes quality control criteria if CV% (Low control) < 20%, CV% (High control) < 20%, and Z' > 0.5. S/B (window) = Mean High control / Mean Low control
CV% (Low control) = 100 × (SD of Low control / Mean Low control)
CV% (High control) = 100 × (SD of High control / Mean High control)
Z' = 1 − 3 × (SD Low control + SD High control) / (Mean High control − Mean Low control)The percentage inhibition of each compound was calculated according to the following formula:
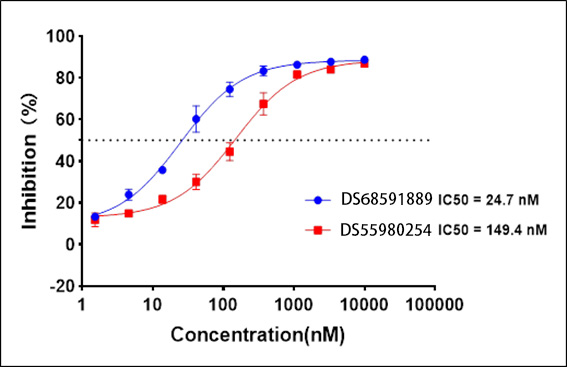
% inhibition for compound = 100 × (Mean High control − Compound well signal) / (Mean High control − Mean Low control)Nonlinear regression analysis was performed using GraphPad Prism 10.1 to fit compound inhibition curves and calculate IC₅₀ values, with the fitting equation shown below (see Figure 1):
Y=Bottom + (Top-Bottom)/(1+(IC50/X)^HillSlope)
Figure 1. Dose–Response Curves for IC₅₀ fitting of DS55980254 and DS68591889
Recipes
1. Reaction buffer-1
Reagent | Final Concentration |
HEPES/NaOH pH=7.5 | 50 mM |
CaCl2 | 5 mM |
2. Reaction buffer-2
Reagent | Stock Concentration |
PSS1 | 1 mg/ml |
HEPES/NaOH pH=7.5 | 50 mM |
CaCl2 | 5 mM |
3. Reaction buffer-3
Reagent | Stock Concentration |
L-serine | 100mM |
PC | 10mM |
HEPES/NaOH pH=7.5 | 50 mM |
CaCl2 | 5 mM |
4. Reaction buffer-4
Reagent | Stock Concentration |
Choline oxidase | 100 U/ml |
HEPES/NaOH pH=7.5 | 50 mM |
CaCl2 | 5 mM |
5. Reaction buffer-5
Reagent | Stock Concentration |
HRP | 200 U/ml |
Amplex Red | 100 mM |
HEPES/NaOH pH=7.5 | 50 mM |
CaCl2 | 5 mM |
6. 2 × PTDSS1 reaction solution
Reagent | Final Concentration |
PSS1 | 0.1 mg/ml |
HEPES/NaOH pH=7.5 | 50 mM |
CaCl2 | 5 mM |
L-Serine | 2 mM |
PC | 200 μM |
7. 6 × choline oxidase solution
Reagent | Final Concentration |
Choline oxidase | 0.6 U/ml |
HEPES/NaOH pH=7.5 | 50 mM |
CaCl2 | 5 mM |
8. 2.5 × HRP/Amplex Red solution
Reagent | Final Concentration |
HRP | 0.5 U/ml |
Amplex Red | 250 μM |
HEPES/NaOH pH=7.5 | 50 mM |
CaCl2 | 5 mM |
Commentary
Critical Parameters
It is important to premix the small compound inhibitor with PSS1, so that the inhibitor is able to bind to and abolish the enzymatic activity of PSS1. Moreover, 5 mM CaCl2 is critical to activate the enzymatic activity of PSS1. To arrest the reaction completely, 25 mM EDTA can be applied before the sample is measured by microplate reader.
Troubleshooting Table
Common problems observed in this in vitro assay are summarized in Table 2.
Table 2. Troubleshooting Guide
Problem | Possible Cause | Solution |
No signal | The recombinant PSS1 loses the enzymatic activity. | It is important prepare PSS1 from sf9 cells to allow the correct folding of PSS1. |
| Reaction time of PSS1 is insufficient. | Minimal reaction time is 90 minutes. The reaction time can be increased to two hours. |
Signals are observed in the negative control. | The recombinant PSS1 is contaminated. | Using FPLC and ion-exchange column to purify PSS1. |
Understanding Results
In this in vitro assay, two different known compounds DS55980254 and DS68591889 were preincubated with PSS1. With a serial of dilution, we measured the IC50 of DS55980254 and DS68591889 as 149.4 and 24.7 nM respectively (Figure 1), which are similar to what have been reported earlier. Moreover, with DMSO but not any inhibitor pretreatment, we have demonstrated PSS1 as a positive control. Without PSS1, we did not detect any signal, which serves as a negatively control. Thus, these results validate the reliance of this in vitro assay. Since the procedure of this assay is simple and straightforward, it is suitable to be used as a high-throughput assay to screen the inhibitor of PSS1 for future cancer therapy.
Time Considerations
With all the reagents, it only takes five hours to perform the in vitro assay to measure the enzymatic activity of PSS1.
Acknowledgments
We thank colleagues at SynRx Therapeutics for the help. This work was supported by the laboratory of SynRx Therapeutics.
Author Contributions
Y.C. conceptualization; A.Y. and Y.C. investigation, methodology, validation, and writing the protocol manuscript.
Conflict of interest
The authors declare that they have no conflicts of interest with the contents of this article.
Data Availability Statement
The data, tools and material that support the protocol are available from Y.C. upon reasonable request.
References
1. Zhang, F. and G. Du, Dysregulated lipid metabolism in cancer. World J Biol Chem, 2012. 3(8): p. 167–74.
2. Gupta, A., D. Das, and R. Taneja, Targeting Dysregulated Lipid Metabolism in Cancer with Pharmacological Inhibitors, in Cancers (Basel). 2024: Switzerland.
3. Leventis, P.A. and S. Grinstein, The distribution and function of phosphatidylserine in cellular membranes. Annu Rev Biophys, 2010. 39: p. 407–27.
4. Tomohiro, S., et al., Purification and characterization of human phosphatidylserine synthases 1 and 2, in Biochem J. 2009: England. p. 421–9.
5. Yoshihama, Y., et al., Potent and Selective PTDSS1 Inhibitors Induce Collateral Lethality in Cancers with PTDSS2 Deletion, in Cancer Res. 2022: United States. p. 4031–4043.
6. Omi, J., et al., Phosphatidylserine synthesis controls oncogenic B cell receptor signaling in B cell lymphoma, in J Cell Biol. 2024: United States.
7. Suzuki, K., et al., Efficient Multikilogram-Scale Synthesis of PTDSS1 Inhibitor: Development of a Practical and Scalable Optical Resolution Method for Chiral 2,3-Pyrrolidinedione. Organic Process Research & Development, 2024. 28(6): p. 2296–2308.
- Yu, A and Cui, Y(2026). A fluorescent-based high-throughput method to quantitatively measuring PSS1-mediated phosphatidylserine synthesis. Bio-protocol Preprint. bio-protocol.org/prep2996.
Do you have any questions about this protocol?
Post your question to gather feedback from the community. We will also invite the authors of this article to respond.
 Post a Question


