
- Home
- Protocols

-

Proteoliposome-based in vitro transport assays
Last updated date: Oct 27, 2024 DOI: 10.21769/p2739 Views: 629 Forks: 0
Proteoliposome-Based in vitro Metal Ion Transport Assays
Shamayeeta Ray1, and Rachelle Gaudet1, *
1Department of Molecular and Cellular Biology, Harvard University, Cambridge, MA USA
*For correspondence: gaudet@mcb.harvard.edu
Abstract
Natural resistance associated macrophage protein (Nramp) transporters, found in most organisms, mediate import of divalent transition metal ions (primarily Fe2+ and Mn2+) across cellular or organellar membranes into the cytosol, thus help maintaining homeostasis of these essential ions. To measure the transport activity of wildtype or variant Nramps with different divalent metal ion substrates under different conditions in vitro, we describe a proteoliposome-based transport assay that uses a fluorescent dye, Fura-2, specific to divalent metal ions, to indicate the amount of metal imported inside the liposomes. The fluorescent signal observed over time provides a measure of the amount of metal imported. With this protocol, we can readily vary conditions such as metal ion substrate, substrate concentration, internal or external pH, temperature, and membrane potential. This protocol can also be readily adapted to other substrates by changing the fluorescent dye, and to measuring proton fluxes using pH-dependent dyes.
Key features
Membrane proteins are reconstituted into preformed liposomes by dialyzing out the detergent which has a high critical micelle concentration.
In vitro assay provides control over many different conditions.
Intraliposome fluorescent dye enables continuous measurements of transport kinetics, unlike other endpoint assays.
Keywords: Nramps, divalent metal ions, proteoliposome, fluorescence
This protocol is used in: eLife (2023), DOI: 10.7554/eLife.84006
Materials and reagents
Biological materials
Purified WT and mutated variant Nramp proteins [1,2], which we express in Escherichia coli C41(DE3) (Lucigen, catalog number: 60442–1) encoded in a pET21a-N8H vector1 with an N-terminal 8xHis-tag. Our protein samples are solubilized with 1% DDM and concentrated to 1.2 mg/mL and flash-frozen in liquid nitrogen and stored at -80 °C until ready for use.
Note: For best results, you need to use a detergent with a high critical micelle concentration like DM, which can be dialyzed away.
Reagents
1-palmitoyl-2-oleoyl-sn-glycero-3-phosphoethanolamine (POPE) dissolved in chloroform at 25 mg/mL (Avanti Polar Lipids, catalog number: 850757C)
1-palmitoyl-2-oleoyl-sn-glycero-3-phospho-(1'-rac-glycerol) (POPG) dissolved in chloroform at 25 mg/mL (Avanti Polar Lipids, catalog number: 840457C)
Pentane (Sigma-Aldrich, catalog number: 158941)
Nitrogen gas (Airgas, catalog number: NI 300)
Valinomycin (Sigma-Aldrich, catalog number: V0627)
Ionomycin (Sigma-Aldrich, catalog number: I0634)
n-Decyl-β-D-Maltopyranoside (DM; Anatrace, catalog number: D322S)
Fura-2 (Life Technologies, catalog number: F-1200)
Dry ice
Ethanol (for dry ice / ethanol bath)
3-(N-morpholino)propanesulfonic acid (MOPS; Sigma-Aldrich, catalog number: M3183)
Sodium hydroxide solution for pHing buffers
KCl (Sigma-Aldrich, catalog number: P9541)
NaCl (VWR, catalog number: 97063-368)
Ethylenediaminetetraacetic acid (EDTA; Alfa Aesar, catalog number: A15161)
MnCl2 (Alfa Aesar, catalog number: 11563)
CdCl2 (Fisher Scientific, catalog number: AA2012914)
Solutions
1 L of Dialysis Buffer 1 (90 mM KCl, 30 mM NaCl, 10 mM MOPS pH 7.0 adjusted with NaOH, 0.2 mM EDTA)
1 L of Dialysis Buffer 2 (90 mM KCl, 30 mM NaCl, 10 mM MOPS pH 7.0 adjusted with NaOH, 0.1 mM EDTA)
1 L of Dialysis Buffer 3 (90 mM KCl, 30 mM NaCl, 10 mM MOPS pH 7.0 adjusted with NaOH)
Liposome Resuspension Buffer (Dialysis Buffer 3 + 5 mM DM)
Equilibration Buffer (120 mM NaCl, 10 mM MOPS pH 7.0 adjusted with NaOH)
Exchange Buffer (100 mM NaCl, 10 mM HEPES pH 7.5, 0.1% DM)
NaCl Buffer (115 mM NaCl, 10 mM MOPS pH 7.0 adjusted with NaOH)
KCl Buffer (115 mM KCl, 10 mM MOPS pH 7.0 adjusted with NaOH)
1 mM valinomycin stock (prepared in 100% ethanol and stored at -20 °C)
5 mM Fura-2 stock in water (stored at -20 °C)
5 µM ionomycin stock in water (stored at -20 °C)
Laboratory supplies
Pipette tips for your micropipettes
Glass test tubes (Avantor, catalog number: 47729-576)
Parafilm (VWR, catalog number: 52858-000)
Tubing for gas nitrogen stream (e.g., VWR, catalog number: 60985-532)
3-mL Dialysis cassettes with 10K MWCO (Thermo Fisher scientific, catalog number: 66455)
3 mL syringes (BD, catalog number: 309657)
Low-gauge needles, such as 18 G x 1-1/2 in (BD, catalog number: 305196)
PD-10 columns (Cytiva, catalog number: 17085101)
50 mL polypropylene conical centrifuge tubes (VWR, catalog number: 21008-242)
15 mL polypropylene conical centrtifuge tubes (VWR, catalog number: 21008-216)
1.5 mL microcentrifuge tubes (VWR, catalog number: 20170-038)
400-nm filters (GE Healthcare Life Sciences, catalog number: 10417104)
Filter supports (Cytiva, catalog number: 230300)
96-well black clear-bottomed cell culture microplates as assay plate (Greiner, catalog number: 655090)
96-well clear round-bottomed polystyrene microplates as compound plate (VWR, catalog number: 62409-114)
200 µL black FlexStation pipette tips in 96-well blocks (Molecular Devices, catalog number: 9000-0911)
Equipment
Chemical safety hood (to handle lipids in chloroform solution)
Micropipettes
8-Channel multichannel pipettor
500 mL glass beaker
Regulator for nitrogen gas cylinder (VWR, catalog number: 55850-205)
1 L glass beakers
Stir plate (VWR, catalog number: 10153-310)
Stir bar
Bath sonicator (Branson, model number: 1510R-MT)
Floating microfuge tube rack (Fisher Scientific, catalog number: 1412744)
Cold room or refrigerator at 4 °C
Mini extruder (Avanti Polar Lipids, catalog number: 610020-1EA)
Gas-tight syringe needles (Avanti Polar Lipids, catalog number: 610017-1EA)
Ice bucket (Corning catalog number: CLS432129)
A fluorescence microplate reader; we use a FlexStation 3 Plate Reader (Molecular devices)
Software and datasets
Microsoft Excel for data analysis (any data analysis software can be used)
Procedure
Proteoliposome preparation – Day 1
Calculate the volume of liposomes needed for a particular set of experiments. Typically, 20 µL gives sufficient signal for 1 well of a 96-well plate in a transport assay. At least 1 mL of liposome should be prepared of any given protein sample for ease of handling. To account for sample loss, prepare ~10% more liposomes than you will need. We typically prepare 2.5 mL of liposomes per protein sample.
Prepare the buffers you will need.
Note: Buffers should be free of potential metal ion contaminants. Be sure to use clean glassware in preparing the buffers.
We purchase the lipid reagents as 25 mg/mL solutions in chloroform. The liposomes we prepare contain a mixture of 75% POPE and 25% POPG. Calculate the required volume of each lipid to prepare the desired quantity of liposome solution at a final concentration of 20 mg/mL total lipid mixture (i.e., 15 mg/mL POPE and 5 mg/mL POPG).
Liposome preparation. Perform steps b through f in the chemical safety hood.
Warm up the lipid solutions to room temperature and make sure that the solutions are dissolved and well mixed.
Note: POPG often precipitates out when stored at -20 °C, so it should be either redissolved before measuring or should be mixed well if using the whole aliquot so that all the precipitated lipid is transferred.
In the chemical safety hood, measure and transfer the required amounts of POPG and POPE in chloroform in a 50 ml conical centrifuge tube, mix well.
Aliquot in 2-mL volumes to glass test tubes. Cover test tubes with parafilm.
Fill a 500 mL beaker with warm tap water (approximately 37 °C). One at a time, dip the glass tubes in the warm water so that the dissolved lipids are temperature-controlled and use a light nitrogen stream from a nitrogen gas cylinder to evaporate the chloroform. Control the nitrogen gas stream by a regulator with a knob and an outlet connection tubing with a 200 µL tip attached at the other end of the tubing through which the nitrogen gas can come out at your desired flowrate. We usually use a flowrate of 5-10 psi in the beginning to ensure no chloroform spilling out and then as evaporation continues, we increase the flowrate to 10-15 psi to ensure complete evaporation. It also helps to replace the warm water in the beaker occasionally to maintain the temperature and speed the evaporation process.
Redissolve each aliquot of lipid mixture in 1 mL of pentane.
Evaporate the pentane, again using a nitrogen stream and warm water bath.
The rest of the steps can be done at the bench. Resuspend the dried lipids in Liposome Resuspension Buffer, making sure to break up all the lumps so that the lipids are well mixed into the buffer.
Sonicate two tubes at a time in a bath sonicator by placing the tubes attached to a tube holder at the center of the sonicator, where sonication is most effective. Sonicate until the liquid in the tubes becomes transparent rather than translucent; the liquid in the test tubes should be perturbed by the sonication, indicating proper sonication. This typically takes 5-20 minutes for each test tube. It helps to pipet up and down if some lipid is really caked on the bottom of the test tube.
Pool and mix all liposomes in a 50 mL conical centrifuge tube to generate one common stock. We consider this suspension the liposomes at 20 mg/mL.
Aliquot into 15 mL conical centrifuge tubes (for volumes > 1.5 mL) or microfuge tubes (for volumes ≤ 1.5 mL), one for each of the different proteins that will be reconstituted, and an additional one for the empty liposome control.
Add 1:400 mass protein:mass lipid, or add similar volume of Exchange Buffer for empty liposomes control. This usually means adding 104 µL of protein solution at 1.2 mg/mL to 2.5 mL of liposome at 20 mg/mL.
Transfer each protein-detergent-lipid mixture (~2.6 mL in this case) to its own dialysis cassette, using a syringe and low-gauge needle and following the manufacturer’s instructions, and dialyze overnight in a 1 L beaker in 1 L of Dialysis Buffer 1 on a stir plate with a stir bar at 4 °C.
Note: use a dialysis cassette of the appropriate volume for your own proteoliposome volume needs.
Proteoliposome preparation – Day 2
Move the dialysis cassettes into a 1 L beaker with 1 L of Dialysis Buffer 2 and dialyze overnight on a stir plate with a stir bar at 4 °C.
Proteoliposome preparation – Day 3
Move the dialysis cassettes into a 1 L beaker with 900 mL of Dialysis Buffer 3 and put the beaker with cold buffer on bench overnight on a stir plate with a stir bar to let it gradually equilibrate to room temperature for the third dialysis round. Save the last 100 mL of Dialysis Buffer 3 in a bottle for the next day.
Dye-loaded proteoliposome preparation – Day 4
All procedures on this day are performed at room temperature. The fluorescent dyes are light-sensitive, so we use aluminum foil and cardboard boxes to protect samples from light, and dim the room lights when possible, to protect the dyes.
Use a syringe with low-gauge needle to aspirate the proteoliposomes out of each dialysis cassette. Transfer to either microcentrifuge tubes or 15 mL conical centrifuge tubes, depending on the total volume. We use 15 mL conical centrifuge tubes to transfer 2.5 mL of proteoliposomes from the dialysis cassettes.
Make a 5 mM Fura-2 stock in water. Store any leftover Fura-2 solution at -20 °C for future use.
Note: Fura-2 is light sensitive. Keep in the dark as much as possible, for example, by wrapping the tubes in foil.
Add appropriate amount of 5 mM Fura-2 solution to get a 100 µM final Fura-2 concentration. That is, add 1 µL of Fura-2 for each 49 µL of proteoliposomes. Here you can aliquot 1 mL volumes of proteoliposome + dye into 1.5 mL microcentrifuge tubes to use as experimental replicates for assaying on different days.
Note: Try to keep the liposomes in the dark as much as possible after adding the fluorescent dye.
Make up a dry ice/ethanol bath by adding ethanol to dry ice in an ice bucket. Freeze-thaw proteoliposomes 2 times by alternately putting floating racks holding the microcentrifuge tubes filled with samples in dry ice/ethanol bath and warm tap water (in a bucket or beaker; approximately 37 °C)
Freeze the proteoliposomes a third time in the dry ice / ethanol bath,
Note: After this third freeze, you can store 1 mL fractions of proteoliposomes in microcentrifuge tubes at -80 °C indefinitely to pick up from here another day.
Thaw the proteoliposome in air at room temperature this third time (this takes ~30-60 minutes).
Extrusion of proteoliposomes and final sample preparation
Note: Extrusion of proteoliposomes should be done on the same day that you perform your transport assay. Extruded proteoliposomes should not be freeze-thawed, as this could lead to leakage of the dye outside of the liposomes. Make sure you have the samples and the amounts of thawed liposomes necessary for the assay you would like to perform.
All procedures on this day are performed at room temperature. The fluorescent dyes are light-sensitive, so we use aluminum foil and cardboard boxes to protect samples from light, and dim the room lights when possible, to protect the dyes.
Assemble the mini extruder with two filter supports and one 400-nm filter, according to the manufacturer instructions. Use some of the saved up Dialysis Buffer 3 to wash the extruder parts and the syringes and wet the filter paper and filter supports.
Note: Avanti Polar Lipids has very useful YouTube videos that explain how to use their mini extruder:
https://www.youtube.com/watch?v=-DiLz9uf49s
https://www.youtube.com/watch?v=8ei62ZmLgSM
Extrude 19-20 times, 1 mL at a time per sample. The filter and filter supports should be replaced, and the gas-tight syringes rinsed and cleaned with water and Dialysis Buffer 3 after every construct.
Equilibrate the appropriate number of PD-10 columns (1 column per mL of sample) with 3 × 5 mL of Equilibration Buffer.
Working one column at a time, add 1mL of the extruded liposomes and let them completely enter the column. Add 4 mL Equilibration Buffer and collect fractions 2-3 drops per well in a 96-well black clear-bottomed cell culture microplate. You can fill the plate with each of your samples. Make sure to keep track of the respective sample positions.
Measure the optical density at 600 nm (OD600; Figure 1) and fluorescence (λex = 340 and 380 nm, at λem = 510 nm for Fura-2; Figure 2) for all fractions on the plate on the fluorescence plate reader. On the FlexStation 3, we set up the Endpoint mode to measure the absorbance and fluorescence of the proteoliposome samples.
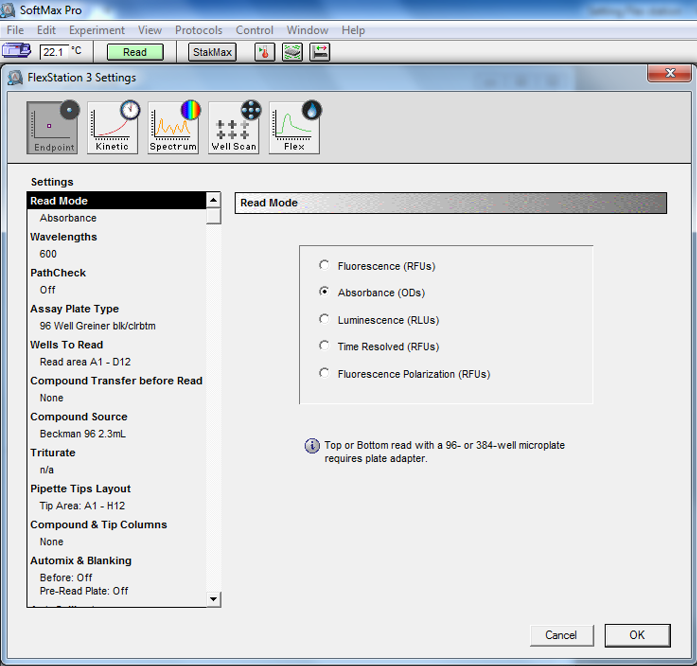
Figure 1. Screenshot from OD600 absorbance reading setup in SoftMax Pro for proteoliposomes elution fractions from a PD-10 column. We use the Endpoint mode, select Absorbance (ODs) and set the wavelength to 600 nm.
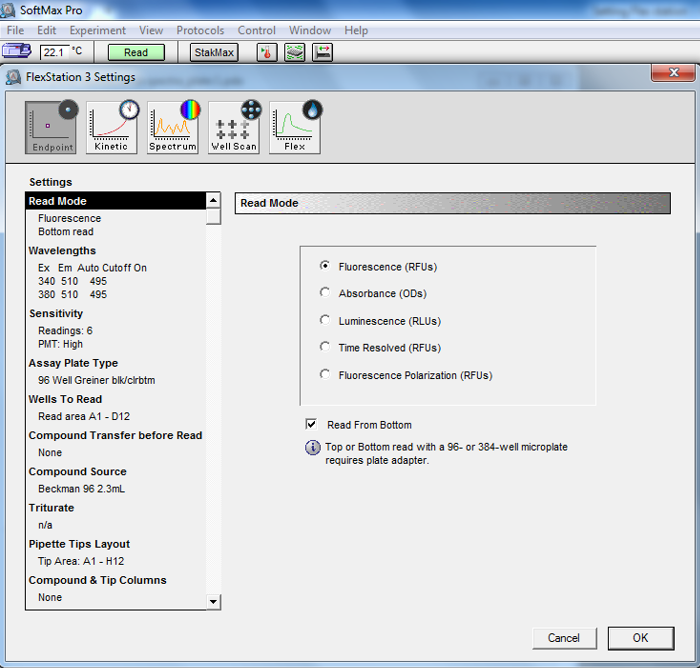
Figure 2. Screenshot from fluorescence reading setup in SoftMax Pro for proteoliposomes elution fractions from a PD-10 column. We use the Endpoint mode, select Fluorescence (RFUs) and set the excitation wavelengths to 340 nm and 380 nm, and the emission wavelength to 510 nm.
Pool the best fractions for each sample (Figure 3). For the OD600, select the peak fractions, leaving out the early initial-rise and the late-declining fractions. For the 340/380 fluorescence ratio, the best fractions should be close to 1-1.5. Discard any fractions whose 340/380 fluorescence ratio is >2.
Note: Err on the side of leaving out the last few fractions because they likely will have free dye outside of the proteoliposomes (which can be seen in the rising 340/380 fluorescence ratio of the fractions) and some KCl carried over from the dialysis buffers (which is not desired on the outside of the proteoliposomes as it will prevent the generation of large membrane potentials).
Dilute the liposomes in Equilibration Buffer as needed to get the fluorescence values into the appropriate range. For Fura-2, this corresponds to about 500-1000 RFUs.
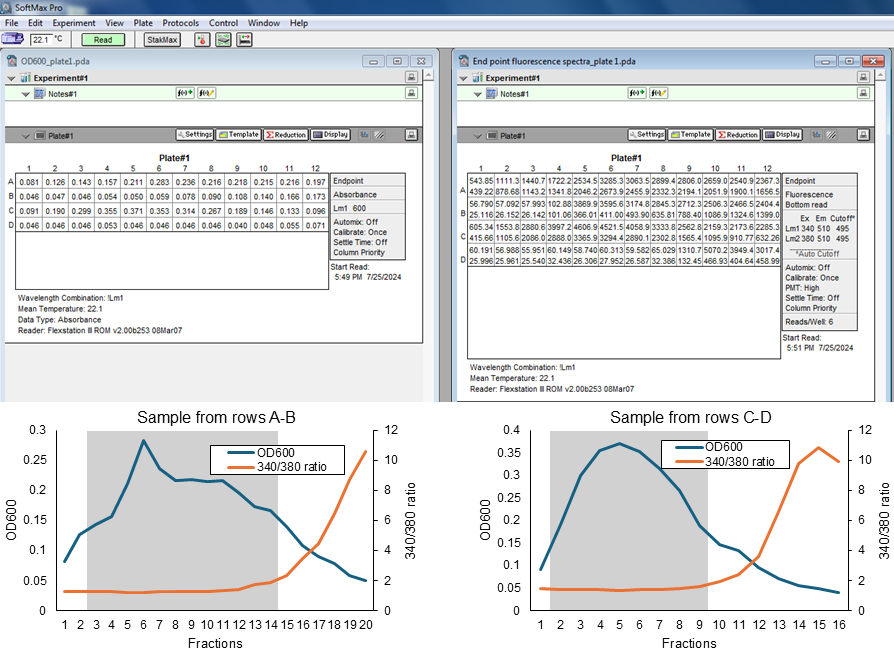
Figure 3. Sample data from two different sets of elution fractions from PD-10 columns (rows A-B and rows C-D, respectively). At the top left are the OD600 values, and at the top right are the raw fluorescence values (340 nm at the top, and 380 nm at the bottom). The graphs on the bottom are the resulting plotted OD600 and 340/380 ratios. The grey shadings indicate the fractions pooled for these samples.
Transport assay
Figure 4A illustrates the general principle, setup, and variables of the proteoliposome-based transport assay, and Figure 4B provides an example result for one sample well after data processing.
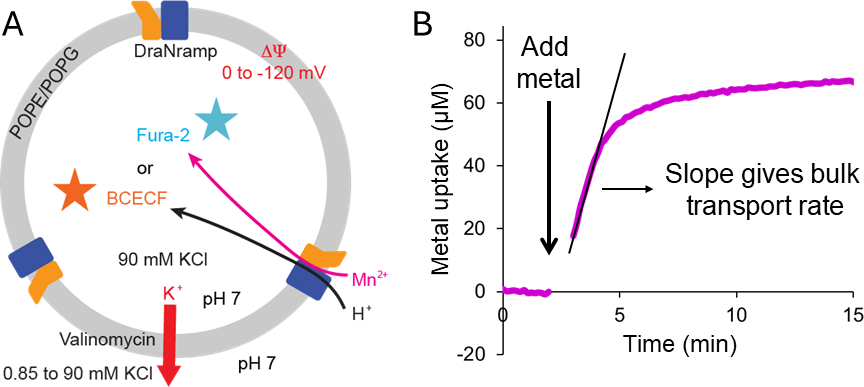
Figure 4. Proteoliposome based transport assay. (A) Schematic of a proteoliposome highlighting the design details for the assay setup. The proteoliposome membranes are a mixture of POPE and POPG. The intraliposome KCl concentration is set to 90 mM, and the extraliposome concentration is varied from 0.85 to 90 mM KCl, with a corresponding NaCl concentration adjusted to obtain a total of 90 mM (K+ + Na+). When valinomycin is added to the liposome solution, this will allow K+ ions to flow out of the proteoliposomes and create a membrane potential (ΔΨ) ranging from 120 mV (with 0.85 mM KCl) to 0 mV (90 mM KCl). Typically, we set the pH to 7 on both sides, but this can be varied. The fluorescent dye used in the assay (like Fura-2 for divalent metals, or BCECF for protons) is incorporated inside the proteoliposomes by repeated freeze-thaw cycles. As the divalent metals (Mn2+ illustrated here; or protons) are transported into the proteoliposome by the Nramp protein (shown as a blue and yellow), they bind the Fura-2 dye (or BCECF for protons) which alters its fluorescence, providing a change in signal that we measure over time. (B) Representative metal transport curve, after transforming the raw fluorescence signals into the corresponding intraliposome metal concentration, indicating amount (in µM) of metal uptake over time. The initial 1-2 minutes of measurements provide the baseline. Once metal (and valinomycin) is added, the signal increases over time proportional to the amount of metal imported inside the liposome. The slope from the linear initial part of the curve provides the bulk transport initial rate, a measure of the transport kinetics.
Plan your assay parameters and how to organize it on your 96 well plate. Below is a hypothetical example where you assay four different protein constructs (WT, Mut1, Mut2, Mut3) with two different metals (Mn2+, Cd2+) at four different ΔΨ values (-120 mV, -80 mV, -40 mV, 0 mV) using an automated pipetting method on the FlexStation 3 plate reader. You will need an “assay plate” where you put your liposomes and measure the sample fluorescence during the assay. You will also need a “compound plate” which will contain the premade array of solutions you will add to your liposome samples during the assay. Outlined in Figure 4 is a 96-well design for both the assay plate and the compound plate based on the samples listed above. Each well in the compound plate has 200 µL of the appropriate sample solution. For manual pipetting, we can follow the same design but you will assay one column of your assay plate at the time, and manually pipette the compound solutions into that column at the appropriate times, then move onto the next column.
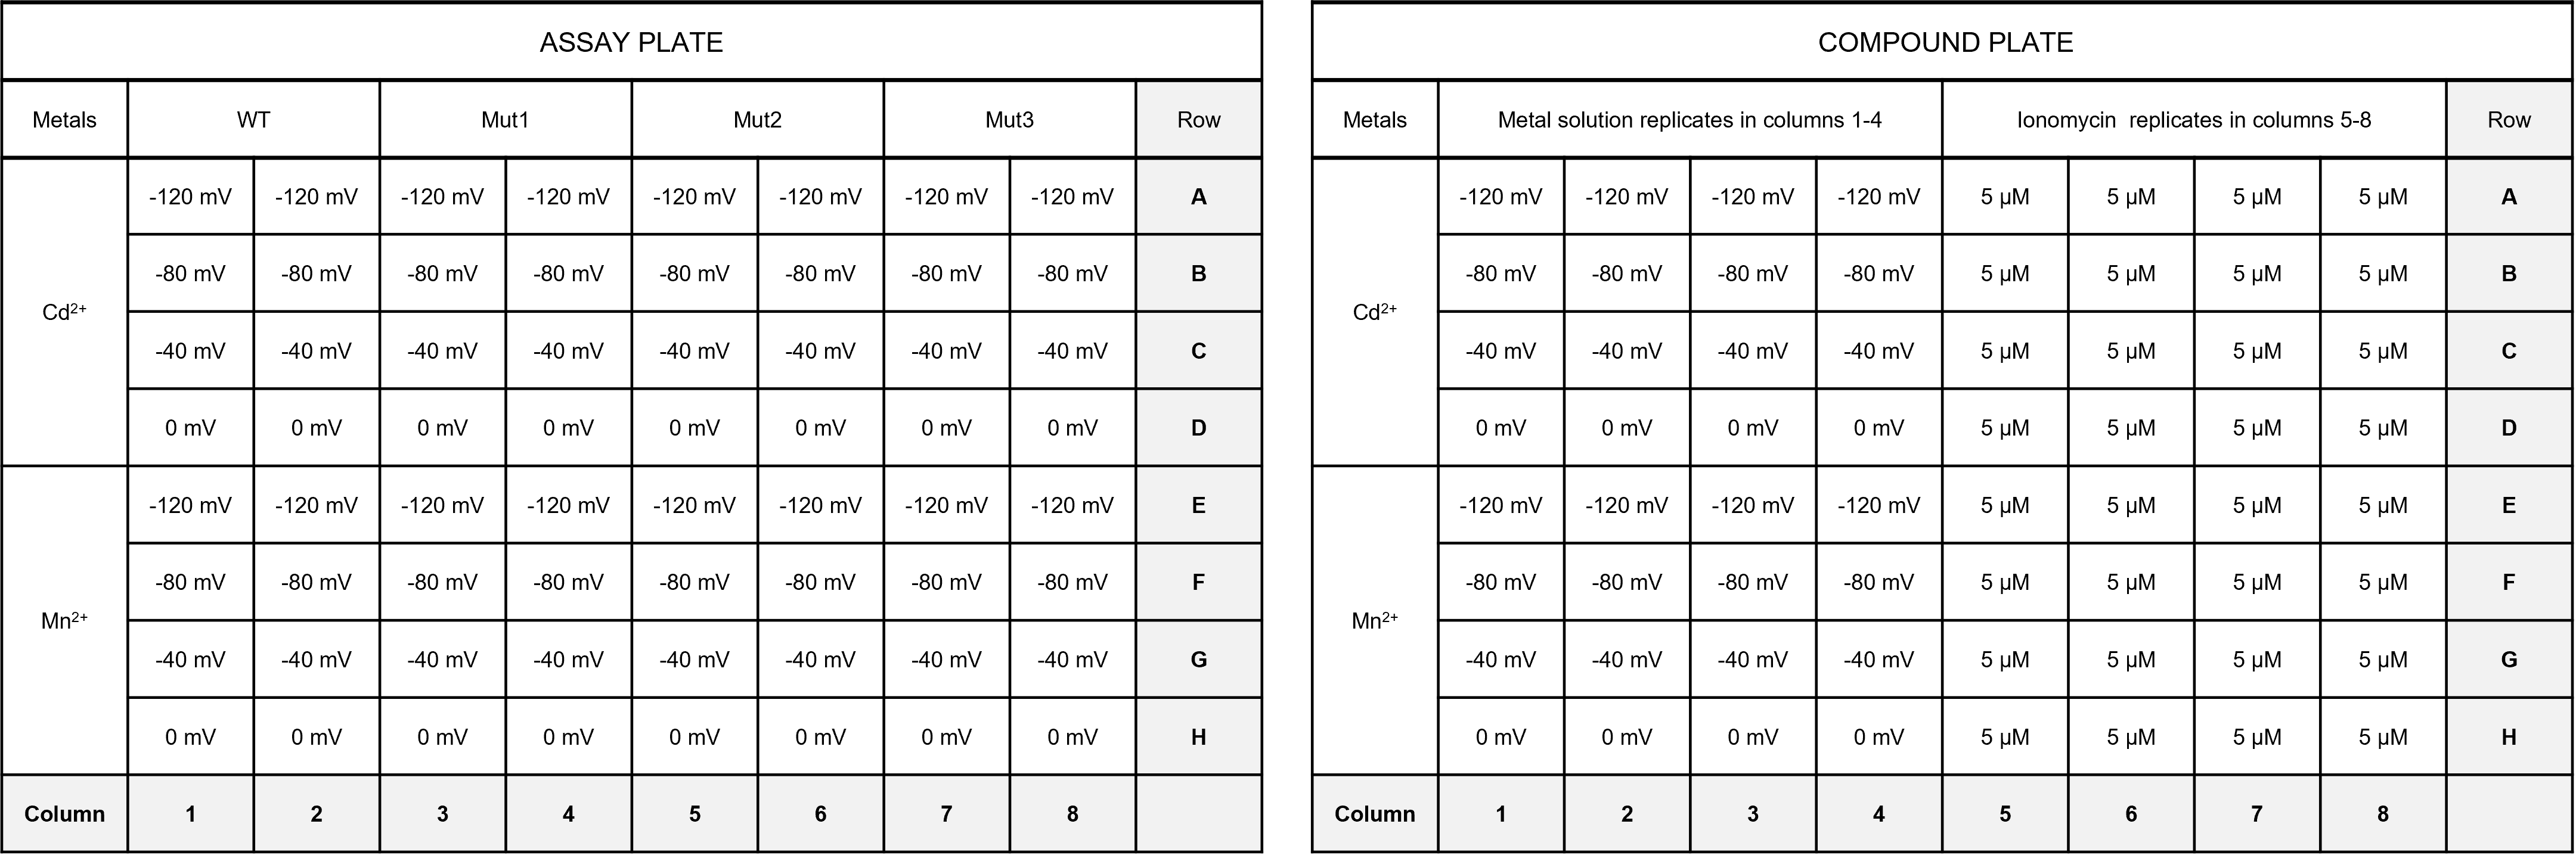
Figure 5. Representative assay and compound plate design for a proteoliposome-based transport assay in a fluorescence plate reader.
For each well, you will have the following steps over the run time of the assay (10 minutes for DraNramp samples):
You will start by adding 20 µL of liposomes of each sample in the respective well of the assay plate.
You will then add 100 µL of the appropriate KCl/NaCl buffer, and you will measure the baseline signal.
You will then add 30 µL of 5X metal solution in same KCl/NaCl buffer that also contains valinomycin, and measure how the fluorescence signal evolves over time.
You will then add 30 µL of ionomycin in water and compute the maximum signal (fluorescence/quenching) over time.
This means that over a whole plate, you would need a total of ~16 mL of buffer solutions divided into all the different types of buffers in the compound plate (although we recommend making extra for ease of pipetting and accuracy, to make sure none of the well run dry).
Mix the KCl Buffer and NaCl Buffer in appropriate ratios to create buffers at different membrane potentials as per the assay requirements (eg. 100% KCl buffer corresponds to max negative membrane potential ~200 mV). We typically prepare 40 mL of each buffer at a time (Table 1), for accurate pipetting to set precise concentrations.
Note: Because we use valinomycin as a K+ ionophore in our assays, the K+ concentration gradient across the proteoliposome membrane sets the membrane potential (ΔΨ). ΔΨ is calculated based on the Nernst equation: ΔΨ = (RT/zF) * ln ([K+]out/[K+]in), where T is temperature, z is the ion charge, R is the gas constant, F is Faraday's constant, and [K+]out and [K+]in are the [K+] concentrations outside and inside the proteoliposome, respectively.
Note: the total concentration of cations ([Na+] + [K+]) outside will be 115 mM.
Examples: In our case, we often prepare buffers at four membrane potentials from -120 mV to 0 mV and the calculations for that are detailed below in Table 1. The [K+]in is set by the concentration of K+ in the dialysis buffers, i.e., 90 mM.
Table 1. Calculations for buffers setting different membrane potentials for proteoliposome assay.
ΔΨ (mV) | [K+]out | [Na+]out | [K+]in | [Na+]in | Volume of KCl Buffer in mL (115 mM K+) | Volume of NaCl Buffer in mL (115 mM Na+) |
-120 | 0.85 | 114.2 | 90 | 30 | 0.441 | 39.559 |
-80 | 4.01 | 111.0 | 90 | 30 | 2.090 | 37.910 |
-40 | 18.99 | 96.0 | 90 | 30 | 9.907 | 30.093 |
0 | 90.00 | 25.0 | 90 | 30 | 34.957 | 5.0430 |
Prepare the required volume of each of the 5X metal solutions (3.75 mM for MnCl2 and CdCl2 to get 750 µM final desired assay concentration) in each ΔΨ buffer. You will need at least 30 µL per assay well; we typically make 3 mL of each for pipetting accuracy.
Add valinomycin to a final concentration of 500 nM to each 5X metal solution (1.5 µL of 1 mM valinomycin for 3 mL of 5X metal solution). Valinomycin is needed to establish the membrane potential.
Prepare a 5X ionomycin solution in water (5 µM stock concentration to get 1 µM final assay concentration). Make enough volume for 30 µL per assay well.
Note: Ionomycin is an ionophore that can mediate divalent metal ion exchange across lipid membranes.
Arrange your 5X metal solutions and ionomycin solutions in your compound plate (200 µL per well is sufficient for 2-3 wells in the assay plate).
When ready to do the assay, set your assay plate by diluting 20 µL of the appropriate proteoliposome sample with 100 µL of appropriate ΔΨ buffer into each well of the assay plate, and mix well by manual pipetting (note: we use an 8-channel multipipettor for this task).
If you are using the automated pipetting mode as available on the FlexStation 3, perform the following steps:
Bring the assay plate, compound plate, and the FlexStation pipette tips to the fluorescent plate reader.
Set the FlexStation to flex mode and select the following settings (Figure 5):
Select read from bottom mode for the black clear-bottomed microplates.
For Fura-2 dye-containing proteoliposomes, set λex = 340 nm and 380 nm, at λem = 510 nm with cutoff at 495 nm.
Set read time to 600 s with interval of 9 s.
Set up your automated compound addition protocol (from compound plate to assay plate): For the first addition, specify the volume of 5X metal solution to be added (30 µL in our case) at 90 s, i.e., after baseline measurement; for second addition, specify the volume of ionomycin solution to be added (30 µL in our case) at 540 s; i.e., after metal transport measurement over 450 s. (The measurements will then continue for another 60 s to capture the signal for metal-saturated Fura-2.)
Select high sensitivity mode.
Select the appropriate plate type for assay and compound plates and select wells to read based on the number of samples.
Set up the pipetting sequence based on where you put the samples on your assay plate and the metal and ionomycin solutions on your compound plate (Table 2 shows the pipetting setup for the compound and assay plate outlined in Figure 4).
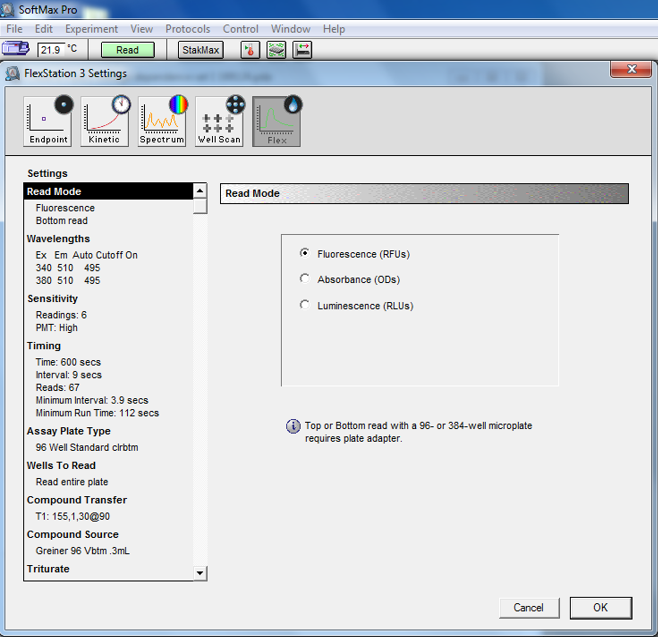
Figure 6. Screenshot from setup in SoftMax Pro for proteoliposomes transport assay using automated pipetting.
Table 2. Pipetting sequence setup on the FlexStation 3 for automated pipetting. This sequence is for the assay setup described in Figure 4 which has 8 columns of assay samples and 8 columns of compound solutions. All the numbers represent column numbering for the tips rack, compound plate, and assay plate. Transfer 1 corresponds to the addition of the metal solutions from the compound plate into samples on the assay plate. Transfer 2 corresponds to the addition of the ionomycin solutions from the compound plate into samples on the assay plate.
| Plate | Column | |||||||
Transfer 1 (metal solution addition) | Tip rack | 1 | 1 | 2 | 2 | 3 | 3 | 4 | 4 |
Compound plate | 1 | 1 | 2 | 2 | 3 | 3 | 4 | 4 | |
Assay plate | 1 | 2 | 3 | 4 | 5 | 6 | 7 | 8 | |
Transfer 2 (ionomycin addition) | Tip rack | 5 | 5 | 6 | 6 | 7 | 7 | 8 | 8 |
Compound plate | 5 | 5 | 6 | 6 | 7 | 7 | 8 | 8 | |
Assay plate | 1 | 2 | 3 | 4 | 5 | 6 | 7 | 8 | |
Put the assay and compound plate along with the pipetting tips rack in the appropriate FlexStation compartments and start the run. Automatically, metal and ionomycin will be added after the desired set time (90s and 540 s respectively in our case) and there will be a 600 s run per column of sample at a time.
Alternatively, if you are transferring assay solutions by manually pipetting while collecting data on the FlexStation 3, perform the following steps:
Bring the assay plate and compound plate to the fluorescent plate reader.
Set the kinetics mode on the FlexStation 3 and select the following settings (Figure 7):
Select read from bottom mode for the black clear-bottomed microplates.
For Fura-2 dye-containing proteoliposomes, set λex = 340 nm and 380 nm, at λem = 510 nm with cutoff at 495 nm.
Set read time of 600 s with interval of 9 s.
Select high sensitivity mode.
Select appropriate plate type for your assay plate and select wells to read (preferably 1 column at a time) based on the number of samples.
Put the assay plate in the appropriate FlexStation 3 compartment and start the run for the first column of assay sample.
Measure the baseline of the 120 µL sample (proteoliposomes + buffer) for 90 s and stop run and save the data.
Using a multipipettor, initiate the transport phase of the assay rapidly by manually adding 30 µL of 5X metal solutions from the compound plate to the first column of the assay plate, mix well, and restart the FlexStation measurement recordings.
After 450 s, stop the run and save the data again. Add 30 µL of ionomycin solutions to the first column of the assay plate, mix well, and restart the FlexStation measurement recording for a final 60 s to obtain maximum signal (fluorescence/quenching) for Fura-2, finish run and save the data.
Repeat steps c-f for each column containing samples on your assay plate.
Note: Make sure to perform the manual metal and ionomycin addition steps as quickly as possible to minimize missing data points, to avoid missing out on the initial data that is crucial for computing the initial slope (especially for systems with fast kinetics).
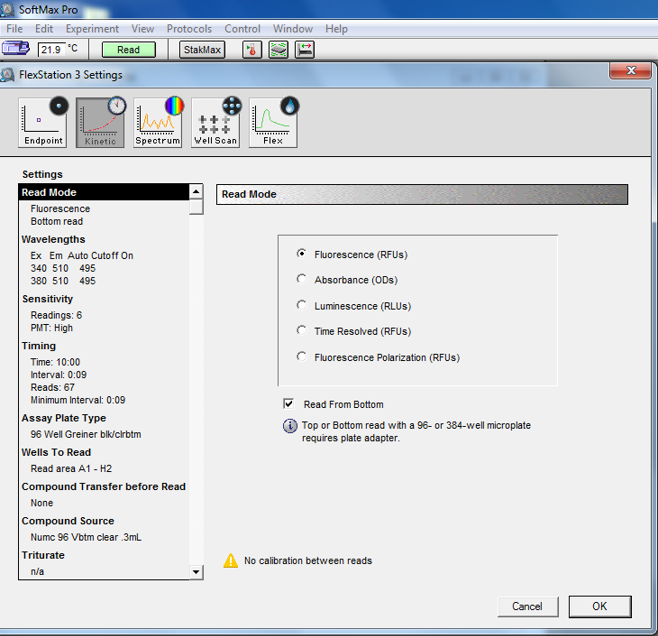
Figure 7. Screenshot from setup in SoftMax Pro for proteoliposomes transport assay using manual pipetting.
Data analysis
The FlexStation 3 data can be saved as a .csv file. Import these data into your platform of choice for analysis. We often use Microsoft Excel.
To calculate concentrations of the metals imported, there are two approaches. Some metals (e.g., Cd2+, Ca2+, Zn2+) provide a ratiometric change in the Fura-2 fluorescence expressed as the 340/380 ration. Other metals quench the fluorescence (e.g., Mn2+, Fe2+, Co2+).
For ratiometric cases, use the Fura-2 340/380 ratio and an experimentally determined KD value [3]. Briefly, the intraliposome concentration of Cd2+ (or Ca2+) is determined using: [M2+]inside = ([M2+]free[Fura-2]total)/(KD + [M2+]free) + [M2+]free, where KD is the KD of the M2+ and Fura-2 (Cd2+ = 1 pM) [1-3].
For quenching cases, first calculate the fraction of Fura-2 340 and 380 fluorescence quenched, by dividing the raw values by the maximum observed quenching after the ionomycin addition at the end of the run, then compute the average of the 340 nm and 380 nm values, to estimate imported metal [1,3].
Calculate the initial rates. The initial rate corresponds to the slope obtained from the time course plot over its linear range after the addition of metal, which is typically the first minute for our samples (Figure 3B).
For each condition tested, measure at least 2-3 biological replicates (separate preparation of dye-loaded proteoliposomes, ideally from an independent protein purification). Whenever possible, we typically measure two technical replicates (aliquoting the same proteoliposome preparation into two separate wells of a plate) per experiment.
Represent the data as scatter plots of each data point and the corresponding mean and standard deviation.
Troubleshooting
If the control empty liposomes show leaky transport signal, take the following measures to prevent leaky liposome preparations:
Reuse the same graduated cylinders and glass bottles for each round of Dialysis Buffer preparation to limit Ca2+ contamination. (By preparing the Dialysis Buffer 1, then Dialysis Buffer 2, which contains a small amount of EDTA, any contaminating metal ions will be rinsed out before you prepare Dialysis Buffer 3.)
Make sure to evaporate chloroform and pentane completely from the dried lipids before final liposome preparation
If you get lower than expected transport signal despite using the same starting protein concentrations:
When harvesting the dye-loaded proteoliposome elution fractions after buffer exchange on the PD-10 column, only pool the best high-absorbance peak fractions by making sure to leave out fractions that have too low OD600 (<0.1) and the ones with a high 340/380 fluorescence ratio of the Fura-2 (> ~2). Leave out fractions towards the end of the elution process that likely have more external KCl, which will reduce the membrane potential in comparison to the anticipated membrane potential based on the planned experimental conditions.
Make sure that the initial POPG sample is well redissolved prior to use, otherwise the concentration measured will be erroneous.
Acknowledgments
This work was funded by NIGMS grant R01GM120996. The protocol detailed here was described and validated in [1,2,4,5].
Competing interests
The authors have no competing interests to declare.
References
Bozzi, A. T., Bane, L. B., Weihofen, W. A., McCabe, A. L., Singharoy, A., Chipot, C. J., Shulten, K., Gaudet, R. (2016). Conserved methionine dictates substrate preference in Nramp-family divalent metal transporters. Proc Natl Acad Sci U S A, 113(37), 10310-10315. doi: 10.1073/pnas.1607734113.
Bozzi, A. T., Zimanyi, C. M., Nicoludis, J. M., Lee, B. K., Zhang, C. H., Gaudet, R. (2019). Structures in multiple conformations reveal distinct transition metal and proton pathways in an Nramp transporter. eLife, 8, e41124. doi: 10.7554/eLife.41124.
Hinkle, P.M., Shanshala, E.D., Nelson, E.J. (1992). Measurement of intracellular cadmium with fluorescent dyes. Further evidence for the role of calcium channels in cadmium uptake. J Biol Chem, 267, 25553–25559. doi: 10.1016/S0021-9258(19)74076-9.
Bozzi, A. T., Bane, L. B., Zimanyi, C. M., Gaudet, R. (2019) Unique structural features in an Nramp metal transporter impart substrate-specific proton cotransport and a kinetic bias to favor import. J Gen Physiol, 151(12), 1413-1429. doi: 10.1085/jgp.201912428.
Ray, S., Berry, S. P., Wilson, E.A., Zhang, C.H., Shekhar, M., Singharoy, A., Gaudet, R. (2023). High-resolution structures with bound Mn2+ and Cd2+ map the metal import pathway in an Nramp transporter. eLife, 12, e84006. doi: 10.7554/eLife.84006.
- Ray, S and Gaudet, R(2024). Proteoliposome-based in vitro transport assays. Bio-protocol Preprint. 10.21769/p2739.
- Ray, S., Berry, S. P., Wilson, E. A., Zhang, C. H., Shekhar, M., Singharoy, A. and Gaudet, R.(2023). High-resolution structures with bound Mn2+ and Cd2+ map the metal import pathway in an Nramp transporter. eLife. DOI: 10.7554/eLife.84006
Do you have any questions about this protocol?
Post your question to gather feedback from the community. We will also invite the authors of this article to respond.