
- Home
- Protocols

-

A Comprehensive Assessment of Hypoxia Tolerance in Plants: Integrating Biochemical and Physiological Analyses
Last updated date: Oct 26, 2024 Views: 88 Forks: 0
Introduction:
The ability of plants to tolerate low oxygen conditions, or hypoxia, is a critical factor in their survival under waterlogged soils, which are common in many agricultural and natural environments. Hypoxia stress can lead to reduced growth, germination, and overall plant performance. To assess the hypoxia tolerance of plant materials A and B, we will measure eight key physiological and biochemical parameters that reflect the plant's response to low oxygen conditions. These parameters include malondialdehyde (MDA) content, soluble sugar content, protein concentration, proline content, and superoxide dismutase (SOD) activity, as well as the length of the plumule sheath in germinating seeds. By evaluating these indicators, we can gain insights into the plant's antioxidant capacity, energy status, protein synthesis, osmotic adjustment, and enzymatic defense mechanisms under hypoxic conditions.
Reagent Preparation
1.Thiobarbituric Acid (TBA) Solution: Prepare a 0.67% TBA solution by dissolving 0.67 g of TBA in 100 mL of 0.05 M sodium hydroxide (NaOH).
2.Trichloroacetic Acid (TCA) Solution: Prepare a 10% TCA solution by dissolving 10 g of TCA in 100 mL of distilled water. This solution is stable for several weeks if stored at room temperature.
3.Anthrone Reagent: Dissolve 1 g of anthrone in 100 mL of concentrated sulfuric acid (H2SO4). This reagent should be prepared fresh and kept in a dark bottle.
4.Standard Glucose Solution: Prepare a 100 μg/mL stock solution of glucose. For the assay, dilute this stock solution to create a series of standard solutions with known concentrations.
5.Coomassie Brilliant Blue G-250:dissolve 0.1 g of Coomassie Brilliant Blue G-250 in 50 mL of 95% ethanol, then add 100 mL of 85% phosphoric acid, and bring the final volume to 1 L with water. Filter before use.
6.2% Ninhydrin Solution:Prepare a 2% ninhydrin solution by dissolving 2 g of ninhydrin in 100 mL of glacial acetic acid. This solution should be prepared fresh daily and stored in a dark bottle to protect it from light.
7.3% Sulfosalycilic Acid Solution:Prepare a 3% sulfosalicylic acid solution by dissolving 3 g of sulfosalicylic acid in 100 mL of distilled water. This solution is stable for several weeks if stored at room temperature.
8.Potassium Phosphate Buffer:Prepare a 50 mM potassium phosphate buffer solution by dissolving 6.82 grams of dibasic potassium phosphate (K2HPO4) and 1.42 grams of monobasic potassium phosphate (KH2PO4) in 800 mL of distilled water. Adjust the pH to 7.0 and bring the volume up to 1 L with distilled water. This solution is stable for several weeks if stored at 4°C .
9.Hydrogen Peroxide Solution:Prepare a 0.1 M solution of hydrogen peroxide (H2O2) by diluting 3.42 mL of 30% H2O2 in 1 L of distilled water. This solution is light-sensitive and should be prepared fresh daily and stored in a dark place, such as a brown glass bottle or a container wrapped in aluminum foil .
10.Ammonium Molybdate Solution:Prepare a 2.8 mM solution of ammonium molybdate (NH4)6Mo7O24·4H2O by dissolving 2.02 grams in 800 mL of 0.5 M sulfuric acid. Bring the volume up to 1 L with 0.5 M sulfuric acid. This solution is stable for several weeks if stored at room temperature in a dark bottle .
11.SOD Assay Buffer: Prepare a 100 mM sodium phosphate buffer at pH 8.0, containing 0.1 mM diethylenetriamine-pentaacetic acid (DETAPAC) and 0.1 mM hypoxanthine. First, prepare a 10 mM solution of hypoxanthine in dilute sodium hydrate (NaOH) and store at 4°C .
Malondialdehyde (MDA) Content Determination: Assessing Lipid Peroxidation under Hypoxia
1.1. Tissue Homogenization: Weigh approximately 1.0 g of coleoptile tissue and homogenize it in 5.0 mL of 10% TCA using a mortar and pestle or a tissue homogenizer. Keep the homogenization on ice to prevent overheating.
1.2 Centrifugation: Centrifuge the homogenate at 10,000 g for 20 minutes at 4°C to precipitate proteins and other debris.
1.3 Supernatant Collection: Carefully collect the supernatant and store it on ice or at -20°C until use.
1.4 Reaction Mixture Preparation: To 0.5 mL of the supernatant, add 2.0 mL of the 0.67% TBA solution. Mix well to ensure that the TCA and TBA are thoroughly combined.
1.5 Incubation: Heat the reaction mixture in a boiling water bath for 20 minutes to develop the MDA-TBA adduct.
1.6 Cooling and Centrifugation: After incubation, cool the mixture on ice for 5-10 minutes and then centrifuge at 10,000 g for 10 minutes to pellet any precipitate that may have formed.
1.7 Spectrophotometric Reading: Measure the absorbance of the supernatant at 532 nm and 600 nm using a spectrophotometer. The absorbance at 600 nm is used to correct for non-specific turbidity.
1.8 Calculation of MDA Concentration
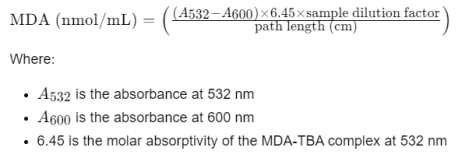
Sample dilution factor is the ratio of the final volume of the reaction mixture to the volume of the supernatant used
Soluble Sugar Extraction and Quantification: Measuring Carbohydrate Reserves for Energy Metabolism
2.1 Weigh approximately 0.5 to 1.0 g of fresh coleoptile tissue and grind it to a fine powder in liquid nitrogen. Transfer the powdered tissue to a centrifuge tube.
2.2 Extraction of Soluble Sugars: Add 10 mL of 80% ethanol to the powdered tissue and vortex thoroughly. Incubate the mixture at 80°C for 30 minutes with periodic shaking to ensure complete extraction. Centrifuge the extract at 5000 g for 10 minutes, and collect the supernatant. Repeat the extraction with 2 mL of 80% ethanol, and combine the supernatants. Add activated charcoal to the combined supernatants and incubate at 80°C for 30 minutes to remove interfering colored compounds. Centrifuge again and filter the supernatant through a 0.22 µm filter.
2.3 Color Development: To 1 mL of the filtered extract, add 5 mL of anthrone reagent and mix well. Incubate the mixture in a boiling water bath for 10 minutes to develop the color.
2.4 Cooling and Measurement: After incubation, cool the tubes rapidly in an ice bath to stop the reaction. Measure the absorbance of the blue-green colored solution at 625 nm using a spectrophotometer.
2.5 Standard Curve: Prepare a series of standard solutions with known concentrations of glucose and treat them in the same manner as the samples to create a standard curve.
2.6 Calculation of Soluble Sugar Content
The concentration of soluble sugars in the sample can be calculated using the standard curve:

Protein Concentration Assay: Evaluating the Impact of Hypoxia on Protein Synthesis
3.1 Use a standard protein such as Bovine Serum Albumin (BSA) with a known concentration.Prepare a series of dilutions (e.g., 0, 0.1, 0.2, 0.5, 1.0, 2.0 mg/mL) in distilled water.
3.2 Collect the coleoptile tissue samples from materials A and B.Grind the tissue in liquid nitrogen to a fine powder.Transfer the powder to a pre-chilled tube and add a suitable extraction buffer (e.g., 0.1 M phosphate buffer, pH 7.4, with aprotinin, leupeptin, and PMSF as protease inhibitors).
3.3 Homogenize the tissue with the extraction buffer using a polytron or sonication.Centrifuge the homogenate at 10,000 g for 15 minutes at 4°C to pellet the debris.Collect the supernatant, which contains the soluble proteins.
3.4 In a 96-well plate, add 50 µL of each standard protein solution and the samples.Add 200 µL of the Bradford reagent to each well.Mix well and incubate at room temperature for 5 minutes.
3.5 Measure the absorbance at 595 nm using a plate reader or a spectrophotometer.Plot a standard curve using the absorbance values of the standard protein solutions.Determine the protein concentration of the samples by comparing their absorbance values to the standard curve.
3.6 Calculate the protein concentration of each sample by interpolation from the standard curve.Present the results as the mean ± SD of triplicate measurements.
3.7 Calculation

Proline Extraction and Quantification: Determining Osmotic Adjustment in Response to Hypoxia
4.1 Sample Preparation:Weigh approximately 100 mg of plant tissue and place it into a 2 mL Eppendorf tube. Add 1 mL of 3% sulfosalicylic acid solution to the tube. This solution aids in the extraction of proline by disrupting the cells and precipitating proteins .
4.2 Homogenization:Homogenize the sample using a micropestle or similar device to ensure complete cell disruption. This step is critical for releasing the proline from the plant cells . Incubate the samples at 100°C for 10 minutes to facilitate proline extraction. This thermal treatment helps in the breakdown of proteins and the release of free proline .
4.3 Centrifugation:Centrifuge the samples at 10,000 g for 10 minutes to pellet the debris. This step is essential to separate the soluble proline-containing supernatant from the insoluble cell debris .
4.4 Supernatant Transfer:Carefully transfer the supernatant to a new tube, avoiding the pellet. This clear supernatant contains the proline that will be reacted with ninhydrin for colorimetric detection .
4.5 Standard Solutions:Prepare a series of standard solutions by diluting a 100 μg/mL proline stock solution to cover the range 1-100 nmoles. This provides a calibration curve to quantify the proline levels in the samples .
4.6 Reaction Mixture:In a 96-well plate or test tubes, add 1 mL of each standard solution and sample extract. Add 4 mL of the ninhydrin solution to each well or tube. Incubate the plate or tubes at 100°C for 30 minutes to develop the color. The ninhydrin reacts with proline to form a purple-colored complex .
4.7 Color Development:Cool the plate or tubes to room temperature. Add 1 mL of 6 M orthophosphoric acid to each well or tube. This acid helps to stop the reaction and develop the color further .
4.8 Absorbance Measurement:Measure the absorbance at 520 nm using a spectrophotometer or microplate reader. The absorbance is directly proportional to the proline concentration in the sample .
Data Analysis:Calculate the proline concentration using the standard curve equation derived from the absorbance values of the standard solutions. The formula for the standard curve is:
y=mx+b where y is the absorbance, x is the proline concentration, mm is the slope of the line, and b is the y-intercept
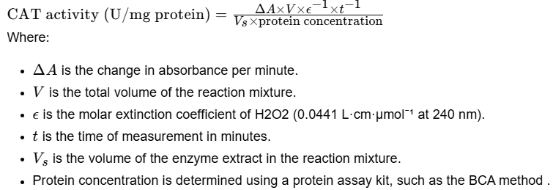
Catalase Activity Assay: Measuring Enzymatic Defense Against Oxidative Stress
5.1 Sample Preparation:Weigh approximately 100 mg of plant tissue and place it into a 1.5 mL Eppendorf tube. Add 1 mL of extraction buffer (potassium phosphate buffer) to the tube. This initial step ensures that the tissue is properly immersed in a suitable buffer for homogenization .
5.2 Homogenization and Clarification:Homogenize the sample using a micropestle or similar device to disrupt the cell membranes and release the enzymes. Centrifuge the samples at 10,000 g for 10 minutes at 4°C to pellet the debris. This step is crucial for separating the soluble enzyme fraction from the insoluble cell残渣 . Carefully transfer the supernatant to a new tube, avoiding the pellet, to obtain a clear enzyme extract for the assay.
5.3 Reaction Mixture Setup:Prepare a reaction mixture in a 96-well plate or test tubes containing 800 μL of potassium phosphate buffer, 100 μL of enzyme extract, and 100 μL of H2O2 solution. The reaction mixture is designed to provide the necessary components for the catalatic reaction to occur .
5.4 Enzyme Activity Measurement:Initiate the reaction by adding H2O2 and monitor the decrease in absorbance at 240 nm for 2 minutes using a spectrophotometer. This wavelength is selected because it corresponds to the absorption maximum of H2O2, allowing for the quantification of its decomposition over time .
5.5 Endpoint Method (Alternative):For the endpoint method, add 50 μL of substrate A (which could be a specific substrate that reacts with H2O2) and 50 μL of substrate B (which could be a coupling enzyme to develop color) to each well, incubate at 37°C for 15 minutes, then add 50 μL of stop solution and measure the absorbance at 450 nm within 15 minutes. This method provides a single measurement of enzyme activity at a fixed point in time .
5.6 Data Analysis:
Superoxide Dismutase (SOD) Activity Assay: Assessing the Antioxidant Defense System under Hypoxia
6.1 Sample Preparation:Weigh approximately 100 mg of plant tissue and place it into a 1.5 mL Eppendorf tube. Add 1 mL of extraction buffer (potassium phosphate buffer) to the tube. This step is essential for ensuring that the tissue is properly immersed in a suitable buffer for homogenization
6.2 Homogenization and Clarification:Homogenize the sample using a micropestle or similar device to disrupt the cell membranes and release the enzymes. Centrifuge the samples at 10,000 g for 10 minutes at 4°C to pellet the debris. This step is crucial for separating the soluble enzyme fraction from the insoluble celldraff
. Carefully transfer the supernatant to a new tube, avoiding the pellet, to obtain a clear enzyme extract for the assay.
6.3 Reaction Mixture Setup:Prepare the reaction mixture by adding 50 μL of the enzyme extract to each well of a 96-well plate. Add 50 μL of xanthine oxidase and hypoxanthine solution to each well. Initiate the reaction by adding 100 μL of WST-1 solution to each well. The reaction mixture is designed to provide the necessary components for the catalatic reaction to occur.
6.4 Enzyme Activity Measurement:Incubate the plate at 37°C in the dark for 15 minutes. Measure the absorbance at 450 nm using a plate reader within 15 minutes. This wavelength is selected because it corresponds to the absorption maximum of the formazan product formed by the reduction of WST-1 in the presence of superoxide radicals and SOD .
6.5 Data Analysis:
Calculate the SOD activity using the formula:

Where OD is the optical density measured at 450 nm. The activity is expressed as units per milligram of protein, with one unit defined as the amount of enzyme needed to cause a 50% inhibition of the reduction of WST-1
Plumule Sheath Length Measurement: Evaluating Germination and Growth under Hypoxic Conditions
7.1 Disinfection: Immerse the rice seed in the 1.5% sodium hypochlorite solution for 15 minutes to ensure thorough disinfection.Subsequently, rinse the samples 8 times with sterile ultrapure water to remove any residual disinfectant, which is crucial to prevent interference with the subsequent measurements.
Centrifuge Tube Preparation: Fill sterile 10 cm centrifuge tubes with sterile, autoclaved ultrapure water, and seal them to create a hypoxic environment that simulates hypoxia stress conditions.
7.2 Seed Germination under Hypoxia:Seed Selection: Select 5 seeds that are uniformly sized and show initial signs of germination (radicle protrusion).
Seed Placement: Place the seeds in each centrifuge tube filled with sterile, autoclaved ultrapure water.Place the centrifuge tubes in an incubator set at 28°C and allow the seeds to germinate in the dark for 7 days. This period and condition are chosen to allow for sufficient plumule sheath growth and extension.
7.3 Measurement of Plumule Sheath Length:After 7 days of incubation, carefully remove the seeds from the centrifuge tubes.Using a measuring device, measure the length of the plumule sheath from the base of the seed to the tip of the plumule.
Record the length of each plumule sheath to the nearest millimeter for accuracy.
7.4 Data Analysis:
Calculate the average length of the plumule sheath for each sample set (A and B). This average length can be used as an indicator of germination tolerance to hypoxia stress.
Survival Rate and Statistical Analysis: Quantifying Tolerance to Hypoxic Stress in Plant Materials
8.1 Seed Disinfection: This can be done by soaking seeds in a 1.5% sodium hypochlorite solution for 15 minutes, followed by thorough rinsing with sterile water.Water Layer Creation: Fill seed trays or containers with a 10 cm layer of sterile water to simulate the hypoxic conditions of field flooding.
8.2 Seed Placement: Place 15 seeds of each material (A and B) on a layer of paper towels or absorbent material within each container, ensuring the seeds are uniformly distributed and fully submerged under the water layer.
8.3 Incubation: Place the containers in an incubator or growth chamber maintained at 28°C. Ensure the water layer remains intact throughout the experiment.Keep the containers in the dark to simulate the natural conditions under which seeds might experience hypoxia.
8.4 Germination Monitoring: After 7 days of incubation, observe the seeds to determine which have germinated under the hypoxic conditions.Survival Count: Record the number of seeds from each material that have survived and germinated.
8.5 Replication: Perform the experiment in triplicate to ensure statistical reliability. This means setting up three separate containers for each material under the same conditions.
8.6 Survival Rate Calculation: Calculate the survival rate for each material by dividing the number of surviving seeds by the total number of seeds planted and multiplying by 100.
Statistical Analysis: Use appropriate statistical methods to analyze the survival rates among the different materials and replicates.
References:
Hagège D, Feutry S, Krsnik-Rasol M, Poder D, Menez JF. Estimation of free and bound MDA in plant extracts: comparison between spectrophotometric and HPLC methods. In: Plant lipid metabolism. Springer, Dordrecht, pp 259–261, 1995.
Bates LS, Waldren RP, Teare ID. Rapid determination of free proline for water-stress studies. Plant and Soil, 39, 205-207, 1973.
Aebi H. Catalase in vitro. Methods in Enzymology, 105, 121-126, 1984.
Beauchamp C, Fridovich I. Superoxide dismutase: Improved assays and an assay applicable to acrylamide gels. Analytical Biochemistry, 44, 276-287, 1971.
Dubois M, Gilles KA, Hamilton JP, Rebers PA, Smith F. Colorimetric method for determination of sugars and related substances. Analytical Chemistry, 28, 350-356, 1956.
Bernfeld P. Amylases, alpha and beta. Methods in Enzymology, 1, 149-158, 1955.
Bradford MM. A rapid and sensitive method for the quantitation of microgram quantities of protein utilizing the principle of protein-dye binding. Anal Biochem. 72:248-254, 1976.
Zhang J, et al. Superoxide Dismutase (SOD) and Catalase (CAT) Activity Assay Protocols for Caenorhabditis elegans. Bio Protoc. 7(16), e2505, 2017. DOI:10.21769/BioProtoc.2505.
Bio-protocol. Superoxide Dismutase (SOD) and Catalase (CAT) Activity Assay Protocols for Caenorhabditis elegans. Bio-protocol, 7(16), e2505, 2017. DOI:10.21769/BioProtoc.2505.
Assay of superoxide dismutase activity in a plate assay using WST-1. Free Radical Biology and Medicine, 2017.
Han, Y. Q. Study on the response of rice 14-3-3 protein OsGF14h via OsVP1 to hypoxia stress [D]. Shenyang Agricultural University, 2023.
Sun, Z. G., Wang, B. X., & Zhou, Z. L. Screening of rice germination tolerance to waterlogging and QTL mapping. Acta Agronomica Sinica, 47(1), 61-70, 2021.
- Wang, S, Zhang, Y, Ren, Z, Li, L, Shao, S and Wang, S(2024). A Comprehensive Assessment of Hypoxia Tolerance in Plants: Integrating Biochemical and Physiological Analyses. Bio-protocol Preprint. bio-protocol.org/prep2737.
Do you have any questions about this protocol?
Post your question to gather feedback from the community. We will also invite the authors of this article to respond.