


A Validated Interactive Google Colab Workflow for Segmentation and Quantitative Analysis of Multiplex Immunofluorescence and Chromogenic Immunohistochemistry


发布: 2026年12月05日第16卷第23期 DOI: 10.21769/BioProtoc.5890 浏览次数: 68
评审: Anonymous reviewer(s)
 PDF
 Q&A





Abstract
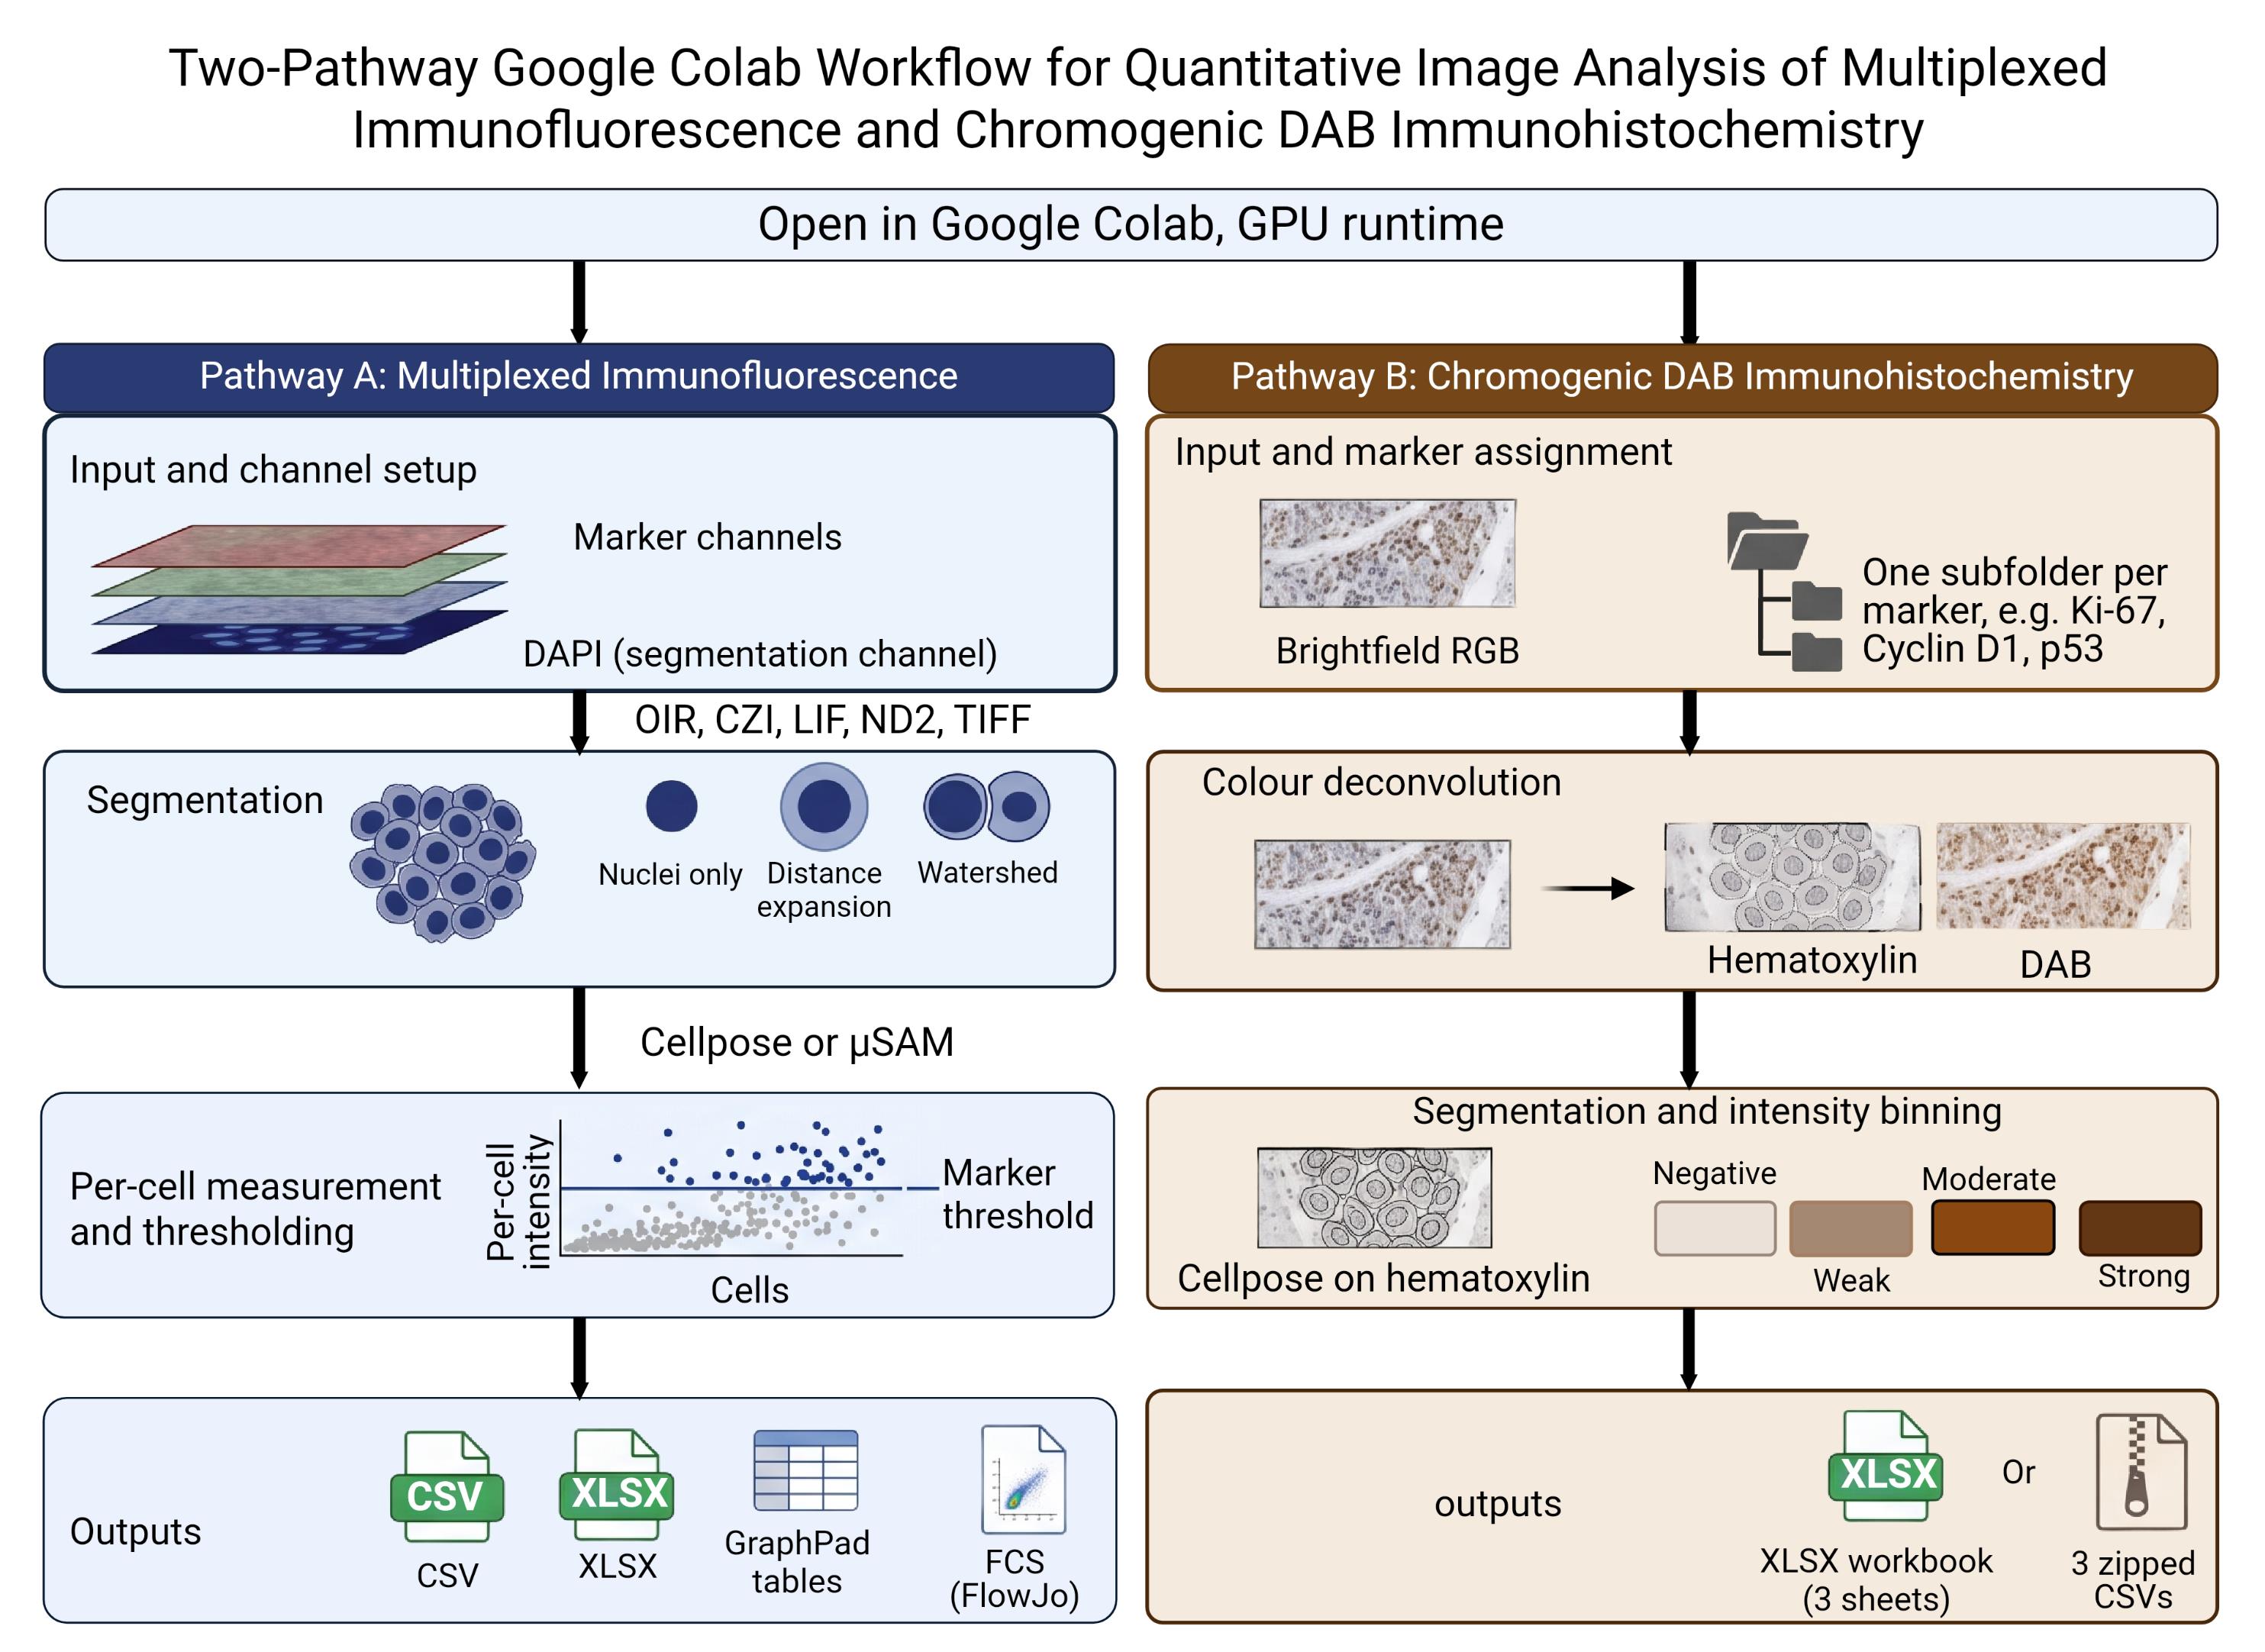
Quantitative analysis of multiplex immunofluorescence and chromogenic immunohistochemistry commonly requires specialized software, local installation, scripting experience, or substantial manual processing. Here, we describe a browser-based Google Colab workflow that enables researchers to perform cell segmentation, staining quantification, phenotypic classification, quality control, and data export through interactive controls without editing code or installing software locally.
The notebook provides separate branches for fluorescence and chromogenic analysis. The fluorescence branch supports multichannel images and z-stacks, segments nuclei using pretrained Cellpose models, constructs nuclear or expanded cell-measurement regions, and quantifies per-cell fluorescence intensity and morphology. Marker-positive, double-positive, and triple-positive populations can be classified using user-selected thresholds, and results can be exported as CSV, XLSX, or FCS 3.1 files. Technical concordance was evaluated using a publicly available 44-channel t-CyCIF tonsil image and its published single-cell measurements. DNA1 re-segmentation produced 61,173 objects, of which 17,614 were matched to published cells using predefined centroid-distance and area-ratio criteria. Continuous fluorescence agreement and independently thresholded positive-cell classifications were assessed across DNA1 and 26 biological-marker channels. The chromogenic branch was evaluated in two complementary settings. First, perinuclear measurements were compared with pathologist-assigned HER2 grades using a balanced set of 4,000 image patches. The workflow correctly reproduced the four HER2 grades in approximately seven out of ten patches, with stronger agreement for perinuclear measurements than for nuclear measurements. Second, the workflow was tested against Human Protein Atlas staining-intensity annotations across 1,709 cancer tissue cores, covering 22 antibodies and 20 cancer types. Agreement was above the level expected by chance and remained similar when thresholds were fitted on one subset of cores and evaluated on a separate subset of cores, indicating that the results were not driven solely by scoring the same samples used to set the thresholds. This workflow provides an accessible and reproducible starting point for quantitative fluorescence and chromogenic image analysis.
Key features
• Runs in a browser through Google Colab with GPU access; no local installation or code editing required.
• Fluorescence: reads OIR, CZI, LIF, ND2, TIFF, PNG, and JPEG; segments with Cellpose or micro-SAM; exports per-cell measurements as CSV, XLSX, or FCS 3.1.
• Chromogenic: H-DAB or custom color deconvolution; H-scores in nuclear, perinuclear-ring, or whole-cell compartments, or area-based scoring; thresholds anchored to negative controls.
• Evaluated against pathologist HER2 grades (4,000 patches) and Human Protein Atlas intensity annotations (1,709 cores, 22 antibodies, 20 cancers); thresholds fitted out of fold.
Keywords: Multiplex immunofluorescence Chromogenic immunohistochemistry
Image segmentation
Cellpose
Segment Anything for Microscopy
Google Colab
Color deconvolution
H-score
Stained area fraction
Negative control
HER2
Human Protein Atlas
Reproducible image analysis
Graphical overview
Background
Quantitative tissue-image analysis depends on reliable identification of individual objects and a transparent conversion of pixel values into cell-level measurements. Cellpose provides a generalist approach to cellular segmentation [1], and recent releases include pretrained Cellpose-SAM models [2]. The notebook uses the Cellpose models detected in the installed package and can also install Segment Anything for Microscopy (micro-SAM) as an alternative method for two-dimensional nuclear segmentation [3]. Because these models are pretrained, they can be applied without first assembling a training dataset or developing a new segmentation model. This browser-based approach avoids the local installation and scripting experience that conventional image-analysis software commonly requires.
Microscopy images are frequently stored in proprietary formats, with pixel data and acquisition metadata encoded differently by each manufacturer. To address this problem, the notebook uses BioIO [4] and supporting readers to open OIR, CZI, LIF, ND2, TIFF, PNG, and JPEG files and organize their pixel data in a common TCZYX representation. An AICSImageIO import fallback is retained for compatible environments. Bio-Formats is used specifically to support OIR reading and metadata access [5], while AICSImageIO is retained as a compatibility fallback when BioIO is unavailable. After import, users assign the nuclear and marker channels, select a Z-projection method, and inspect the resulting images before segmentation.
The fluorescence branch can retain the resulting labels as nuclear masks or expand them to approximate a larger cellular compartment. It then uses scikit-image [6] to process the masks and obtain per-object fluorescence intensity and morphological measurements. Marker-intensity distributions are displayed before thresholds are selected, allowing objects to be classified as positive or negative for individual markers and marker combinations.
The chromogenic branch relies on color deconvolution, which recovers each dye's contribution from an RGB image using its optical density vector [7]. For H-DAB images, the notebook performs color deconvolution using the Ruifrok and Johnston hematoxylin-eosin-DAB vectors implemented in scikit-image. Users analyzing other chromogens may instead provide custom stain vectors. Each supplied vector is normalized to unit length; if only two vectors are provided, the notebook calculates a third by taking their cross product. As quality-control measures, it reports the angle between each pair of vectors and the condition number of the resulting matrix. Vectors that are too similar produce unstable stain separation and can amplify small color differences between slides. Because stain appearance varies with laboratory procedures and scanner settings, published presets for stains such as trichrome or Alcian blue may not transfer reliably between laboratories. Custom vectors for such analysis should therefore be estimated from single-stain control slides prepared under the same conditions and imaged using the same scanner.
Two analysis modes are provided because chromogenic staining cannot always be assigned to individual cells. In cell-based mode, nuclei are segmented using the counterstain, and chromogen optical density is measured for each cell within the nuclear, perinuclear ring, or whole-cell compartment. Cells are classified as negative, weak, moderate, or strong, and the proportions in the three positive categories are used to calculate the H-score. In the area-based mode, which is intended for collagen and other extracellular or diffuse targets, cell segmentation is omitted. Instead, the proportion of tissue area within each intensity category is measured. The resulting area fractions and any weighted area-intensity score calculated from them are not H-scores because their denominator is tissue area rather than cell number.
Both modes use the same threshold-selection panel, although their thresholds are estimated separately because one uses mean optical density per cell and the other uses pixel-level optical density within tissue. When available, a matched technical negative control can be used to directly establish the negative/weak boundary. This should be a section processed alongside the samples, with the primary antibody omitted or replaced with an appropriate isotype control, while retaining the same detection system and chromogen steps. A tissue sample assumed to be biologically negative is not equivalent to this technical control. The control image is analyzed using the same stain profile, compartment, and processing settings as the corresponding samples. Its upper optical-density tail defines the amount of background permitted above the negative/weak threshold. This is the only automated threshold option that does not require the sample set itself to contain a distinct negative population; the weak/moderate and moderate/strong boundaries must still be estimated from the samples or adjusted manually.
Interactive widgets guide users through image import, channel assignment, segmentation, measurement, threshold selection, visualization, and export. The notebook supports both individual images and batch processing, retains intermediate images for inspection, and allows parameters to be adjusted before final export. It also records the selected segmentation method and measurement mask geometry. For immunofluorescence analysis, cell-level measurements can be exported in FCS format for use in compatible downstream software. This ready-to-use workflow makes advanced image analysis more accessible for routine research.
The notebook is designed primarily for Google Colab, a hosted Jupyter environment that may provide access to GPUs; however, accelerator type, memory, availability, and session duration are not guaranteed (if not familiar with Google Colab, read more here [8]). It can also be adapted for Kaggle (if not familiar with Kaggle, read more here [9]) or a local Jupyter environment, and CPU execution is still possible, though it may be slower. Ease of use does not remove the need for biological controls, standardized image acquisition, segmentation assessment, or appropriate statistical analysis. The fluorescence and chromogenic branches should therefore be evaluated independently for each imaging platform, tissue type, staining panel, and scientific question.
Materials and reagents
Laboratory supplies
No laboratory consumables are required for the computational procedure. Ensure that original images and associated metadata have been retained in read-only archival storage.
Equipment
1. Internet-connected computer with a current web browser
2. Google account with access to Google Colab and, for batch processing, sufficient Google Drive storage; we recommend GPU support (some GPU resources were free for limited use in Google Colab and in Kaggle while writing this protocol)
3. Local or network storage for original images and exported results
4. (Optional) Local CUDA-capable workstation if the notebook is adapted to a local Jupyter runtime; local execution is outside the validated scope of this protocol
Software and datasets
1. MultiplexIF_Analysis_Suite.ipynb (Github: https://github.com/arunviswanathan91/ImageAnalysis) (Zenodo: https://doi.org/10.5281/zenodo.22260636)
2. Google Colab
3. Python; the stored execution used Python 3.12.13
4. Cellpose; the stored execution reported Cellpose 4.2.1.1; model names are read from the installed package at runtime
5. PyTorch; the stored execution reported PyTorch 2.11.0+cu128
6. micro-sam/μSAM
7. BioIO, bioio-bioformats, and bffile, with Bio-Formats 8.1.1
8. NumPy, SciPy, and scikit-image; the stored execution reported NumPy 2.5.1, SciPy 1.18.0, and scikit-image 0.26.0
9. Supporting readers: aicspylibczi, readlif, nd2, tifffile, and Pillow
10. pandas, Matplotlib, seaborn, ipywidgets, openpyxl, tqdm, and psutil
11. Input data: Fluorescence or brightfield chromogenic images, including representative positive, negative, and technical control images appropriate to the experimental design.
Datasets
1. External Validation dataset 1, Fluorescence branch: TONSIL-1 t-CyCIF image [10]. Direct URL to data: https://www.synapse.org/Synapse:syn17865732/wiki/592782
2. External validation dataset 2, chromogenic branch: HER2-IHC-40x [15]. Direct URL to data: https://zenodo.org/records/15179608
3. External validation dataset 3, chromogenic branch: Human Protein Atlas cancer pathology images with per-patient IHC intensity annotation [16,18]. Direct URL to data: https://www.proteinatlas.org. Can be accessed through The Image Data Resource (IDR): https://idr.openmicroscopy.org/webclient/?show=project-501
Critical: Several packages are installed without exact version pins, although Bio-Formats is fixed at 8.1.1 in the current notebook. Preserve the notebook, installation output, version report, model name, runtime hardware, and analysis date with every result set. Before publication, archive a tested notebook (Table 1) release and an environment specification.
Table 1. Default analysis parameters as supplied in the notebook. These are starting values, not validated settings. Record the values used for every analysis. Steps are named as in this protocol.
| Step | Parameter | Default | Applies to |
| 3 | Z-projection | Maximum intensity | Fluorescence |
| 4 | Segmentation engine | Cellpose | Fluorescence |
| 4, H3 | Cellpose model | cpsam_v2 when present in the installed registry | Both branches |
| 4, H3 | Diameter (px) | 0, automatic estimation | Both branches |
| 4, H3 | Flow threshold | 0.40 | Both branches |
| 4, H3 | Cell probability threshold | 0.0 | Both branches |
| 4, H3 | Minimum mask size (px) | 15 | Both branches |
| 5A | Mask geometry | Distance-based expansion | Fluorescence |
| 5A | Expansion ratio | 0.50 | Fluorescence |
| 5A | Watershed cap ratio | 1.0 | Fluorescence |
| 6 | Threshold method | Otsu | Fluorescence |
| H1 | Stain profile | H-DAB, Ruifrok and Johnston vectors | Chromogenic |
| H1 | Negative controls | None registered | Chromogenic |
| H2 | Analysis mode | Cell based | Chromogenic |
| H2 | Measurement compartment | Nuclear | DAB Chromogenic, cell mode |
| H3 | Expansion ratio | 0.50, set separately for each expanding marker | Chromogenic, ring and whole cell |
| H3 | Tissue mask offset | 1.00, the Otsu value itself | Chromogenic, area mode |
| H3 | Smoothing sigma (px) | 3.0 | Chromogenic, area mode |
| H3 | Tiling | Off; 512 px tiles and a minimum tissue fraction of 0.10 when enabled | Chromogenic, area mode |
| H4 | Threshold scope | Per marker | Chromogenic |
| H4 | Threshold method | Otsu on log10 optical density, then fixed log offsets1 | Chromogenic |
| H4 | Upper log10 offsets | 0.398 and 0.699 above the negative cut1 | Chromogenic |
| H4 | Control tolerance | 0.01 for cell mode; 0.001 is the usual value for area mode | Chromogenic |
| H4 | Intensity bands | Three: weak, moderate and strong | Chromogenic |
| 4, 7, 10, H3 | Figure export resolution | 150 dpi | Both branches |
Note: Every threshold in step H4 is proposed automatically and remains independently adjustable before scoring. The stored value is whatever the slider reads when the thresholds are applied, and the export records whether a slider was moved after the automatic estimate.
1A reporting convention chosen during exploratory analysis, not derived from a physical, biological, or calibration-based model; see step H4 for discussion.
Procedure
登录 / 注册后阅读全文
文章信息
稿件历史记录
提交日期: Sep 8, 2026
接收日期: Oct 28, 2026
在线发布日期: Nov 19, 2026
出版日期: Dec 5, 2026
版权信息
© 2026 The Author(s); This is an open access article under the CC BY-NC license (https://creativecommons.org/licenses/by-nc/4.0/).
如何引用
Viswanathan, A. and Harikumar, K. B. (2026). A Validated Interactive Google Colab Workflow for Segmentation and Quantitative Analysis of Multiplex Immunofluorescence and Chromogenic Immunohistochemistry. Bio-protocol 16(23): e5890. DOI: 10.21769/BioProtoc.5890.

 Download Citation in RIS Format
您对这篇实验方案有问题吗?
在此处发布您的问题,我们将邀请本文作者来回答。同时,我们会将您的问题发布到Bio-protocol Exchange,以便寻求社区成员的帮助。
 发布问题


