


A Python-Based Workflow for Image-Based Single-Cell Phenotypic Profiling From Fluorescence Microscopy Images

发布: 2026年11月05日第16卷第21期 DOI: 10.21769/BioProtoc.5848 浏览次数: 250
评审: Fred D. MastAarya Vaikakkara ChithranAnonymous reviewer(s)
 PDF
PDF  Q&A
Q&A





Abstract
While advances in omics technologies have greatly improved our understanding of cellular heterogeneity, there is an increasing need for complementary approaches that capture the spatial organization and structural dynamics of cells. Image-based single-cell phenotypic profiling provides quantitative information on cell morphology and organelle organization, offering valuable insights into cellular function and regulation. Although numerous image analysis tools are available, establishing a complete analysis workflow, from image preprocessing and segmentation to feature extraction and multivariate analysis, often requires substantial computational expertise and software integration. Here, we describe a Python-based workflow for image-based single-cell phenotypic profiling from immunofluorescence microscopy images and provide a detailed protocol for its implementation. Using synchronized HeLa cells with drug-induced mitotic spindle defects as an example, the workflow covers image loading, cell segmentation, quantitative feature extraction, profile integration, dimensionality reduction, clustering, and data visualization. The protocol is accompanied by example datasets, annotated Jupyter Notebooks, and instructions for execution in either a local Python environment or Google Colab, facilitating straightforward implementation and customization. By integrating the entire analysis pipeline within a single coding environment, this workflow enables reproducible and accessible single-cell morphological profiling without requiring specialized imaging equipment or extensive programming expertise. The workflow therefore provides a practical platform for studying cell morphology, organelle organization, and cellular dynamics across a broad range of biological applications.
Key features
• Complete image analysis workflow implemented in Python within a single coding environment.
• Flexible and customizable analysis pipeline that can be readily adapted to different fluorescence imaging datasets and biological applications using mammalian cell culture monolayers.
• Automated extraction of quantitative single-cell morphological profiles from fluorescence microscopy images.
• Step-by-step tutorial with example datasets, source code, and Google Colab support to facilitate reproducible and accessible image analysis.
Keywords: High-content imaging Image-based phenotyping
Single-cell analysis
Cell morphology
Fluorescence microscopy
Multivariate analysis
Image-based phenotyping
Single-cell analysis
Cell morphology
Fluorescence microscopy
Multivariate analysis
Graphical overview
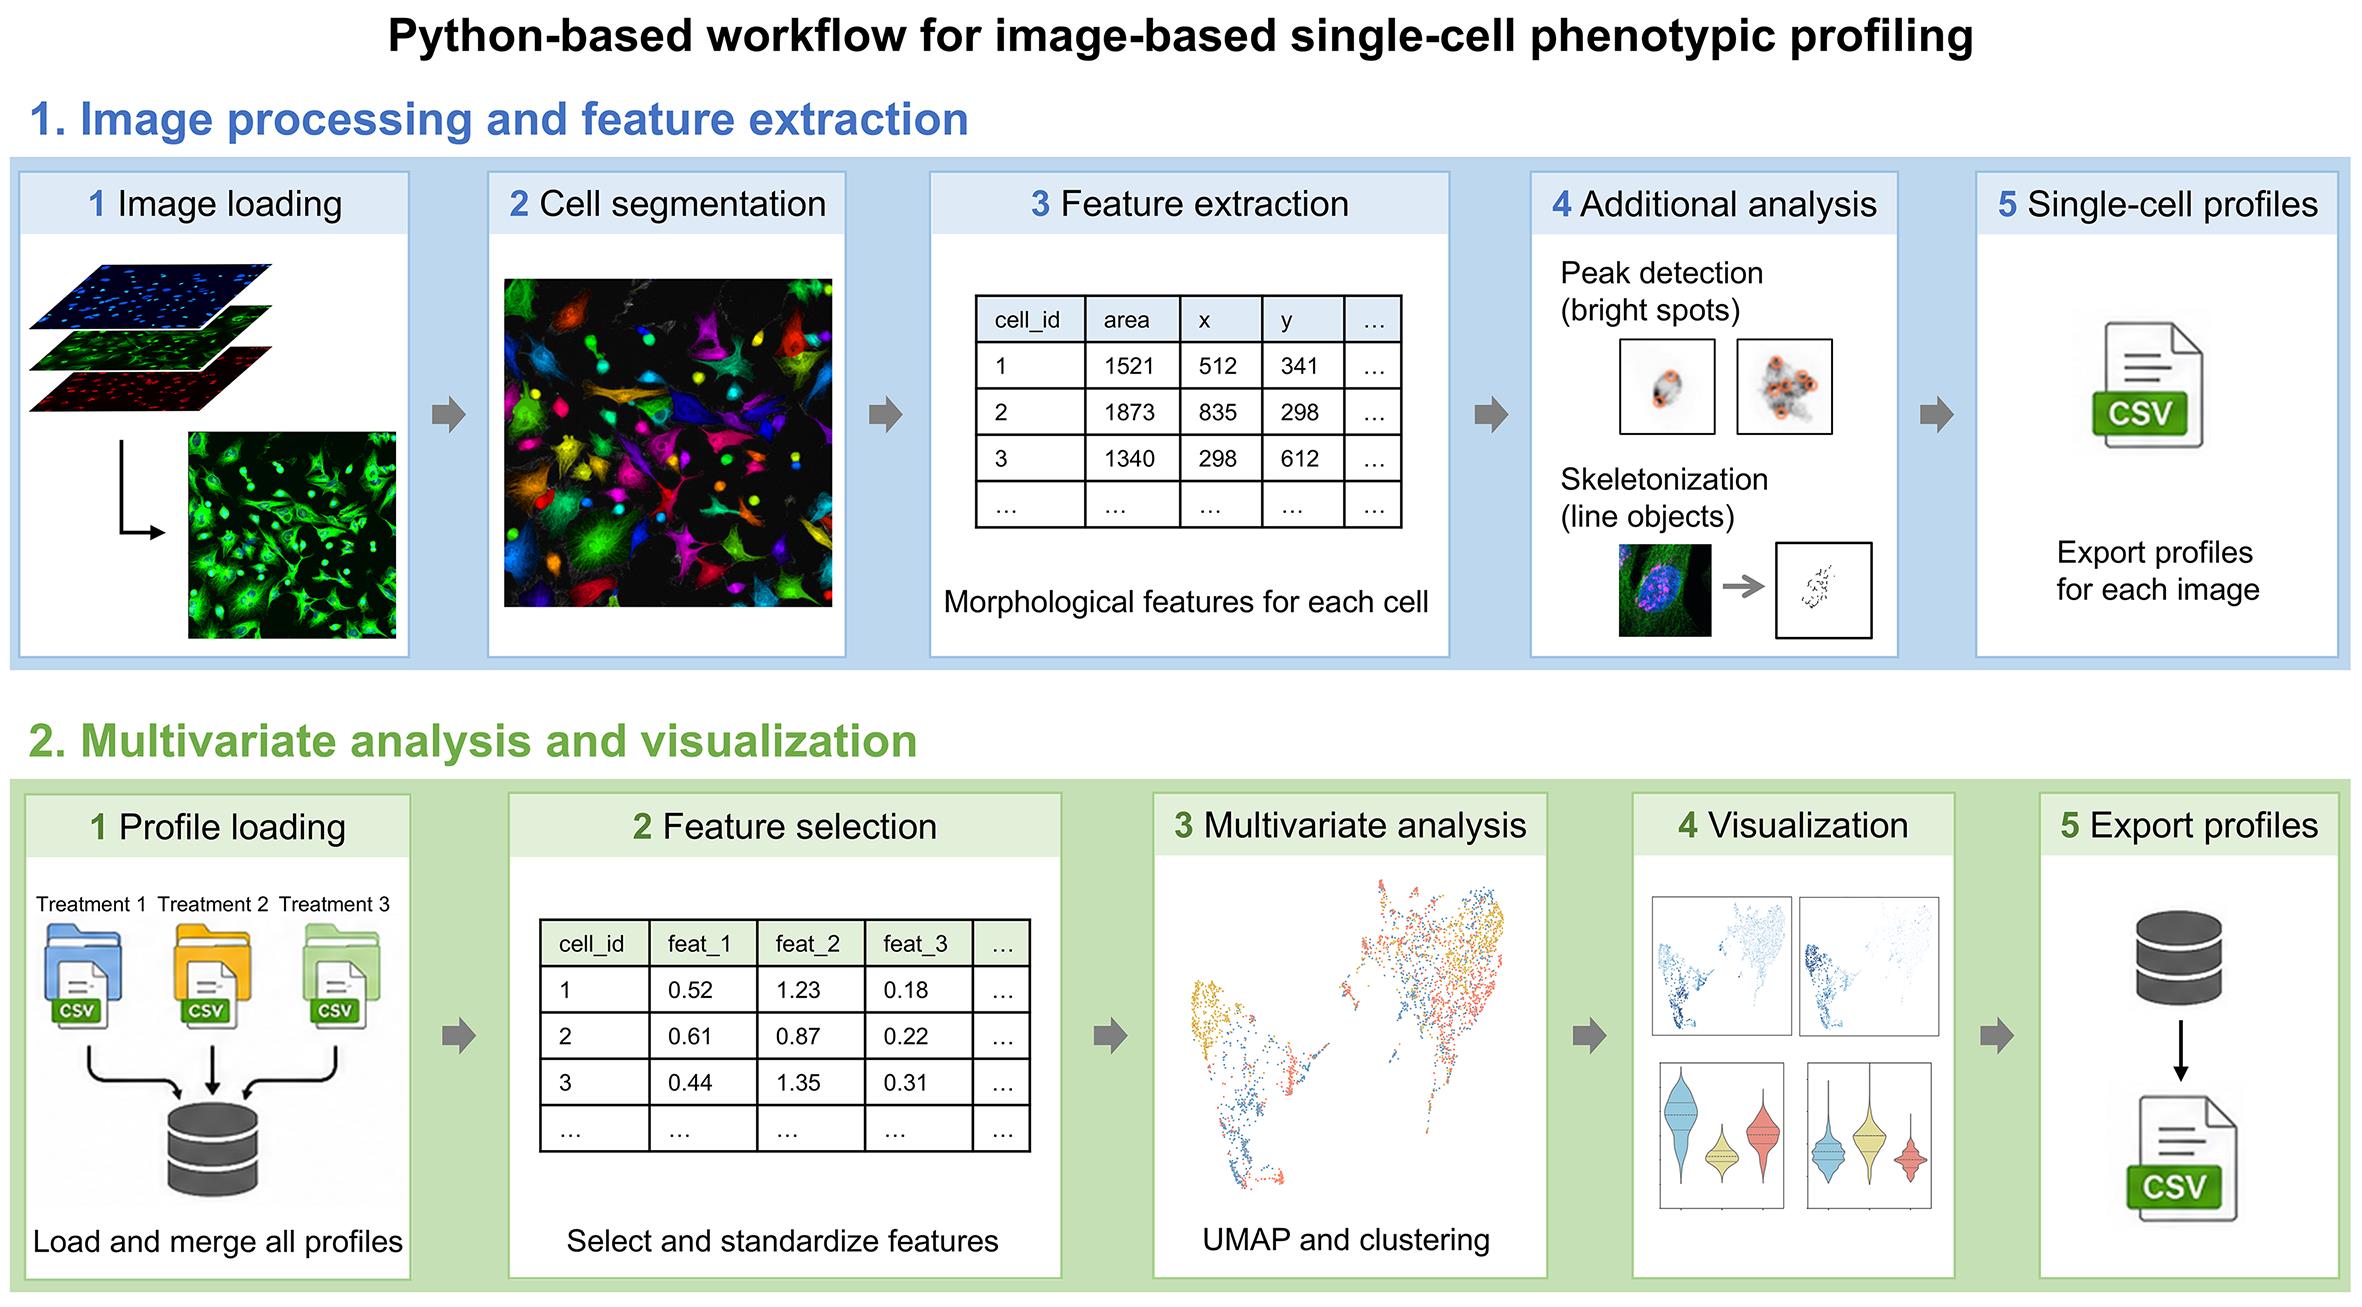
Overview of the image-based single-cell phenotypic profiling workflow. This workflow includes image loading, cell segmentation, quantitative feature extraction, multivariate analysis, and data visualization for image-based single-cell phenotypic profiling. It generates quantitative cell phenotypic profiles from immunofluorescence images and supports profile integration and export of processed datasets. The workflow is implemented as annotated Jupyter Notebooks and can be executed in either a local Python environment or Google Colab.
Background
Cells continuously adjust their morphology, intracellular organization, and organelle architecture in response to both intrinsic and extrinsic signals. These morphological characteristics provide informative readouts of cellular state, function, and regulation, complementing recent advances in omics technologies [1–3]. Accordingly, quantitative analysis of cellular and subcellular morphology has become increasingly important for investigating biological processes such as cell cycle progression, cell polarization, migration, and differentiation [4–8]. During mitosis, for example, cells undergo characteristic structural changes, including cell rounding, chromosome condensation, spindle assembly, and Golgi reorganization [9]. Although many of these changes are readily recognizable, others are subtle and heterogeneous, making them difficult to evaluate consistently by manual observation alone. Artificial intelligence (AI)-assisted image analysis, including CNN-based approaches for extracting phenotypic features from microscopy images, has demonstrated considerable potential for detecting such subtle morphological changes at the single-cell level [10]. These advances have created a growing need for robust and accessible workflows that convert microscopy images into quantitative, reproducible phenotypic data.
Recent advances in fluorescence microscopy and computational image analysis have greatly expanded the ability to extract quantitative information from cell images. However, image-based phenotyping typically requires multiple computational steps, including image preprocessing, cell segmentation, feature extraction, dimensionality reduction, clustering, and visualization, which are often performed using different software packages or custom scripts. As a result, establishing reproducible and easily adaptable analysis workflows remains a practical challenge for many laboratories.
To facilitate routine image-based phenotyping, we developed a Python-based workflow that integrates image loading, preprocessing, segmentation, feature extraction, multivariate analysis, and visualization within a single analysis pipeline [11]. Numerous image analysis platforms are available, including ImageJ/Fiji [12,13], napari [14], CellProfiler [15], Cellpose [16,17], and ilastik [18]. Rather than replacing these established tools, our workflow is designed to provide (i) a seamless pipeline from raw images to quantitative results within a single coding environment, (ii) concise and transparent code that is easy to understand and modify, and (iii) flexibility for customization to accommodate different imaging datasets and biological questions. The workflow combines Cellpose-based cell segmentation with quantitative feature extraction and multivariate analysis. Using fluorescence images of drug-treated HeLa cells as an example [11], this protocol provides a step-by-step tutorial covering the complete workflow, from image loading to downstream biological interpretation.
Software and datasets
The dataset used in this protocol, including the source code and cell images, can be downloaded from the Dryad repository (https://doi.org/10.5061/dryad.8gtht771s, 2025/11/07; updated 2026/08/19). A Python environment is required to run the analysis. Because there are many ways to set up such an environment, we describe two example workflows: (1) installing Miniconda and Visual Studio Code (VS Code), or (2) using Google Colab. For users without experience managing Python environments, we recommend the Google Colab option because it does not require local installation or manual environment configuration. Users who already have a suitable Python environment can use it instead. The Python environment can be created using the provided YAML file, while the versions of key packages used in this protocol are listed in Table 1.
Table 1. Key Python packages used in the image-based phenotypic profiling workflow.
The table lists the key Python packages used in the workflow, together with their versions and primary functions. The complete computational environment can be reproduced using the provided YAML file.
| Python=3.8.15 | ||
|---|---|---|
| Package | Version | Description |
| cellpose | 2.1.1 | Deep learning–based cell segmentation from microscopy images. |
| matplotlib | 3.5.3 | For creating plots and data visualizations. |
| numpy | 1.23.4 | For numerical computing and multidimensional array operations. |
| opencv (cv2) | 4.11.0.86 | A computer vision package for image processing and analysis. |
| pandas | 1.5.1 | For data manipulation and tabular data analysis. |
| scikit-image (skimage) | 0.20.0 | For image processing and analysis. |
| scikit-learn (sklearn) | 1.2.2 | A machine learning package for data preprocessing, clustering, and other analyses. |
| seaborn | 0.13.2 | A data visualization package based on matplotlib. |
| tifffile | 2022.10.10 | For reading and writing TIFF image files. |
| trackpy | 0.6.1 | For detecting and tracking features in images. |
| umap-learn (umap) | 0.5.6 | For dimensionality reduction and visualization using UMAP. |
Note: The code is provided as Jupyter Notebooks and can be executed in VS Code, JupyterLab, or Google Colab. For users running the analysis in VS Code or JupyterLab, the cellphenotype_full.yaml environment file provided in the Dryad repository can be used to recreate the software environment. At least 8 GB RAM is recommended, although 16 GB RAM is preferable for running the complete workflow. This protocol was tested on a Windows computer equipped with an Intel Core i5-12400 processor and 16 GB RAM, as well as on Google Colab with an NVIDIA T4 GPU. Although GPU acceleration is optional, it substantially improves segmentation speed.
Procedure
登录/注册后免费查看全文
文章信息
稿件历史记录
提交日期: Jul 20, 2026
接收日期: Sep 14, 2026
在线发布日期: Sep 24, 2026
出版日期: Nov 5, 2026
版权信息
© 2026 The Author(s); This is an open access article under the CC BY license (https://creativecommons.org/licenses/by/4.0/).
如何引用
Readers should cite both the Bio-protocol article and the original research article where this protocol was used:
- Yaulen, J. S., Cao, X., Peng, Y., Yang, M., Zhang, D., Gan, M. and Takao, D. (2026). A Python-Based Workflow for Image-Based Single-Cell Phenotypic Profiling From Fluorescence Microscopy Images. Bio-protocol 16(21): e5848. DOI: 10.21769/BioProtoc.5848.
- Cao, X., Peng, Y., Yang, M., Gan, M., Zhang, D., Zhou, S. and Takao, D. (2025). High-content phenotyping reveals Golgi dynamics and their role in cell cycle regulation. J Cell Biol. 225(1): e202503083. https://doi.org/10.1083/jcb.202503083

 Download Citation in RIS Format
您对这篇实验方案有问题吗?
在此处发布您的问题,我们将邀请本文作者来回答。同时,我们会将您的问题发布到Bio-protocol Exchange,以便寻求社区成员的帮助。
 发布问题
发布问题


