

Combining Suction-Pipette Spectral Identification With Single-Cell RT-PCR to Make Differential Analyses of Amphibian Red and Green Rods
结合吸管电极光电流记录与单细胞RT-PCR技术实现两栖动物红视杆与绿视杆的差异分析

发布: 2026年03月05日第16卷第5期 DOI: 10.21769/BioProtoc.5623 浏览次数: 86
评审: Marquis WalkerAnonymous reviewer(s)
Advertisement


Abstract
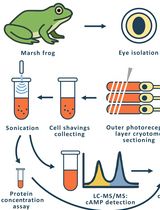
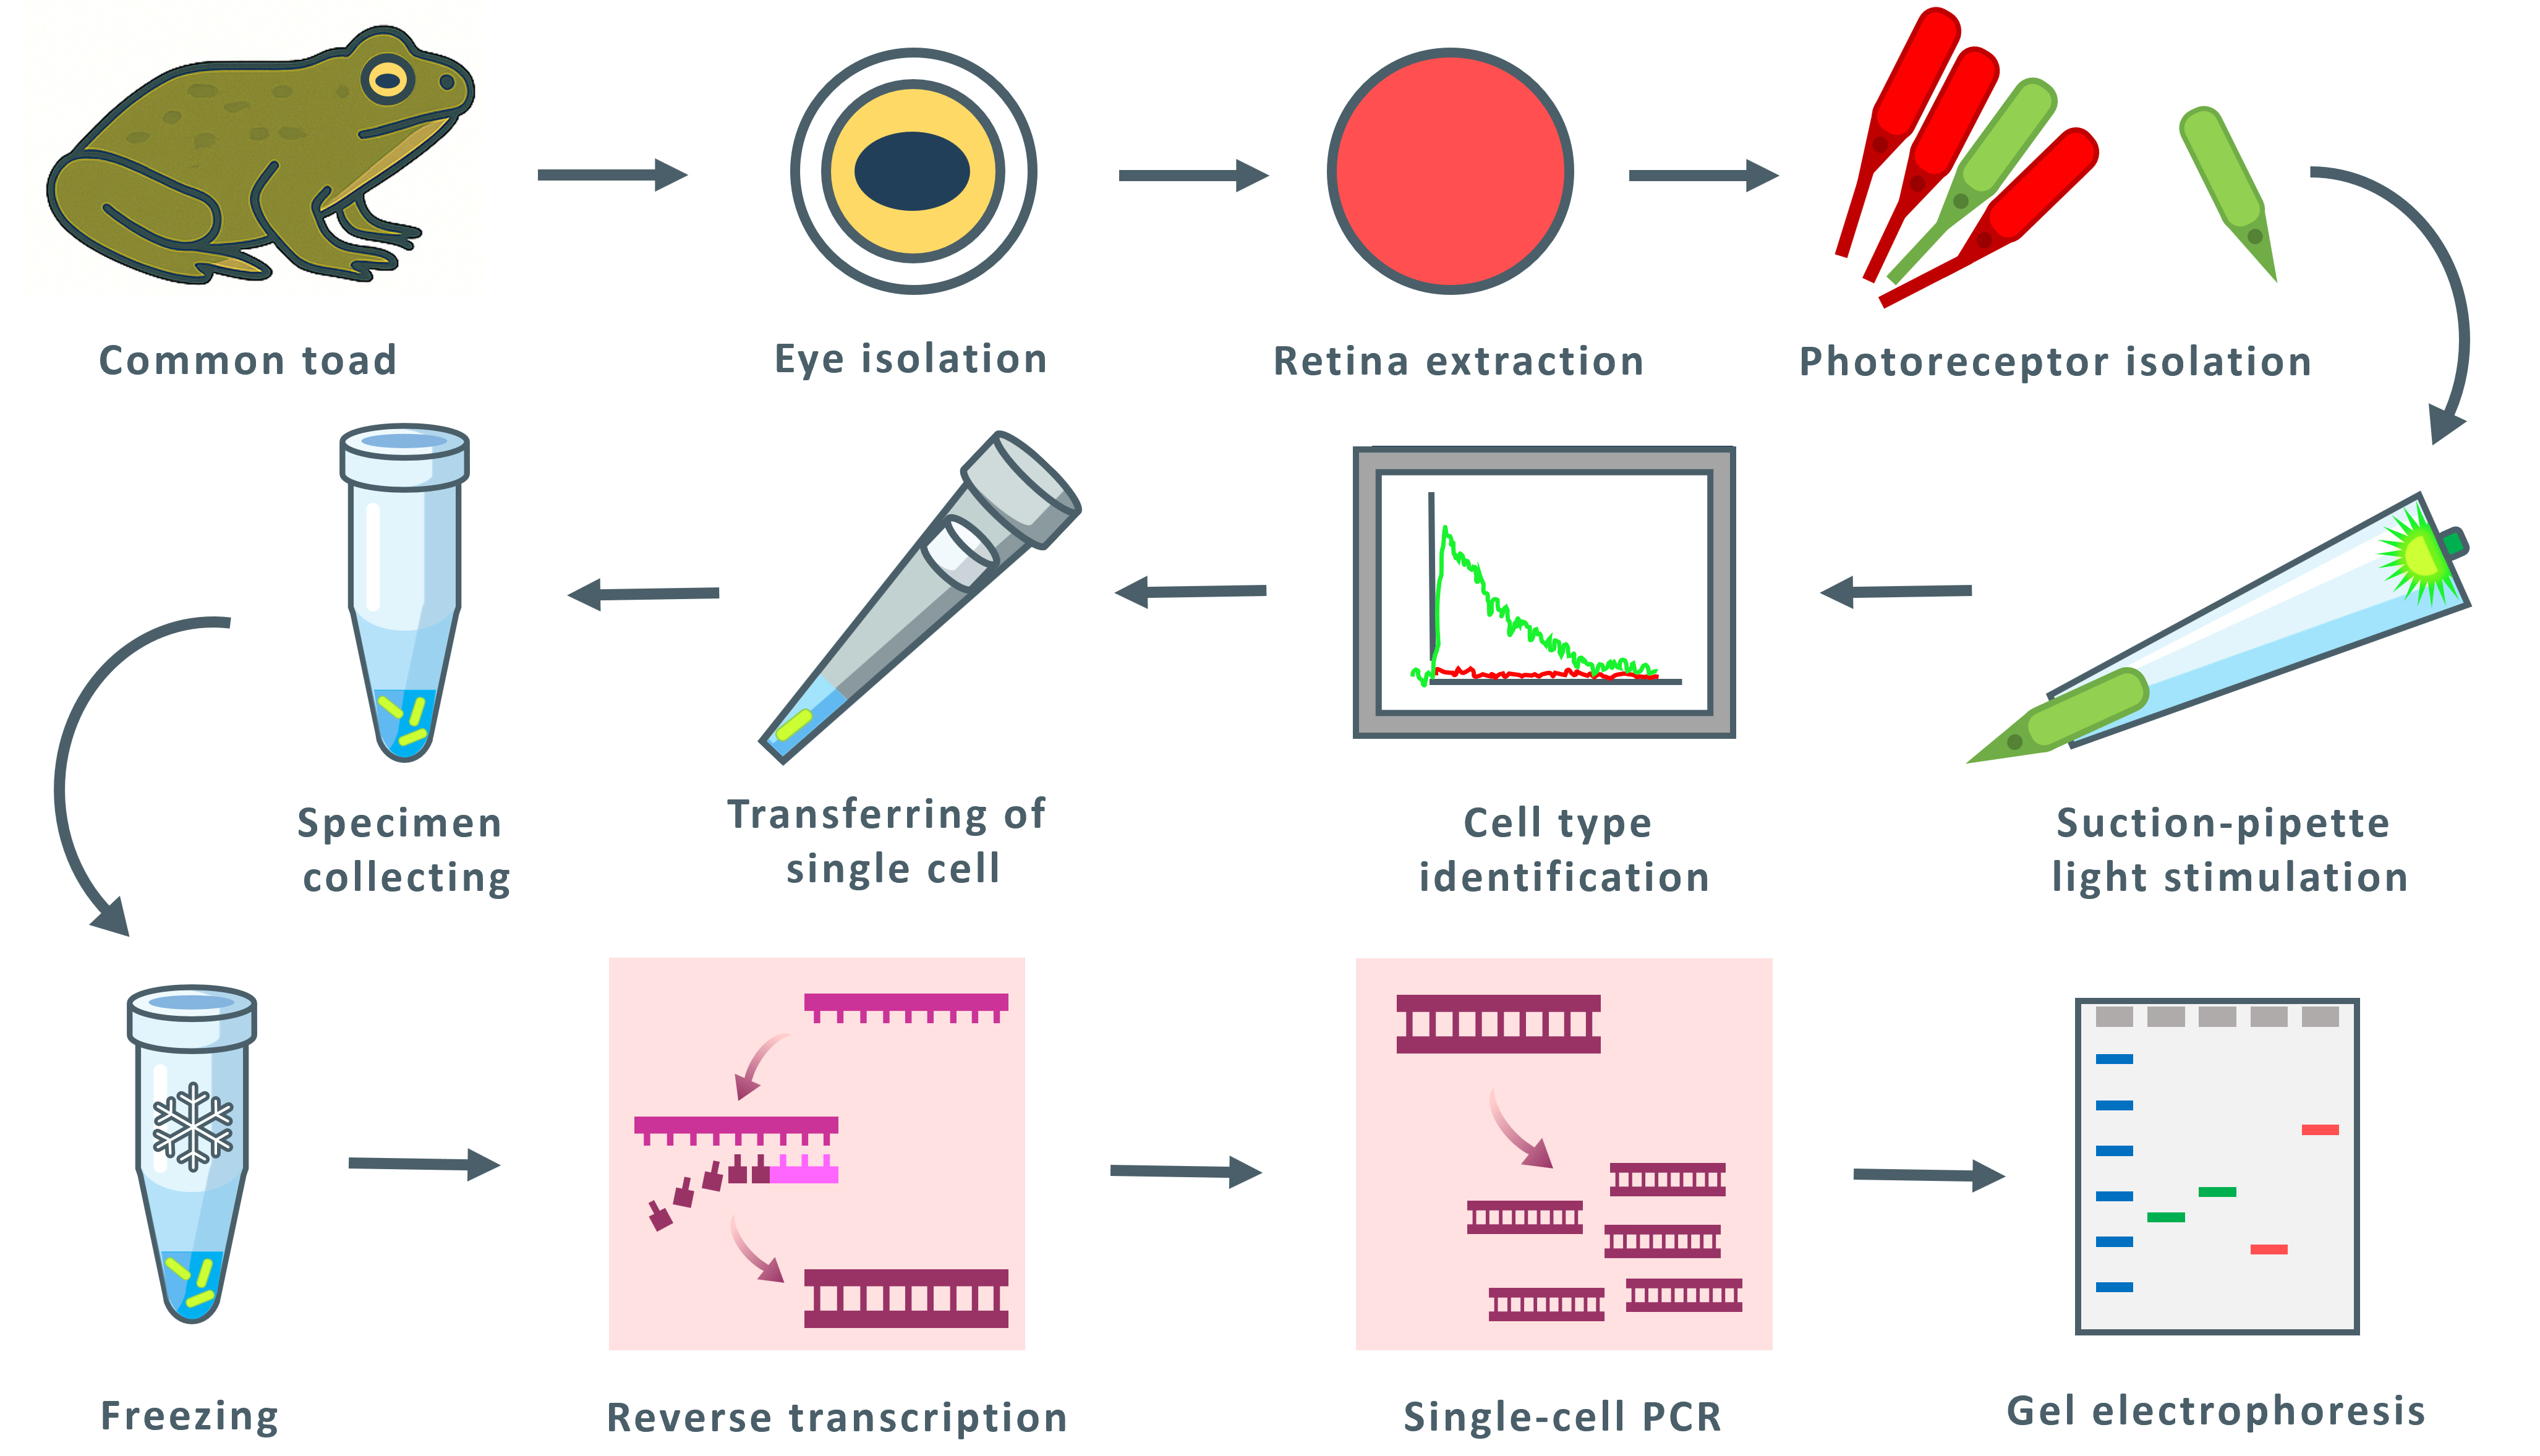
Amphibian retinas contain “green” rods, which are rod-shaped photoreceptors with a cone-type visual pigment. These rods are considered a potentially transitional photoreceptor type, but their phototransduction cascade’s molecular composition has remained uncertain. Here, we present a streamlined electrophysiology-molecular workflow that enables the rapid spectral identification, physical capture, and targeted single-cell reverse transcription-polymerase chain reaction (RT-PCR) of individual amphibian photoreceptors. After suction-pipette spectral screening under alternating red and green illumination, electrophysiologically identified cells are isolated and processed directly for reverse transcription and PCR. Coupling real-time functional phenotyping with sensitive molecular profiling provides a practical tool for resolving photoreceptor molecular heterogeneity and investigating evolutionary transitions between rod and cone phenotypes.
Key features
• New combined workflow: Rapid electrophysiological spectral typing by suction-pipette, followed by single-cell transfer, reverse transcription, and targeted PCR.
Keywords: Two-cell PCR (双细胞PCR)Graphical overview
Background
Vertebrate photoreceptors in the retina that drive image-forming vision are divided into two principal types: rods and cones. This fundamental dichotomy, with ancient evolutionary origins, underlies vision across an expansive range of ambient light intensities, spanning approximately ten orders of magnitude [1]. Rods, specialized for scotopic vision, demonstrate maximal light sensitivity; however, they are characterized by relatively low temporal resolution, which limits their ability to discern rapidly changing visual stimuli. Conversely, cones adapted for photopic vision exhibit lower sensitivity but possess a remarkable capacity for adaptation to varying light levels and offer faster kinetic responses. It is noteworthy that no individual photoreceptor type exhibits the remarkable sensitivity of rods and the high velocity and adaptability of cones. However, intermediate forms have been observed, suggesting the possibility of evolutionary transitions between these two specialized cell types.
A compelling example of such an intermediate photoreceptor is the “green” rod, a distinctive and functionally well-characterized cell found in amphibians. Morphologically, the green rod is virtually indistinguishable from the classic amphibian “red” rod, exhibiting a typical rod-like structure, while its visual pigment most closely aligns with cone-type opsins [2–4]. As demonstrated in our previous works, there are significant differences in the phototransduction cascade parameters between green and red rods [5]. Specifically, green rods exhibit a heightened light sensitivity compared to red rods, primarily attributable to a slower turn-off of the phototransduction cascade. This unique combination of features positions the green rod as a transitional photoreceptor, uniting rod morphology, a cone visual pigment, and rod-like photoresponse kinetics, offering valuable insights into the evolutionary diversification of vertebrate vision. It is reasonable to hypothesize that the phototransduction cascade in amphibian green rods consists of a mixture of cone- and rod-specific protein isoforms. The present study aims to determine whether the principal cascade proteins belong to the rod or cone type photoreceptors.
To address this question, a unique experimental approach was developed that permits the selection of sufficient numbers of exclusively green or exclusively red rods. We established a rapid electrophysiological screening protocol that allows unambiguous identification of rod subtypes.
Previous studies have not reported single-cell PCR from individually isolated photoreceptors. We have developed and validated a protocol for electrophysiological identification, isolation, and single-cell PCR of these cells. At an intermediate stage, we revealed the expression of the rod isoform of rhodopsin kinase (GRK1), the rod isoform of the transducin α-subunit (GNAT1), and the rod isoform of GCAP (GUCA1). Furthermore, exclusive expression of the rod isoform of phosphodiesterase (PDE6A) was observed, with no detectable expression of the cone isoform. Although the rod isoforms of the transducin α-subunit and GCAP predominate, trace amounts of the corresponding cone isoforms (GNAT2 and GUCA2) were also detected. It remains unclear whether these signals represent minor fractions of endogenous mRNA within the photoreceptors or contamination from extracellular RNA.
Materials and reagents
Biological materials
1. Adult common toads (Bufo bufo, n = 12) were collected from the wild in northern Russia. Animals were housed in terraria (60 × 40 × 40 cm) at room temperature. Soil was used as substrate to provide natural conditions for locomotion and resting, and access to a water container was provided. Illumination was provided by a visible and an ultraviolet (UV) lamp under 8/16 h light/dark period. The diet consisted of American cockroaches (Periplaneta americana) and mealworm larvae (Tenebrio molitor), offered twice weekly. To prevent calcium deficiency, the diet was additionally supplemented with a specialized mineral supplement. The handling of animals was conducted in accordance with the Council Directive of the European Communities (24 November 1986; 86/609/EEC), and the experimental protocol was approved by the local Institutional Animal Care and Use Committee (protocol #1–7/24 from 31/01/2024).
Reagents
1. Liquid nitrogen
2. Sodium chloride (NaCl) (Sigma-Aldrich, catalog number: S7653)
3. Potassium chloride (KCl) (Sigma-Aldrich, catalog number: P9333)
4. Magnesium chloride (MgCl2) (Sigma-Aldrich, catalog number: M1028)
5. Calcium chloride (CaCl2) (Sigma-Aldrich, catalog number: 21115)
6. Sodium bicarbonate (NaHCO3) (Sigma-Aldrich, catalog number: S5761)
7. HEPES (Sigma-Aldrich, catalog number: H3375)
8. Glucose (D-Glucose) (Sigma-Aldrich, catalog number: G8270)
9. Ethylenediaminetetraacetic acid (EDTA) (Sigma-Aldrich, catalog number: E5134)
10. Sodium hydroxide (NaOH) (Sigma-Aldrich, catalog number: 72068)
11. RNase inhibitor RiboCare (Evrogen, catalog number: EK005M)
12. Triton X-100 (Sigma-Aldrich, catalog number: T8787)
13. Ethanol (ethyl alcohol, 96%) (LenReaktiv, catalog number: 000164)
14. MMLV Reverse Transcriptase kit (Evrogen, catalog number: SK021)
15. Fusion 2.0 polymerase (Biolabmix, catalog number: Е-14005)
16. Agarose low-EEO (BioinnLabs, catalog number: bn-1G1A)
17. EtBR 10 mg/mL (Biolabmix, catalog number: EtBr-10)
18. 50× TAE buffer (Evrogen, catalog number: PB122)
19. DNA-ladder Step100 (Biolabmix, catalog number: S-8100)
20. 4× gel loading dye (Evrogen, catalog number: PB020)
21. Forward and reverse gene-specific oligonucleotide primers (Biolabmix)
Solutions
1. Frog Ringer (FR) solution (see Recipes)
2. RNA preserving cell buffer (CB) (see Recipes)
3. Agarose gel (see Recipes)
4. 1× TAE EtBr electrophoresis buffer
Recipes
1. Frog Ringer (FR) solution
| Reagent | Final concentration | Quantity or volume |
|---|---|---|
| NaCl 5 M | 90 mM | 18 mL |
| KCl 1 M | 2.5 mM | 2.5 mL |
| MgCl2 1 M | 1.4 mM | 1.4 mL |
| CaCl2 1 M | 1.05 mM | 1.05 mL |
| NaHCO3 1 M | 5 mM | 5 mL |
| HEPES 1 M | 5 mM | 5 mL |
| Glucose 1 M | 10 mM | 10 mL |
| EDTA 1 M | 0.05 mM | 0.1 mL |
| NaOH 0.5 M | to pH 7.6 | |
| Milli-Q (MQ) water | to 1,000 mL |
2. RNA-preserving cell buffer (CB)
| Reagent | Final concentration | Quantity or volume |
|---|---|---|
| RNase inhibitor, 40 U/μL | 2 U/μL | 50 μL |
| Triton X-100, 100% | 0.2% | 2 μL |
| MQ water | To 1 mL |
Store at -20 °C and use an icepack while working.
3. Agarose 2.5% gel
| Reagent | Final concentration | Quantity or volume |
|---|---|---|
| Agarose powder | 2.5% | 2.5 g |
| 50× TAE | 1× | 2 mL |
| EtBR, 10 mg/mL | 1 μg/mL | 10 μL |
| MQ water | To 100 mL |
4. 1× TAE EtBr electrophoresis buffer (EtBr 1 μg/mL)
| Reagent | Final concentration | Quantity or volume |
|---|---|---|
| 50× TAE | 1× | 20 mL |
| EtBR, 10 mg/mL | 1 μg/mL | 100 μL |
| MQ water | To 1,000 mL |
Laboratory supplies
1. Microcentrifuge tubes, 0.2 and 1.5 mL (SSIbio, catalog numbers: 1110-00 and 1210-00)
2. 3 cm Petri dishes (Jet Biofil, catalog number: TCD000035)
3. Dissecting blades (MedTech, catalog number: Sb-3)
4. Dissecting scissors (MedTech, catalog number: S-1141)
4. Dissecting dressing tweezers (MedTech, catalog number: F-6421)
4. Borosilicate glass capillaries for suction micropipettes (WPI, catalog number: TW150-4)
5. Silver chloride electrodes (WPI)
6. Icepack (Termokont MK)
7. Sterile filter pipette tips (Helicon, catalog number: AT-10-S-F-K)
8. Light-tight container (any small box or jar to prevent light exposure)
9. Mineral supplement for reptiles (Aquamenu)
Equipment
1. Suction pipette system with infrared (IR) observation (custom-made)
2. Milli-Q® water system (Merck Life Science, model: Ultrapure, Type 1)
3. Stereomicroscope (Nexcope, model: NSZ-810)
4. Pipette puller (HEKA Elektronik, Germany, model: PIP6)
5. Microforge (custom-made)
6. Centrifuge for Eppendorf tubes (Eppendorf, Germany, model: MiniSpin Plus)
7. Vortex MultiReax (Heidolph instruments GmbH, Germany, catalog number: 545-10000-00)
8. Veriti 96-well thermal cycler (Applied Biosystems, model: 9902)
9. Gel-documentation imaging system ChemiDoc MP (Bio-Rad, catalog number: 12003154)
Software and datasets
1. Light stimulation, data recording, and processing programs in LabView (National Instruments; see Supplementary Materials)
2. Gene sequence database: National Center for Biotechnology Information (NCBI)
3. Primer design software: Integrated DNA Technologies (IDT) PrimerQuest Tool
Setup of the device used to record the current of a single vertebrate retinal rod:
This device (Figures 1–3) is an intricate piece of hardware that enables:
1. High-resolution visualization of individual retinal photoreceptors in infrared light.
2. Fixation of the photoreceptors inside a suction pipette.
3. Stimulation of a selected cell using a two-channel light stimulation system with a wide range of stimulus duration (starting from 2 ms), stimulus brightness (more than seven orders of intensity), and stimulus color (four LEDs).
4. Recording of photoreceptor responses to light stimulation with low instrumental noise.
5. Primary signal processing of the photoreceptor responses is carried out in real time by a dedicated control software based on LabView.
6. Additional processing and analysis of the photoreceptor responses using a special analytical package based on LabView.
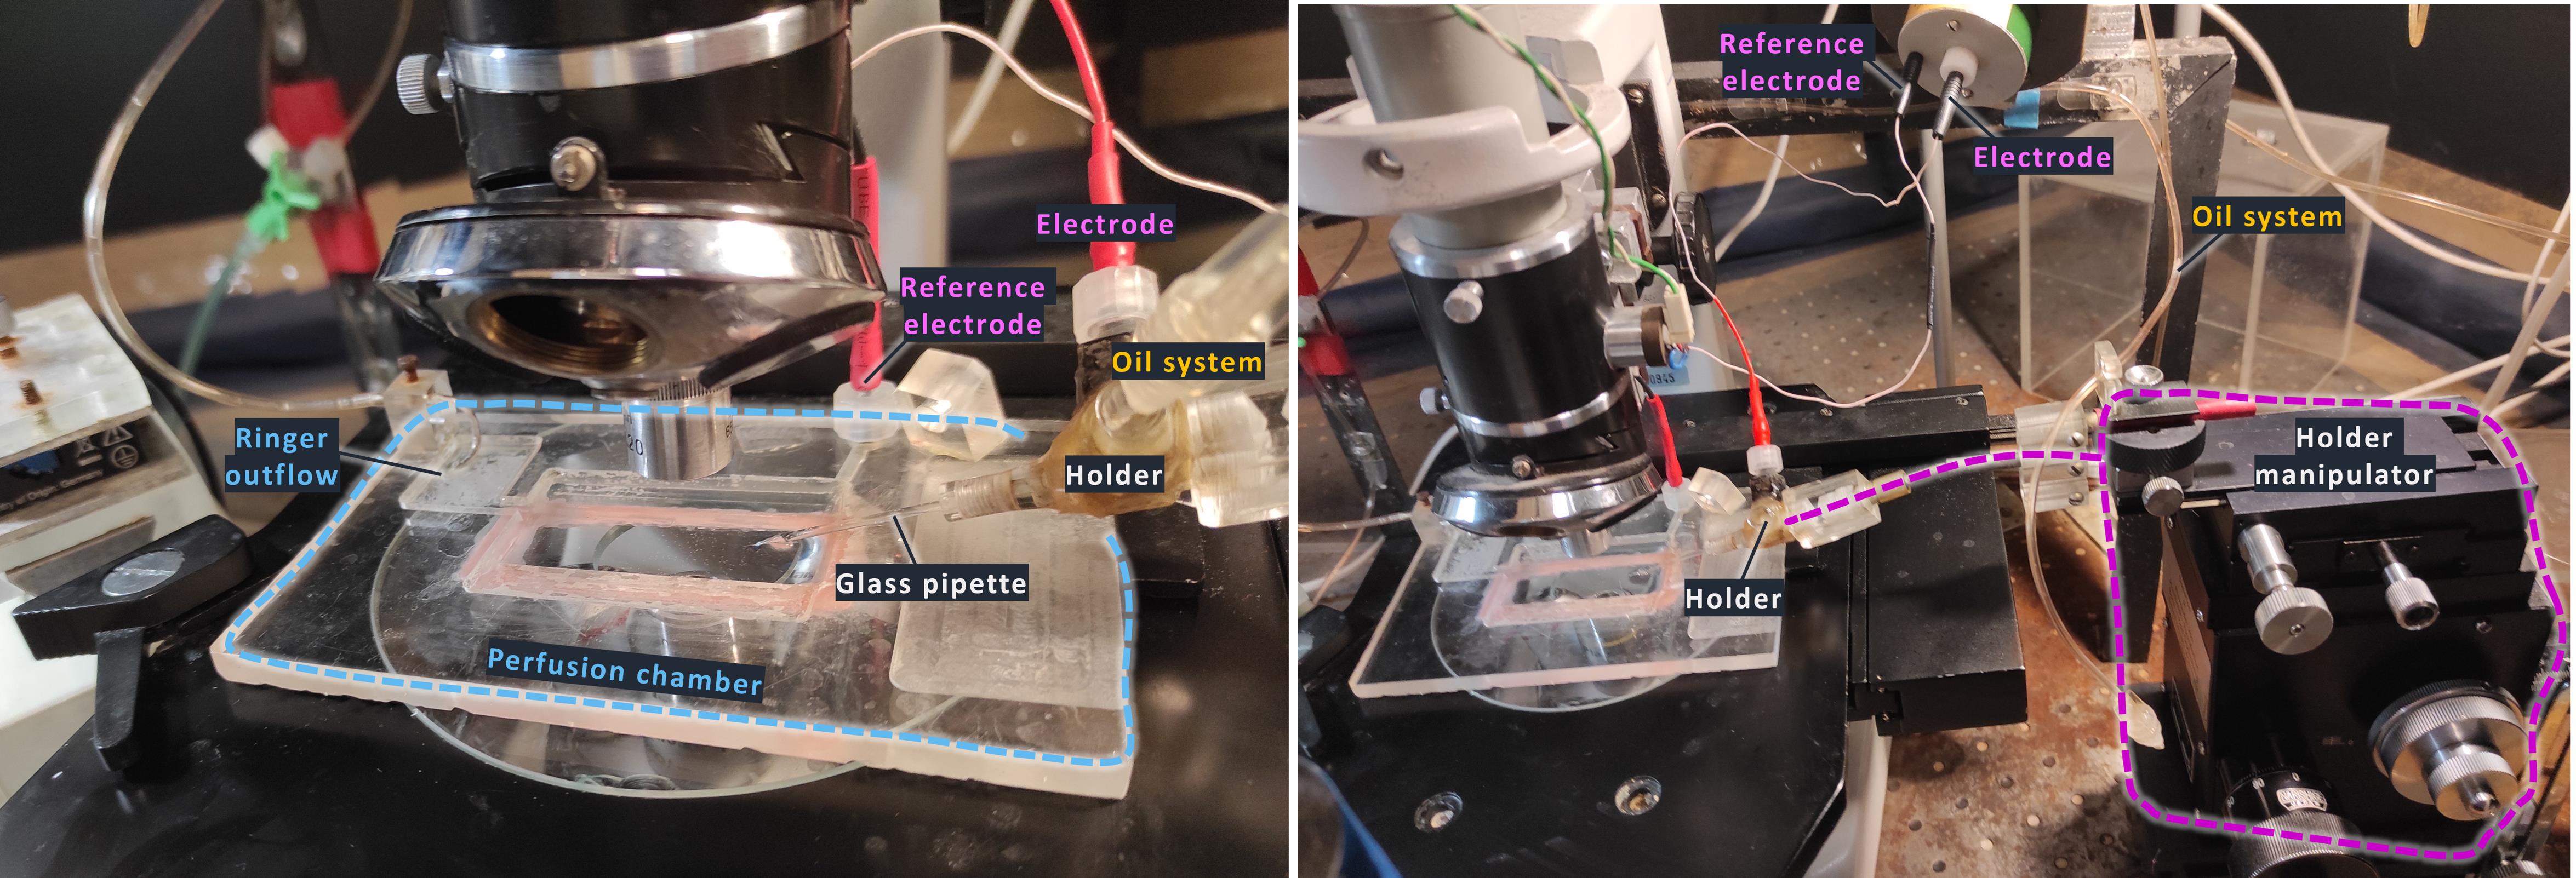
Figure 1. Photograph of the experimental setup. The suction micropipette is mounted in the holder and connected to the electrode and oil-based pressure control system.
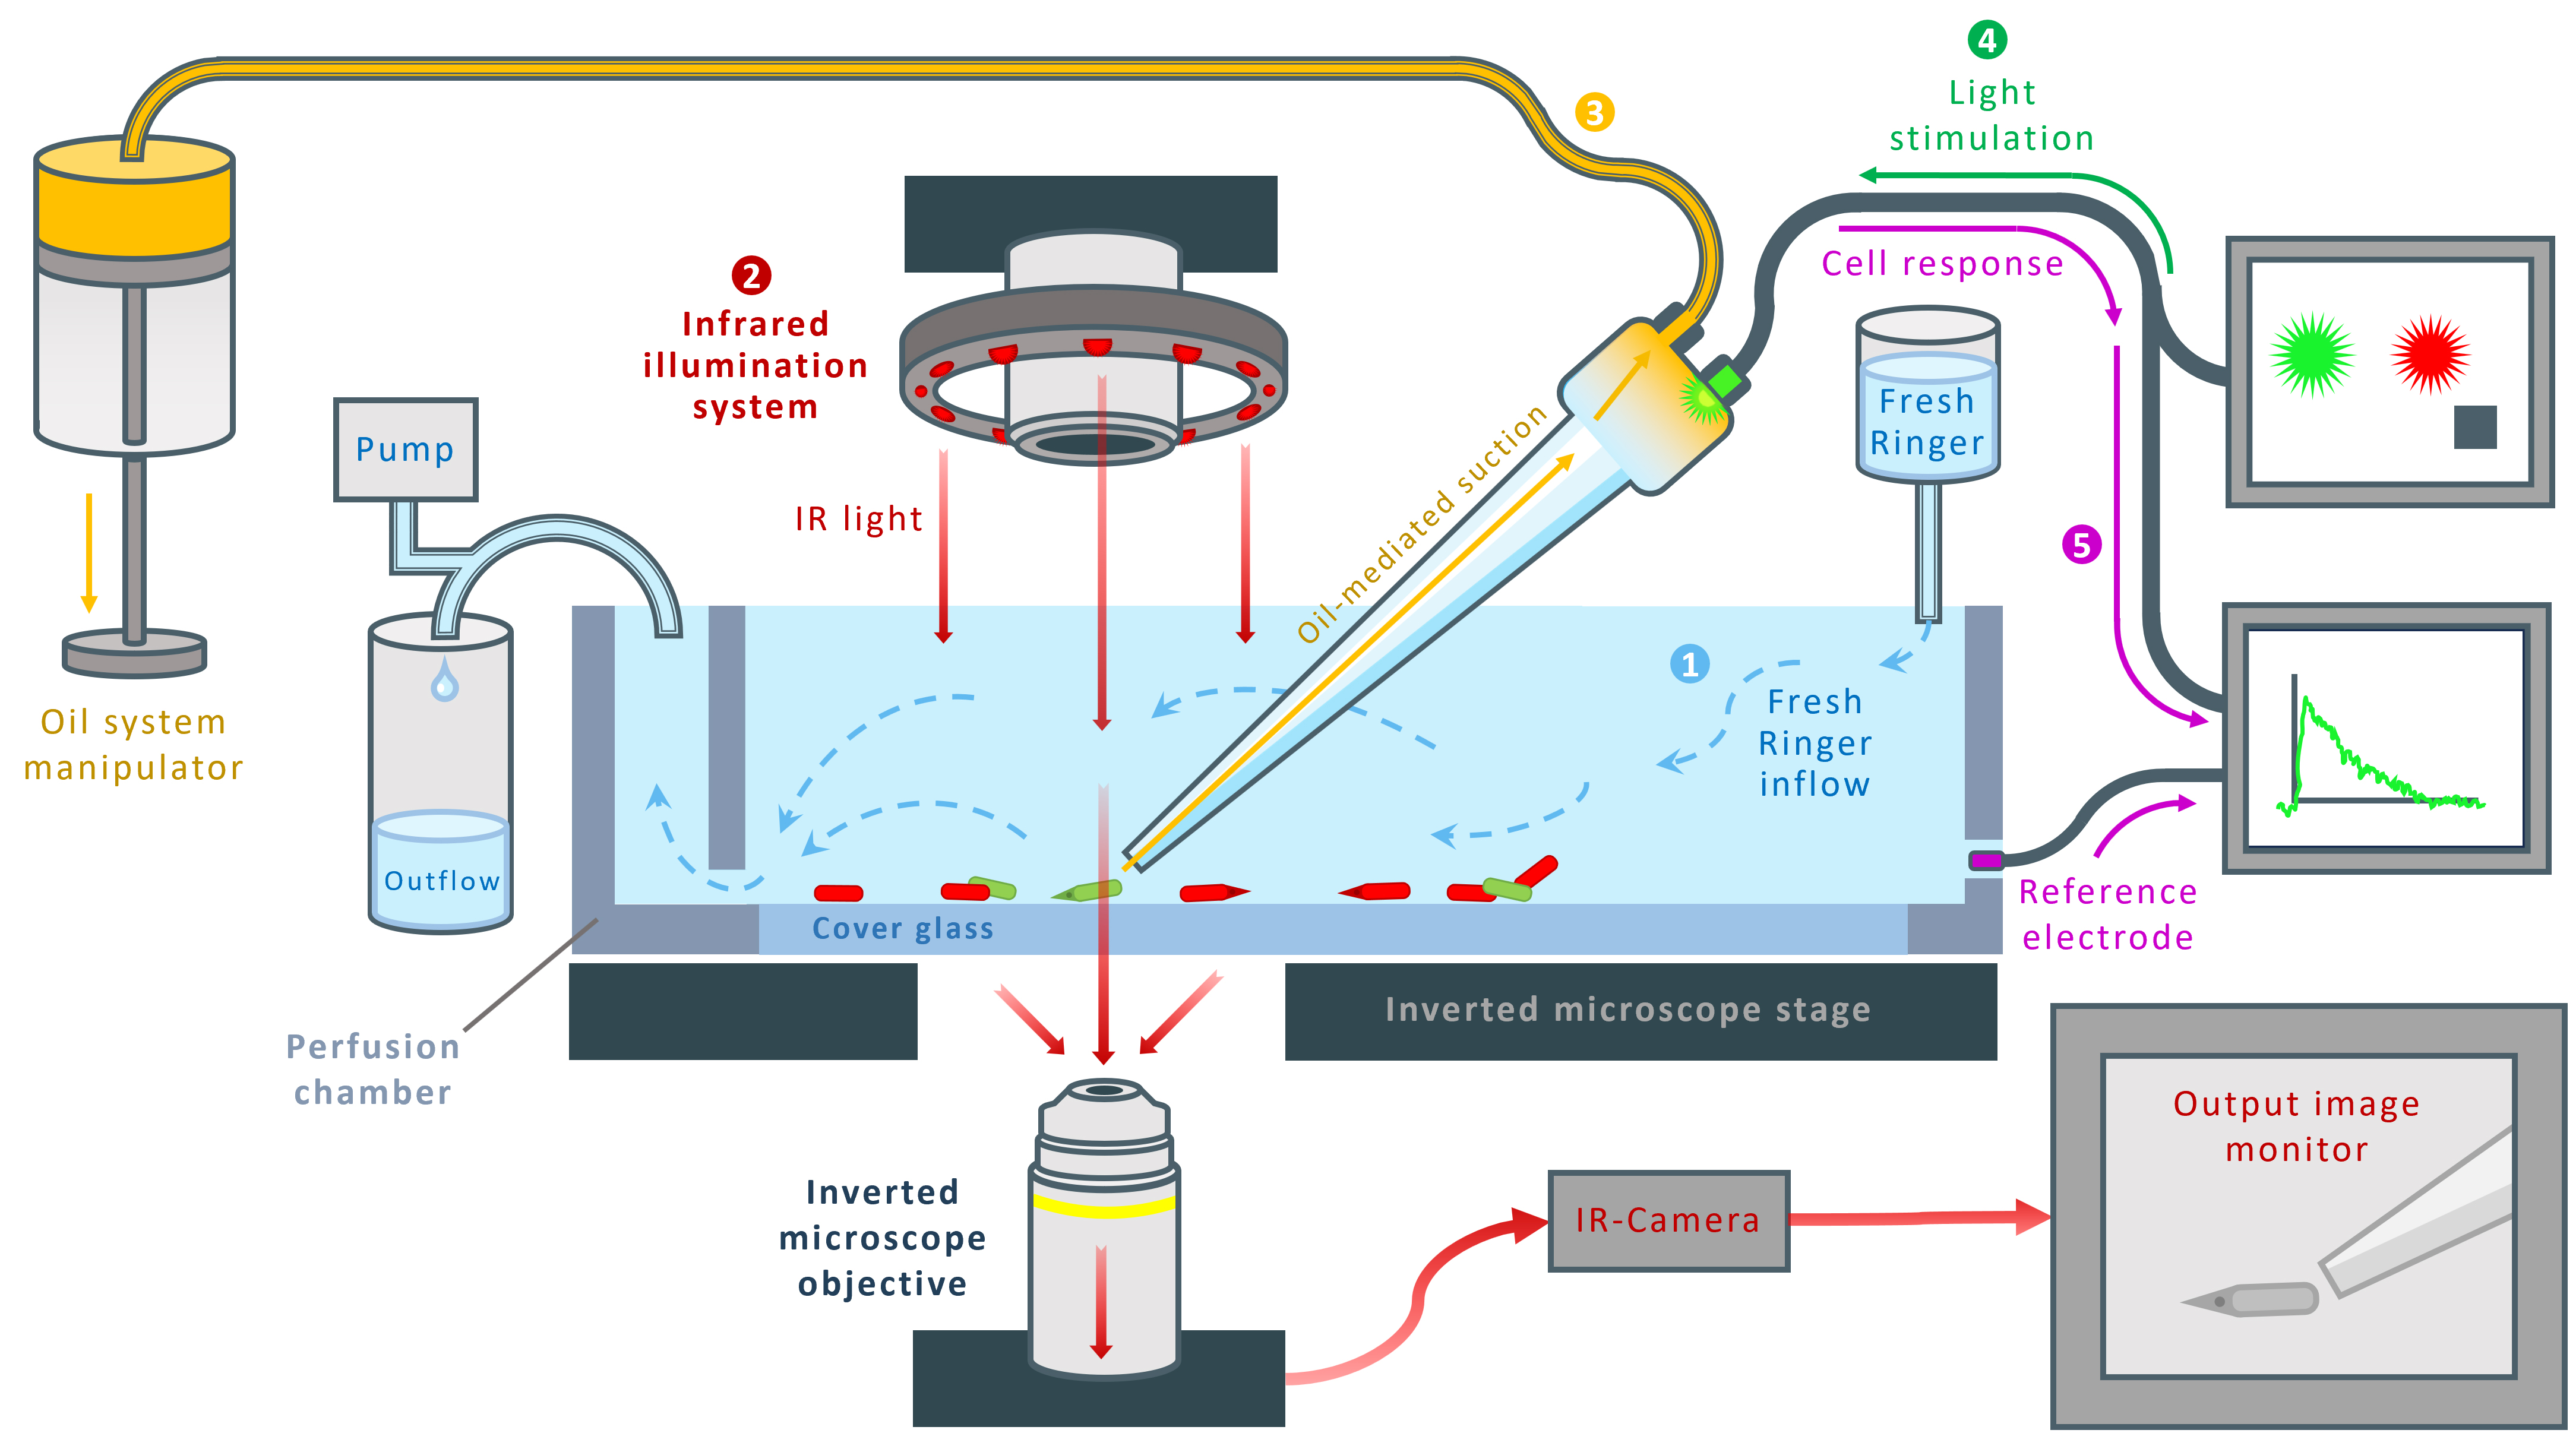
Figure 2. Schematic representation of the custom-made suction-pipette system. 1: Perfusion chamber. The glass micropipette is immersed in a perfusion chamber with a transparent cover glass bottom. The chamber is continuously supplied with fresh Ringer’s solution (blue arrows) and connected to a waste pump for constant outflow. 2: Infrared (IR) illumination system. IR light (red arrows) is directed onto the preparation from above, passes through the chamber bottom, and is collected by the objective of an inverted microscope. An IR-sensitive camera attached to the microscope transmits the live image to the output monitor. 3: Oil-based suction control. Negative pressure applied to the glass pipette is regulated through an oil-filled system operated via micromanipulators (yellow arrows). 4: Light stimulation. The photoreceptor is stimulated with controlled light flashes delivered through a software-regulated stimulation pathway (green arrows). 5: Signal recording. The photocurrent response to the light stimulus is measured through the suction pipette system.
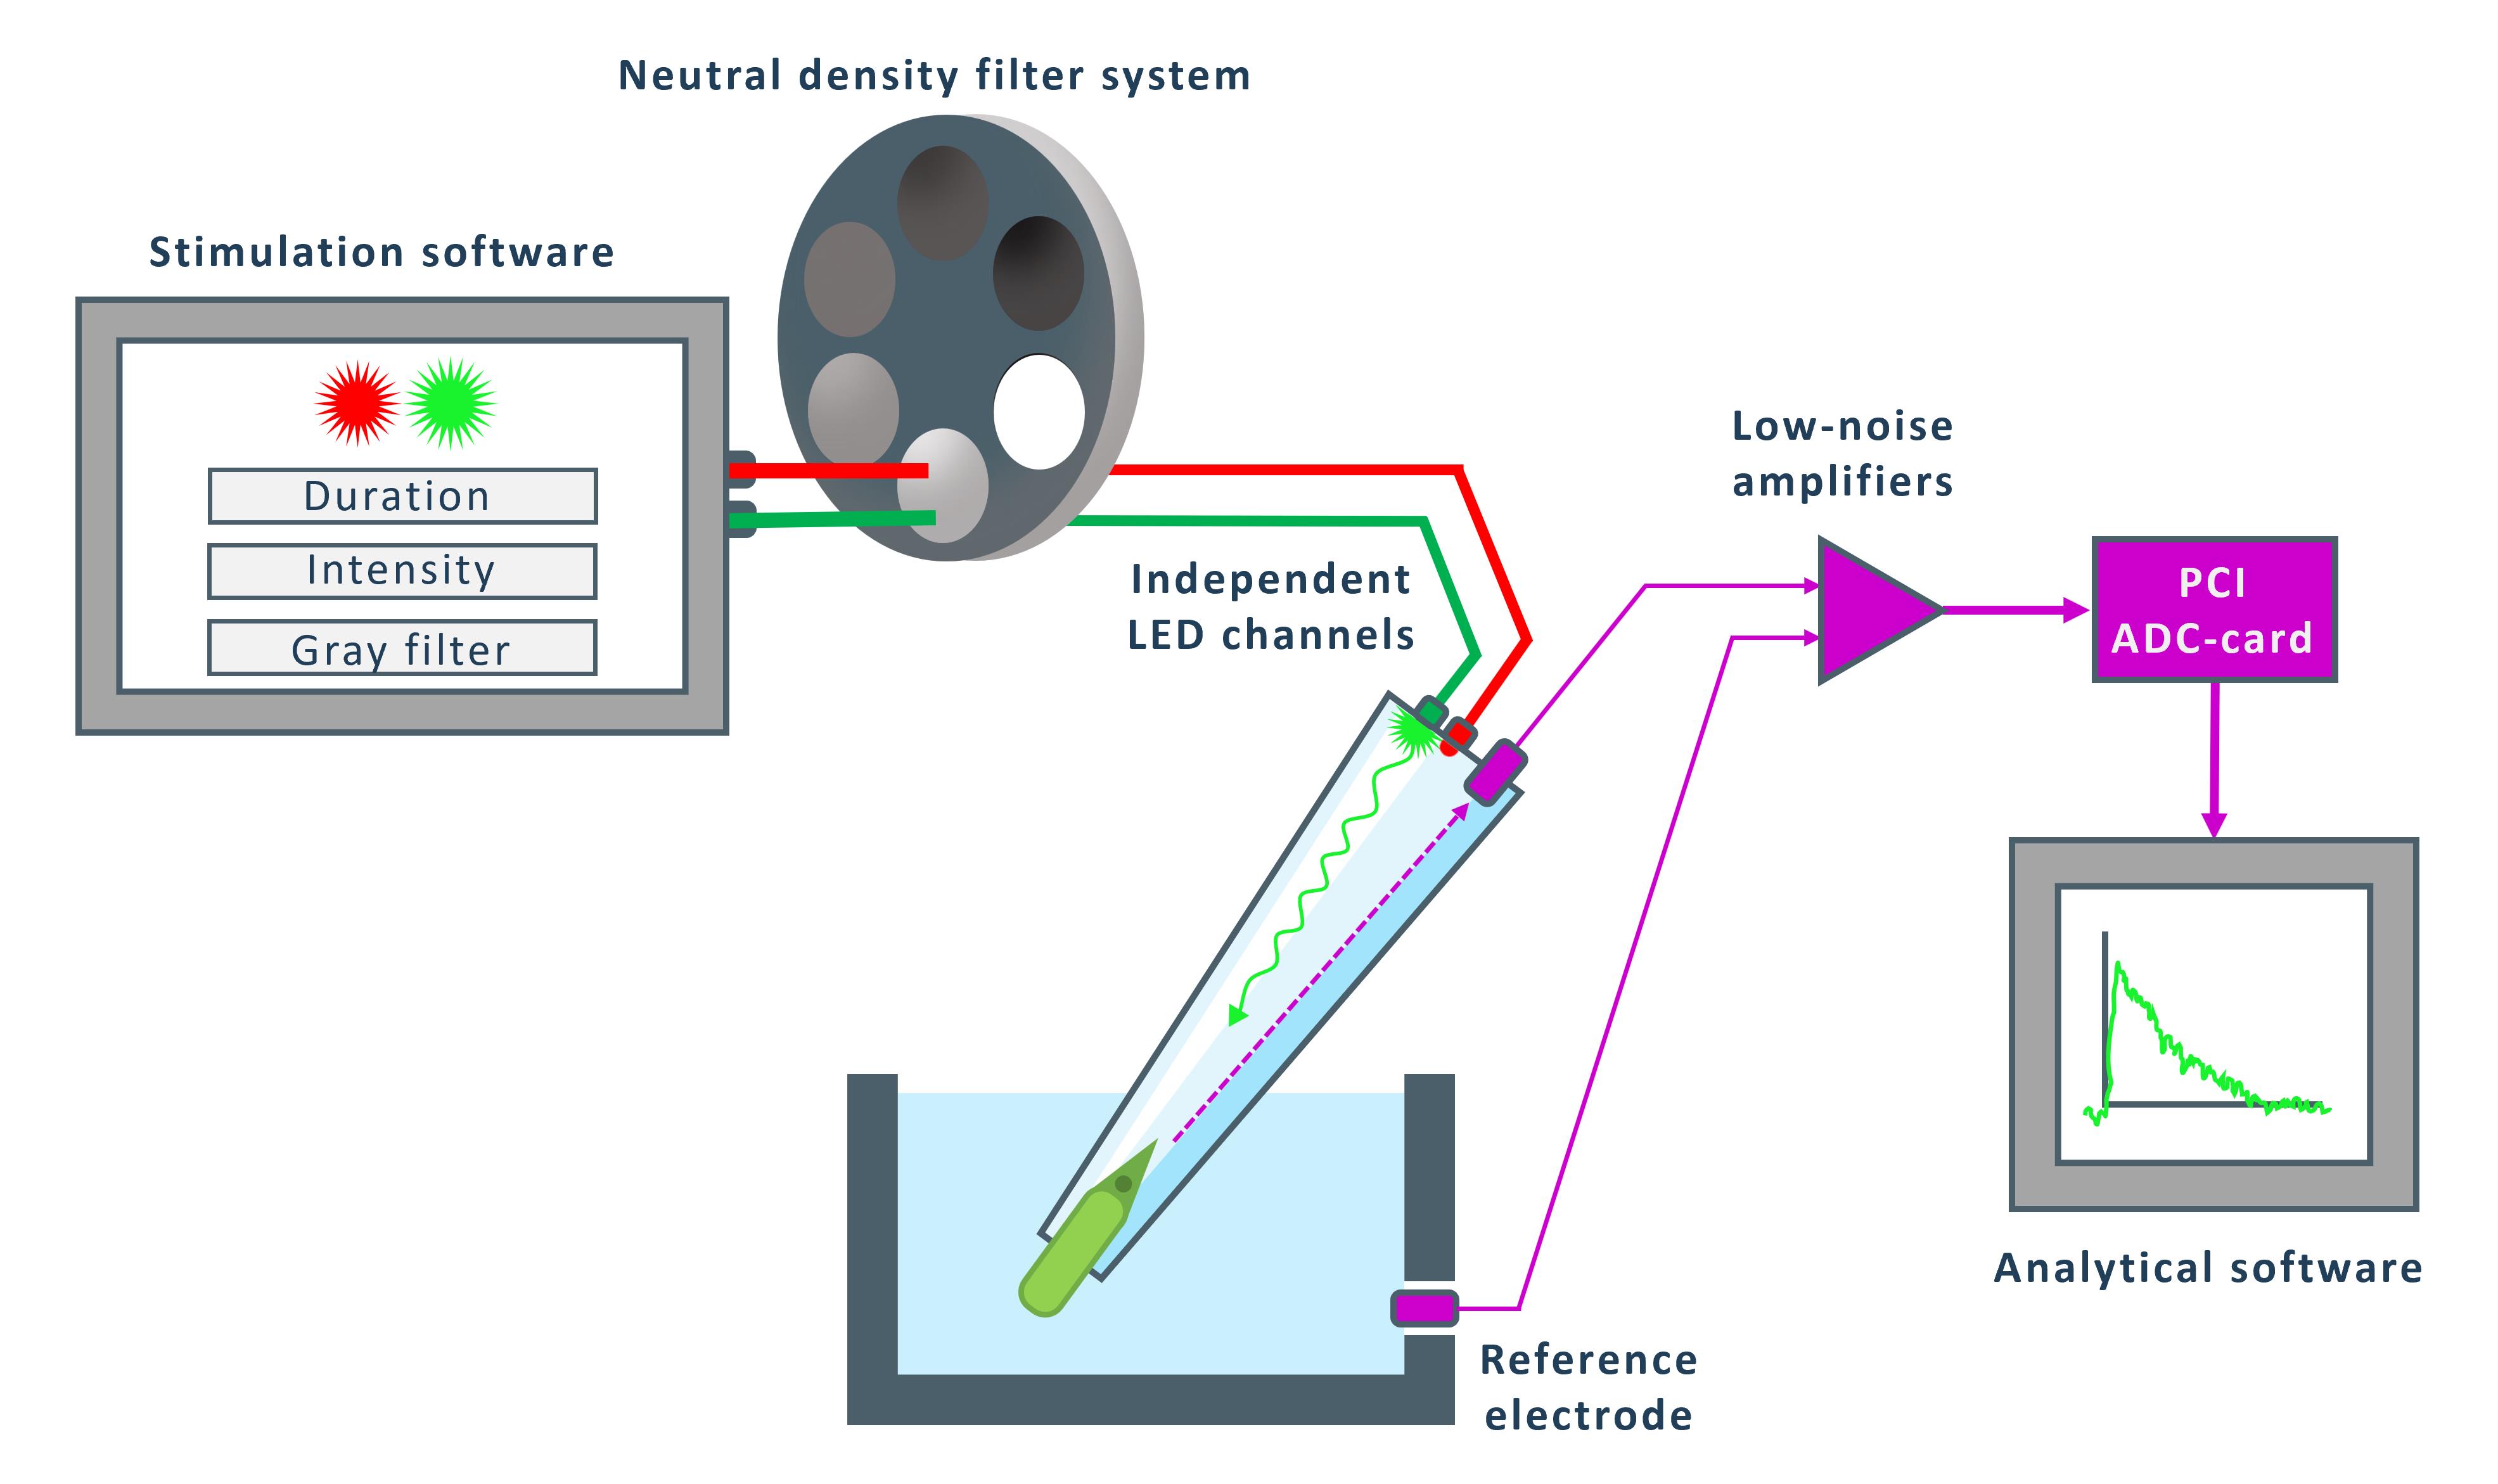
Figure 3. Workflow of the stimulation and recording system. The stimulation software controls two independent LED channels (red and green), allowing adjustment of stimulus duration, intensity, and attenuation via a neutral density filter system. The selected photoreceptor is illuminated, and its photocurrent response is recorded through a reference electrode positioned in the perfusion chamber. The signal is amplified by low-noise preamplifiers and digitized using a PCI-ADC card, after which the data are transferred to the analytical software.
The complex includes:
1. Visualization and stimulation unit comprising a Micromed 1B trinocular inverted microscope with infrared specimen illumination, a high-sensitivity IR CCD camera with image output to a monitor, and an integrated custom-made stimulation system including two independent LED-based optical channels. The stimulation intensity is regulated by the LED current (two orders of adjustment) and by an additional system of grey light filters with a density step of one log unit (five orders of adjustment).
2. Perfusion and cell selection system, including a custom-made chamber for visualizing and selectively collecting cells, glass micropipettes, and manipulators.
3. Unit for recording the electrical response of cells, including low-noise preamplifiers and amplifiers, and a 16-bit NI-6229 ADC card (National Instruments).
The capabilities of the LabView-based software package are as follows:
1. Control package: allows simultaneous stimulation of a selected cell and recording of its electrical response. Stimulation can be performed on one or two channels simultaneously, with any stimulus duration starting from 1 ms and any number of stimuli presented sequentially. The brightness of the stimulation can vary across 7 orders of intensity. Stimulation can be single or multiple to accumulate the signal and improve the signal-to-noise ratio. In the case of multiple stimulation, the experiment operator can view the accumulated signal in the current average mode. After each stimulation, the photoreceptor response is recorded on a hard drive for further processing.
2. The analytical package then reads the stored data in semi-automatic mode. It performs optimal filtering and averaging of rod responses to light stimulation and determines the magnitude and time delay of the maximum response. If necessary, it also determines various other response parameters, including frequency analysis and the kinetics of the rise and fall phases of the response.
Procedure
文章信息
稿件历史记录
提交日期: Nov 4, 2025
接收日期: Jan 26, 2026
在线发布日期: Feb 12, 2026
出版日期: Mar 5, 2026
版权信息
© 2026 The Author(s); This is an open access article under the CC BY-NC license (https://creativecommons.org/licenses/by-nc/4.0/).
如何引用
Chernyshkova, O. V., Nikolaeva, D. A., Meshalkina, D. A., Veligura, V. I. and Firsov, M. L. (2026). Combining Suction-Pipette Spectral Identification With Single-Cell RT-PCR to Make Differential Analyses of Amphibian Red and Green Rods. Bio-protocol 16(5): e5623. DOI: 10.21769/BioProtoc.5623.
分类
神经科学 > 感觉和运动系统 > 视网膜
分子生物学 > DNA > PCR
您对这篇实验方法有问题吗?
在此处发布您的问题,我们将邀请本文作者来回答。同时,我们会将您的问题发布到Bio-protocol Exchange,以便寻求社区成员的帮助。