

Spatial Proteomics Using S4P
基于 S4P 的空间蛋白质组学研究方法
(§Technical contact: qinritian97@126.com) 发布: 2026年03月05日第16卷第5期 DOI: 10.21769/BioProtoc.5620 浏览次数: 515
评审: Prashanth N SuravajhalaHarpreet SinghAnonymous reviewer(s)
参见作者原研究论文
The authors used this protocol in:

Mar 2025
Advertisement


Abstract
Spatial proteomics enables the mapping of protein distribution within tissues, which is crucial for understanding cellular functions in their native context. While spatial transcriptomics has seen rapid advancement, spatial proteomics faces challenges due to protein non-amplifiability and mass spectrometry sensitivity limitations. This protocol describes a sparse sampling strategy for spatial proteomics (S4P) that combines multi-angle tissue strip microdissection with deep learning–based image reconstruction. The method achieves whole-tissue slice coverage with significantly reduced sampling requirements, enabling mapping of over 9,000 proteins in mouse brain tissue at 525 μm resolution within 200 h of mass spectrometry time. Key advantages include reduced sample processing time, deep proteome coverage, and applicability to centimeter-sized tissue samples.
Key features
• Achieves whole-tissue slice coverage for spatial proteomics mapping.
• Enables reconstruction of spatial protein distribution using sparse sampling with multi-angle strip projections.
• Combines mass spectrometry–based proteomics with deep learning–based image reconstruction.
• Reduces required mass spectrometry time by 50%–90% compared to gridding-based approaches.
Keywords: Spatial proteomics (空间蛋白质组学)Graphical overview
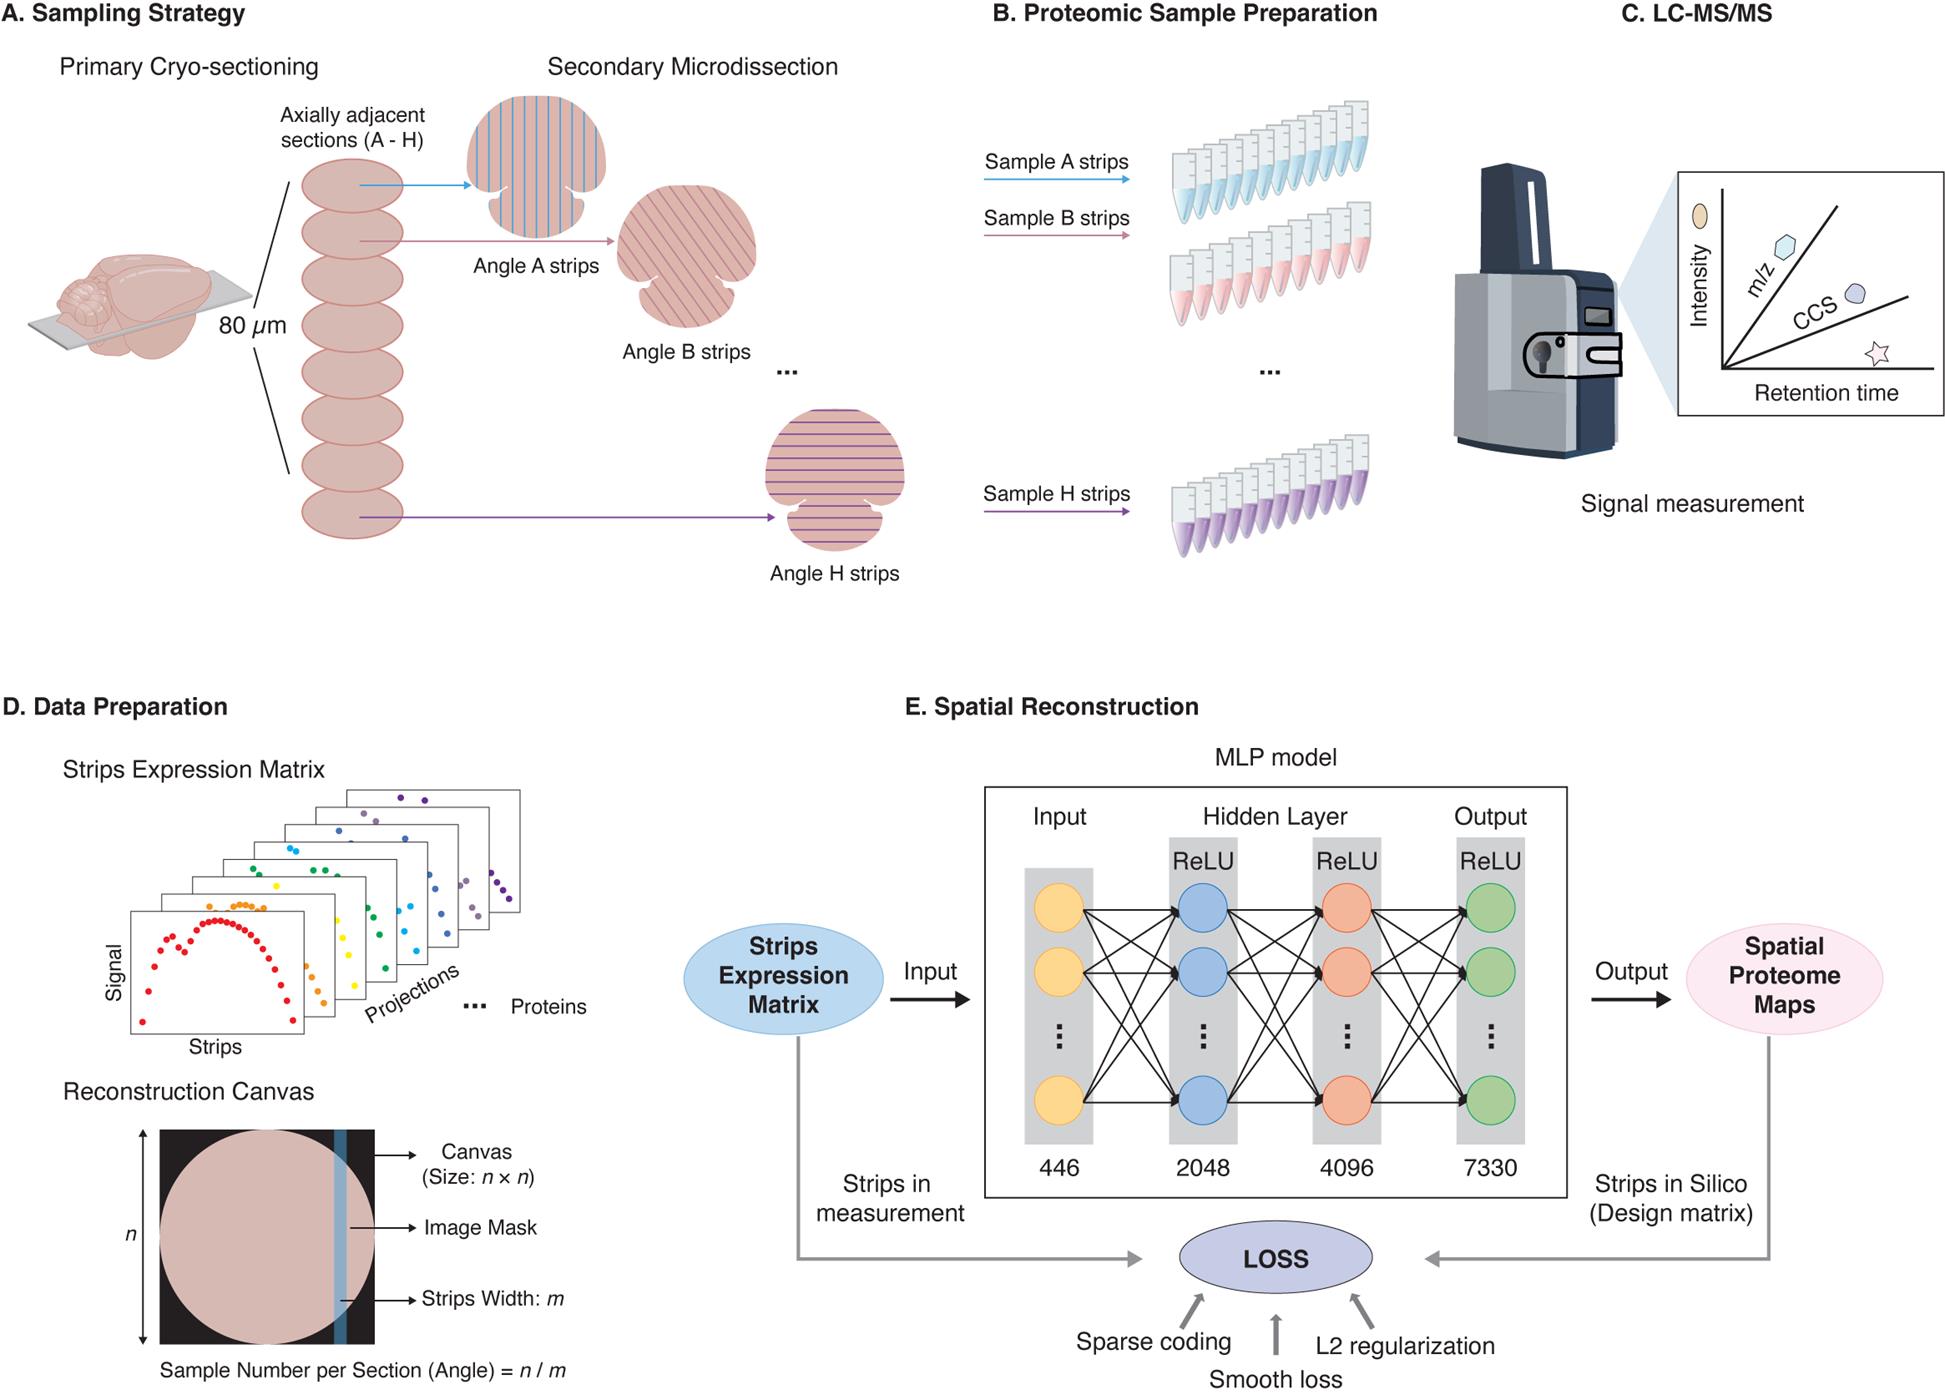
Graphical overview of the sparse sampling strategy for spatial proteomics (S4P) method. (A) Multi-angle strip microdissection from adjacent tissue sections. (B) Proteomic sample preparation of collected strips. (C) LC–MS/MS analysis of collected strips. (D) Data preparation for spatial reconstruction. (E) DeepS4P reconstruction of spatial protein maps.
Background
Spatial mapping of biomolecules within tissues is essential for understanding cellular functions and interactions in their native context [1,2]. While spatial transcriptomics has advanced rapidly, enabling high-resolution and high-throughput mapping of gene expression [3–6], direct measurement of protein spatial distribution remains challenging. This discrepancy is critical given the often poor correlation between mRNA and protein abundance in mammalian tissues, which can lead to biased inferences about gene activity when relying solely on transcriptional data [7–11]. Existing spatial proteomics methods face significant limitations. Antibody-based techniques like imaging mass cytometry (IMC) offer single-cell resolution but are limited to analyzing only several dozen proteins [12]. Conversely, liquid chromatography–mass spectrometry (LC-MS) provides deep, untargeted proteome coverage but requires impractical amounts of instrument time for high-resolution whole-tissue mapping. For instance, mapping a 1-cm diameter tissue at 100 μm resolution using a “gridding” approach requires ~8,000 samples and over 8,000–10,000 h of MS time [13–15], making it infeasible for research applications.
The sparse sampling strategy for spatial proteomics (S4P) protocol presented here addresses these throughput and sensitivity bottlenecks. By integrating multi-angle tissue strip microdissection with a deep learning–based image reconstruction algorithm (DeepS4P), S4P significantly reduces the number of samples required for spatial reconstruction. This method enables the mapping of over 9,000 proteins in a mouse brain at 525 μm resolution within approximately 200 h of MS time, representing a 50% reduction compared to gridding-based strategies and potential reductions of 15–20 times for higher resolutions [13,14]. The primary advantages of S4P over existing methods include its ability to achieve whole-tissue slice coverage for centimeter-sized samples with deep proteome depth, while drastically reducing the formidable MS time previously required. A key limitation of the current protocol is its reliance on eight adjacent tissue slices for reconstruction, which provides an average profile across an 80 μm z-axis span. Furthermore, the minimum practical strip width is currently ~100 μm due to laser-induced tissue damage during microdissection. For future applications requiring single-cell resolution, S4P could be combined with tissue expansion methods [14] and microfluidic technology [16]. Beyond mapping protein distributions in complex organs like the brain, the S4P protocol is applicable to a wide range of tissues for investigating spatial proteome variations during development, disease progression, and drug treatment, offering a powerful tool for both basic research and translational studies.
While the S4P method represents a significant leap in whole-tissue, spatially resolved deep proteomics, it remains constrained by limited spatial resolution for analyzing subcellular compartments. To address this, the S4P framework can be enhanced through several promising avenues. First, improvements in spatial reconstruction algorithms can significantly boost the effective resolution derived from sparse sampling data. Second, integrating S4P with complementary techniques can bridge the resolution gap. For instance, combining S4P with methods like HyperLOPIT [17], which excels at assigning proteins to specific organelles through biochemical fractionation and multivariate analysis, could correlate tissue-scale architecture with detailed subcellular localization. Third, advanced sample preparation strategies can be employed, such as tissue expansion techniques [14] that physically enlarge specimens before S4P analysis, thereby achieving finer effective sampling. Finally, the workflow of S4P can be simplified and optimized through the adoption of microfluidic techniques [18] or robotic automation systems [19]. By combining these strategic improvements, S4P can evolve into a more versatile platform, offering a comprehensive, multi-scale framework for spatial proteomic investigation.
Materials and reagents
Biological materials
1. Mouse tissue (C57BL/6J, 8-week-old female) (obtained from The Beijing Proteome Research Center)
2. Quality control: HeLa cells (ATCC, catalog number: CCL-2)
Reagents
1. Optimal cutting temperature compound (OCT) (Sakura Finetek, catalog number: 4583)
2. 2-methylbutane (isopentane) (Sigma-Aldrich, catalog number: M32631)
3. Urea (Sigma-Aldrich, catalog number: U1250)
4. Sodium deoxycholate (SDC) (Sigma-Aldrich, catalog number: D6750)
5. Tris-(2-carboxyethyl)-phosphine (TCEP) (Thermo Fisher Scientific, catalog number: 77720), freshly prepared
6. Chloroacetamide (CAA) (Sigma-Aldrich, catalog number: C0267)
7. Protease inhibitor cocktail (PIC) (Sigma-Aldrich, catalog number: P8340); store at -20 °C in aliquots to avoid freeze-thaw cycles
8. Tris-HCl (Sigma-Aldrich, catalog number: T5941)
9. Ammonium bicarbonate (ABC) (Sigma-Aldrich, catalog number: 09830)
10. Sequencing-grade trypsin (Promega, catalog number: V5111); store at -80 °C; reconstituted enzyme should be used immediately or stored at -20 °C for short-term use
11. Lys-C (Fujifilm Wako, catalog number: 125-05061); store at -80 °C
12. Formic acid (FA) (Fisher Scientific, catalog number: A117-50)
13. Indexed Retention Time (iRT) peptides (Biognosys, catalog number: Ki3002)
14. Phosphate-buffered saline (PBS) (Thermo Fisher Scientific, catalog number: 10010002)
Solutions
1. Lysis buffer for the bulk sample (see Recipes)
2. Lysis buffer for microdissected strips (see Recipes)
3. Digestion buffer for the bulk sample (see Recipes)
4. Digestion buffer for microdissected strips (see Recipes)
5. Buffer A (see Recipes)
6. Buffer B (see Recipes)
Recipes
1. Lysis buffer for the bulk sample
| Reagent | Final concentration | Quantity or volume |
|---|---|---|
| Urea | 8 M | 480 mg |
| SDC | 1% | 50 mg |
| TCEP | 10 mM | 100 μL |
| CAA | 40 mM | 100 μL |
| PIC | 1× | 100 μL |
| Tris-HCl (1 M, pH 8.5) | 100 mM | 500 μL |
| Total | n/a | To 1 mL |
2. Lysis buffer for microdissected strips
| Reagent | Final concentration | Quantity or volume |
|---|---|---|
| SDC | 1% | 50 mg |
| TCEP | 10 mM | 100 μL |
| CAA | 40 mM | 100 μL |
| PIC | 1× | 100 μL |
| Tris-HCl (1 M, pH 8.5) | 50 mM | 500 μL |
| Total | n/a | To 1 mL |
3. Digestion buffer for the bulk sample
Add Lys-C and trypsin in 100 mM ABC at an enzyme/substrate ratio of 50:1 (wt/wt) and incubate in a thermomixer at 37 °C at 1,000 rpm for 16 h.
4. Digestion buffer for microdissected strips
Digest in 50 mM ABC (pH 8.0) with an enzyme usage of 0.05 pg of trypsin per cubic micrometer tissue (pg/μm3).
5. Buffer A
0.1% FA in water
6. Buffer B
80% ACN with 0.1% FA
Laboratory supplies
1. Ceramic beads (1 and 3 mm) (MP Biomedicals, catalog numbers: 150010 and 150030)
2. Protein LoBind tubes (Eppendorf, catalog number: 0030108116)
3. 0.5 mL centrifuge tubes (Corning, catalog number: 3208)
4. 1.5 mL centrifuge tubes (Corning, catalog number: 3620)
5. 10 μL pipette tips (Axygen, catalog number: T-300-L)
6. 200 μL pipette tips (Axygen, catalog number: T-200-C-L)
7. 1,000 μL pipette tips (Axygen, catalog number: T-1,000-C)
8. Cell culture plates (Nunc EasyDish, catalog number: 150468)
9. C18 solid phase extraction disks (3M Empore, catalog number: 98060402173)
10. PEN membrane slides (Carl Zeiss, catalog number: 415190-9041-000)
11. Opaque adhesive caps (Carl Zeiss, catalog number: 415190-9181-000)
12. Ex kit (Omicsolution, catalog number: OSFP004-96)
Equipment
1. Cryostat (Leica, model: CM1950)
2. Laser microdissection system (Leica, model: LMD7000)
3. Omni Bead Ruptor Elite homogenizer (OMNI)
4. Sonicator Chromatin and DNA Shearing System (Qsonica, catalog number: Q800R3)
5. Thermomixer (Eppendorf, catalog number: 5382000074)
6. Centrifuge 5424R (Eppendorf, catalog number: 5404000090)
7. Research® Plus pipettes (0.1–2.5 μL) (Eppendorf, catalog number: 3123000217)
8. Research® Plus pipettes (2–20 μL) (Eppendorf, catalog number: 3123000292)
9. Research® Plus pipettes (20–200 μL) (Eppendorf, catalog number: 3123000250)
10. Research® Plus pipettes (100–1,000 μL) (Eppendorf, catalog number: 3123000268)
11. SpeedVac concentrator (Thermo Fisher Scientific, catalog number: SPD1030A-230)
12. HPLC system (RIGOL, model: RIGOL L-3120)
13. Ultimate 3000 nanoLC system (Thermo Fisher Scientific)
14. timsTOF Pro mass spectrometer (Bruker Daltonics)
Software and datasets
1. Data processing: Spectronaut, 16.2, commercial, paid
2. Deep learning: PyTorch, 1.13.1, free
3. Programming: Python, 3.9.13, free
4. Database: Uniprot/Mus musculus, 2022_01, free
5. Data repository: iProx, free
Note: As an alternative to Spectronaut, users may consider DIA-NN (open-source) for DIA data processing, though parameter optimization may be required.
Procedure
文章信息
稿件历史记录
提交日期: Dec 4, 2025
接收日期: Jan 26, 2026
在线发布日期: Feb 9, 2026
出版日期: Mar 5, 2026
版权信息
© 2026 The Author(s); This is an open access article under the CC BY license (https://creativecommons.org/licenses/by/4.0/).
如何引用
Qin, R., He, F. and Qin, W. (2026). Spatial Proteomics Using S4P. Bio-protocol 16(5): e5620. DOI: 10.21769/BioProtoc.5620.
分类
生物信息学与计算生物学
生物化学 > 蛋白质 > 定量
系统生物学 > 蛋白质组学 > 空间蛋白组学
您对这篇实验方法有问题吗?
在此处发布您的问题,我们将邀请本文作者来回答。同时,我们会将您的问题发布到Bio-protocol Exchange,以便寻求社区成员的帮助。