

sc3D: A Comprehensive Tool for 3D Spatial Transcriptomic Analysis
sc3D:用于三维空间转录组分析的综合工具
发布: 2026年02月20日第16卷第4期 DOI: 10.21769/BioProtoc.5607 浏览次数: 1066
评审: Navnita DuttaAnonymous reviewer(s)
参见作者原研究论文
The authors used this protocol in:

Jul 2023
Advertisement


Abstract
Serial spatial omics technologies capture genome-wide gene expression patterns in thin tissue sections but lose spatial continuity along the third dimension. Reconstructing these two-dimensional measurements into coherent three-dimensional volumes is necessary to relate molecular domains, gradients, and tissue architecture within whole organs or embryos. sc3D is an open-source Python framework that registers consecutive spatial transcriptomic sections, interpolates bead coordinates in three dimensions, and stores the result in an AnnData object compatible with Scanpy. The workflow performs slice alignment, 3D reconstruction, optional downsampling, and interactive visualization in a napari-sc3D-viewer, enabling virtual in situ hybridization and spatial differential gene expression analysis. We tested sc3D on Slide-seq and Stereo-seq datasets, including E8.5 and E16.5 mouse embryos, recovering continuous tissue morphologies, cardiac anatomical markers, and the expected anterior–posterior gradients of Hox gene expression. These results show that sc3D allows reproducible reconstruction and analysis of volumetric spatial omics data across different samples and experimental platforms.
Key features
• 3D reconstruction: sc3D aligns serial Slide-seq arrays and interpolates between sections to generate volumetric transcriptomic datasets preserving tissue geometries.
• Portable data formats: Outputs a .h5ad object storing coordinates, expression, and metadata, readable in Python or napari-sc3D-viewer.
• Integrated visualization: The napari plugin enables interactive 3D exploration, virtual in situ hybridization, and gene expression profiling along developmental axes.
• Spatial differential expression: Built-in functions detect regionally enriched genes and export quantitative 3D heatmaps and ranked tables.
Keywords: sc3D (sc3D)Graphical overview
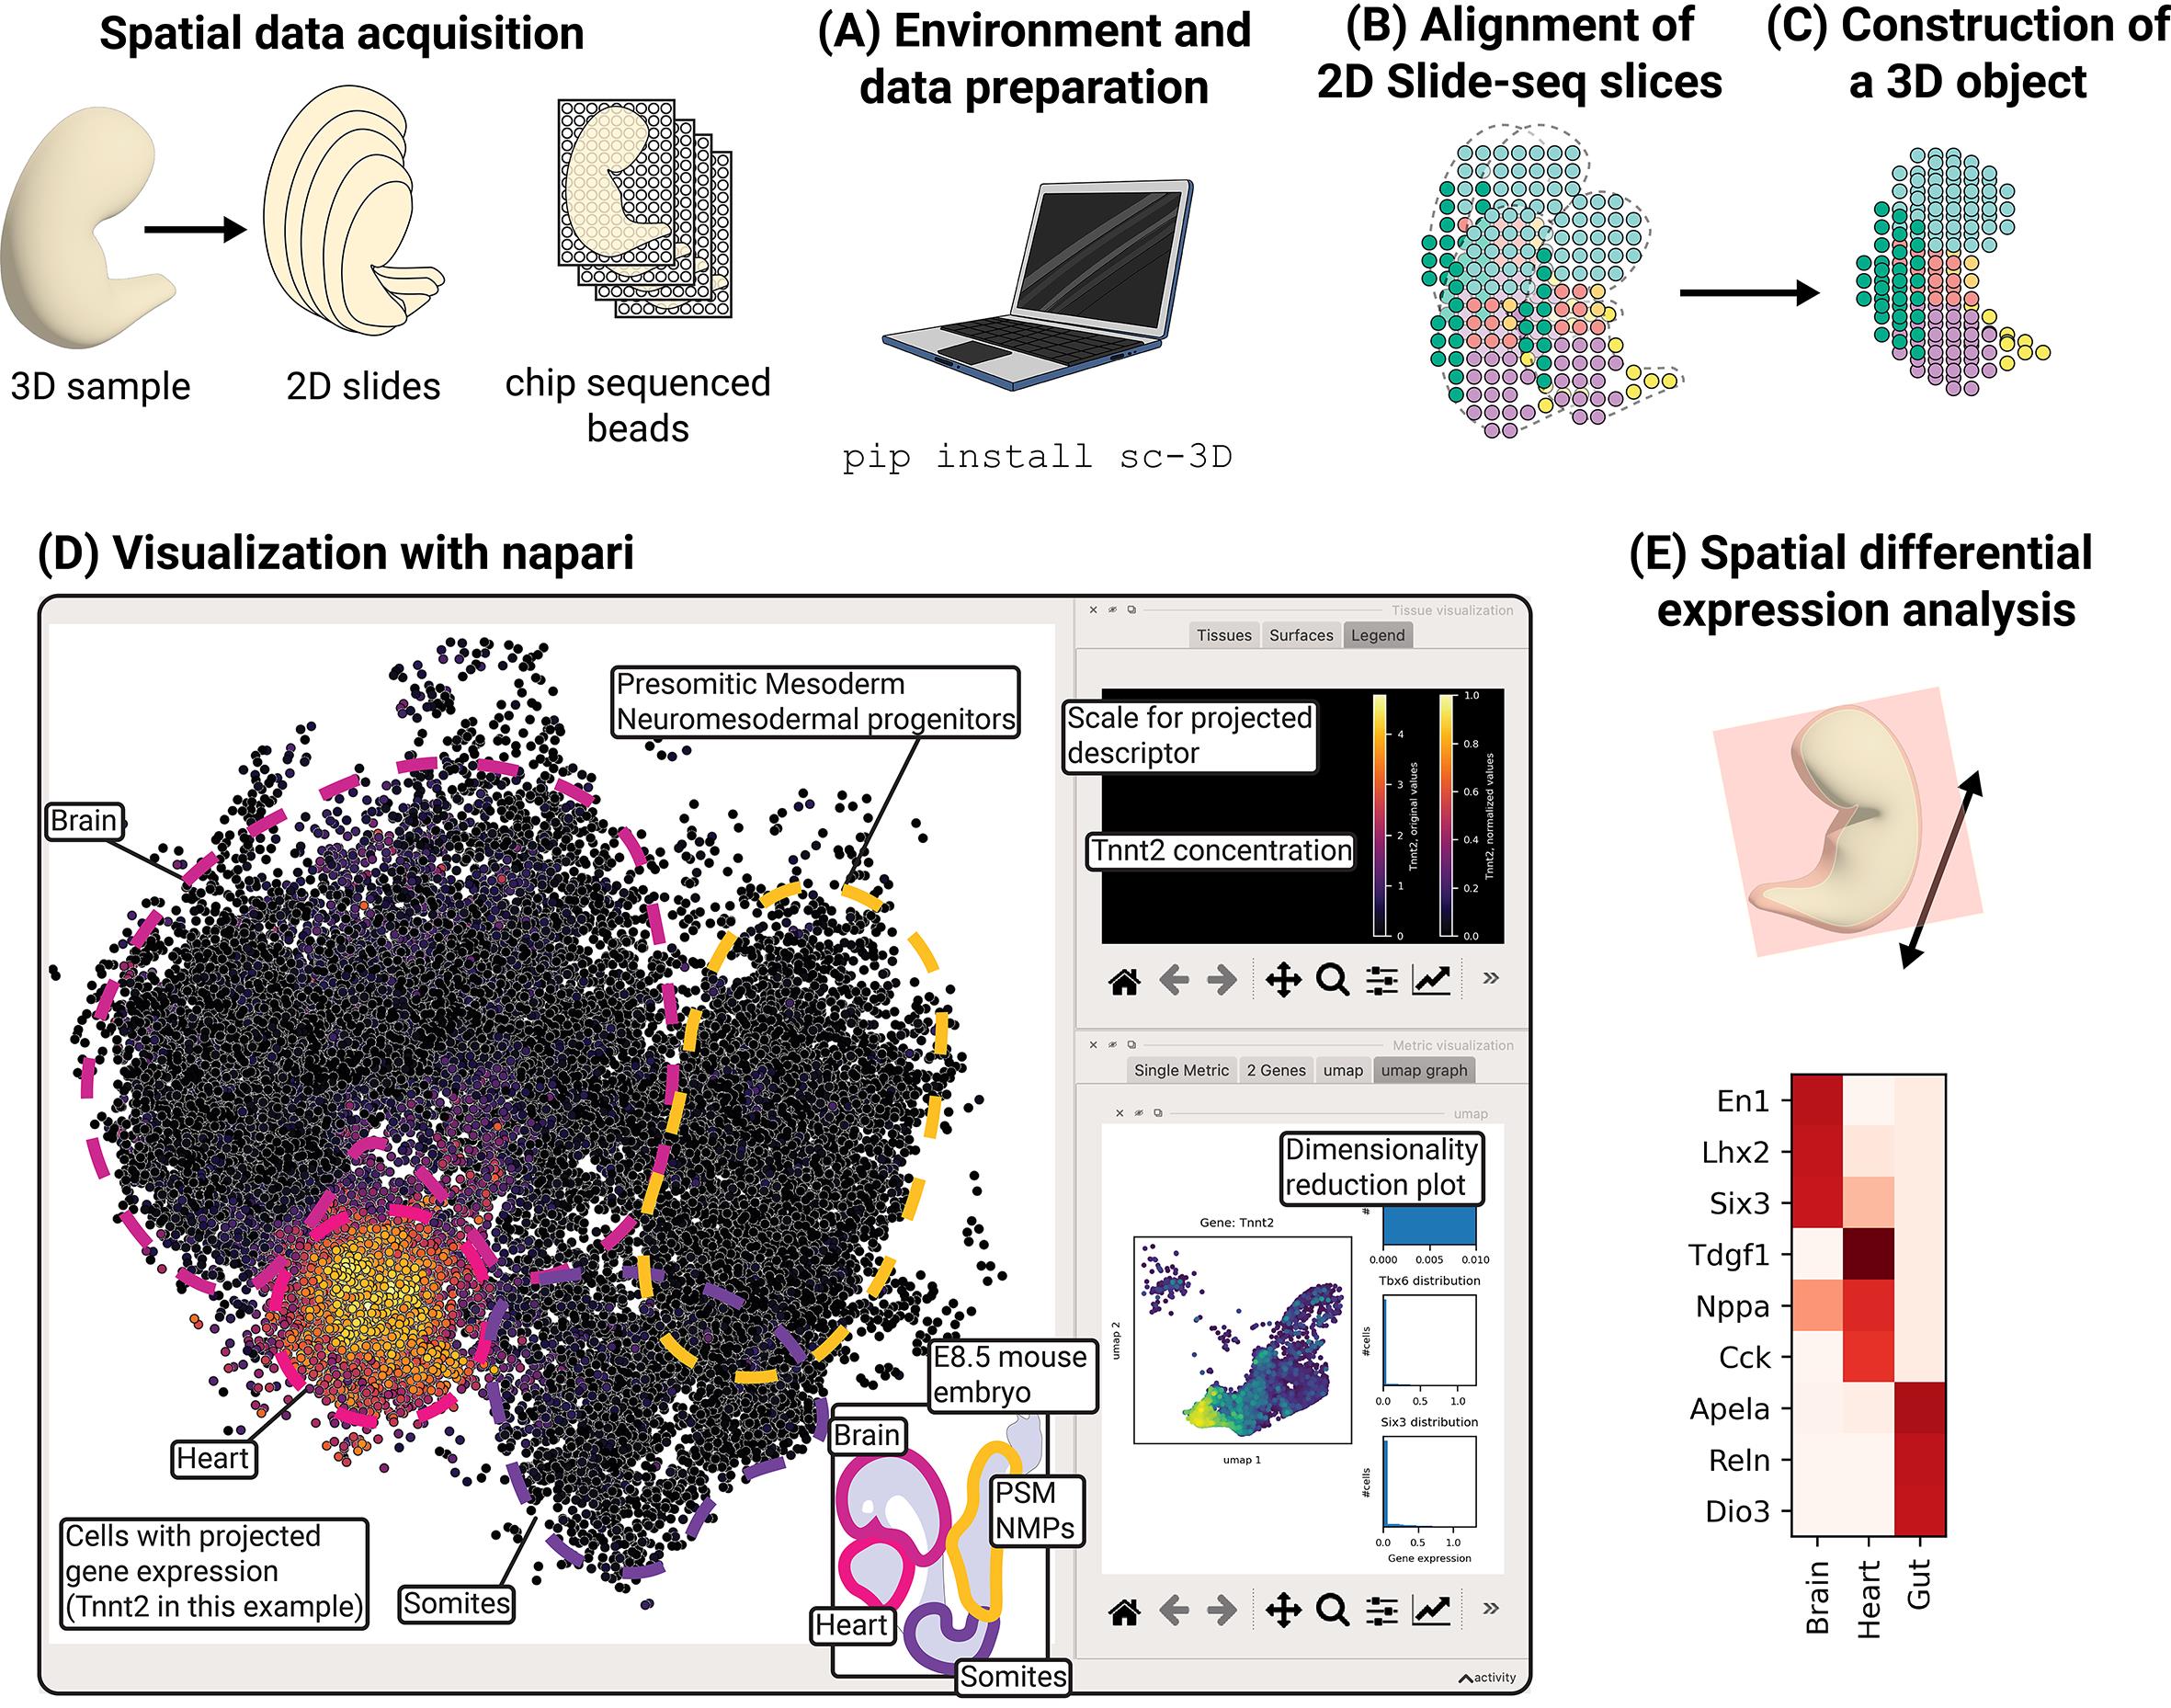
Reconstruction, visualization, and spatial differential expression analysis of 3D spatial transcriptomic data. The sc3D workflow comprises five stages: (A) environment setup and data preparation, (B) alignment of 2D Slide-seq slices, (C) construction of a 3D .sc3d object, (D) visualization with napari, and (E) spatial differential expression analysis.
Background
The way cells are positioned relative to each other influences how tissues function, guiding processes such as embryonic development, tissue repair, and disease progression. For example, during embryonic development, coordinated morphogenesis depends on precise spatial and temporal control of cell fate decisions, migration, and tissue interactions, giving rise to reproducible three-dimensional architectures from initially homogeneous progenitor fields [1–3]. Spatial omics technologies such as Slide-seq and Stereo-seq now enable genome-wide mapping of gene expression across serial two-dimensional sections, providing molecular insight into gradients, boundaries, and neighborhood interactions between cells. These approaches have revealed fine-grained transcriptional domains in development and disease [4–6]. Even though recent tools have started to provide means to analyze gene expression domains in 3D [7–9], spatial transcriptomics data remain inherently planar; each section captures only a local snapshot, and continuity across depth is lost. Consequently, the volumetric architecture of organs or complex systems (how domains connect, how gradients extend, and how cells interact in three dimensions) remains fragmented.
sc3D provides a computational framework to reconstruct three-dimensional spatial omics datasets from serial two-dimensional sections. The workflow estimates geometric transformations between adjacent slices, interpolates bead or spot coordinates along the z-axis, and merges them into a continuous volumetric dataset that preserves tissue geometry. Within this reconstructed volume, users can visualize gene expression distributions, quantify spatial gradients, and perform 3D-aware differential analyses to identify molecules enriched within defined regions or neighborhoods. The resulting registered .h5ad dataset can be explored interactively in the napari-sc3D-viewer, enabling virtual in situ hybridization, segmentation overlays, and volumetric quantification.
By providing an open-source, Python-based implementation integrated with the AnnData and Scanpy ecosystems [10], sc3D promotes reproducible, accessible 3D reconstruction and analysis across laboratories. Its design is modality-agnostic and generalizes to any spatial omics datasets that include x–y coordinates and slice identifiers, enabling quantitative 3D analysis across diverse samples. This integration opens the possibility to bridge spatial transcriptomics with other molecular modalities such as chromatin accessibility, DNA methylation, or spatial proteomics, which are now increasingly profiled in parallel. Together, these advances add another dimension to the quantification of tissue compartmentalization and morphogenetic coordination during embryogenesis [11], tumor progression [12], and regeneration [13].
Software and datasets
| Type | Software/dataset/resource | Version | Date | License | Access |
|---|---|---|---|---|---|
| Data | Mouse embryo Slide-seq E8.5. AnnData (.h5ad) with X_spatial, labels | 2023-04-05 | CC BY | free | |
| Data | Mouse embryo 1 Stereo-seq E16.5. AnnData (.h5ad) | 2022-05-12 | CC BY | free | |
| Software | sc3D (GitHub: GuignardLab/sc3D; PyPI: sc-3D) | 3.0.0 | 2025-06-17 | MIT | free |
| Software | napari-sc3D-viewer (GitHub: GuignardLab/napari-sc3D-viewer) | 2.0.0 | 2025-06-17 | MIT | free |
sc3D installation: The package supports Python ≥ 3.8 and is distributed on PyPI. We recommend creating a dedicated mamba/conda environment and installing sc3D via pip:
mamba create -n sc3d python=3.13mamba activate sc3dpip install sc-3DAlternatively, clone the repository (git clone https://github.com/GuignardLab/sc3D.git) and install in developer mode with pip install -e. For macOS machines with M1 chips, use miniforge to ensure compatibility.
Dependencies: sc3D depends on numpy, scipy, pandas, anndata, scanpy, matplotlib, and napari. Installing jupyter is recommended to run the example notebooks.
Data requirements: Input datasets must be stored as .h5ad anndata objects containing spatial coordinates and gene expression matrices. The x-y coordinates should be stored in obsm['X_spatial'], the array (slice) identifier in obs['orig.ident'], the tissue or cell cluster label in obs['predicted.id'], and gene names as indices or in var['feature_name'].
Slice ordering is inferred from the obs['orig.ident'] field by extracting numeric sequences from the identifier string using a regular expression. Specifically, sc3D identifies all contiguous numeric substrings separated by non-numeric characters and assigns the slice number based on the numeric sequence at position array_id_num_pos. By default (array_id_num_pos = -1), the last numeric sequence in the identifier is used.
For example, identifiers such as coverslip_03, sliceA5, or E8p5_slice_012 yield numeric sequences 03, 5, and 8, 5, 12, respectively. With the default setting, these would be interpreted as slice numbers 3, 5, and 12. If a different numeric component should define slice order, users can specify the appropriate index via the array_id_num_pos parameter.
These column name and parsing behaviors can be customized via the parameters tissue_id, array_id, pos_id, gene_name_id and pos_reg_id. Example of unregistered datasets [14] are available from Figshare ( https://figshare.com/s/9c73df7fd39e3ca5422d).
Output formats: The workflow produces registered .h5ad files containing 3D coordinates and interpolation layers, .sc3d objects used by sc3D-viewer, and optional .h5ad files representing extracted slices or downsampled datasets. The napari-sc3D-viewer plugin (installed via pip install napari-sc3D-viewer) loads these files for interactive exploration.
Hardware requirements and alternatives
sc3D is fully CPU-based and does not require GPU acceleration. For large datasets (for example, on the order of ~500,000 beads), ≥16 GB of RAM is recommended to perform registration and interpolation without downsampling; however, smaller memory configurations can still be used by downsampling the dataset or by limiting interpolation and visualization steps. While this protocol was tested on a local workstation (macOS system, 10-core CPU, 32 GB RAM), sc3D relies exclusively on standard Python scientific libraries and can be executed without modification on cloud or high-memory compute nodes. Detailed tested hardware and software specifications are provided in the reproducibility note.
Procedure
文章信息
稿件历史记录
提交日期: Dec 10, 2025
接收日期: Jan 18, 2026
在线发布日期: Feb 6, 2026
出版日期: Feb 20, 2026
版权信息
© 2026 The Author(s); This is an open access article under the CC BY-NC license (https://creativecommons.org/licenses/by-nc/4.0/).
如何引用
Sendra, M., Bolondi, A. and Guignard, L. (2026). sc3D: A Comprehensive Tool for 3D Spatial Transcriptomic Analysis. Bio-protocol 16(4): e5607. DOI: 10.21769/BioProtoc.5607.
分类
生物信息学与计算生物学
系统生物学 > 空间转录组学
分子生物学 > DNA > 基因表达
您对这篇实验方法有问题吗?
在此处发布您的问题,我们将邀请本文作者来回答。同时,我们会将您的问题发布到Bio-protocol Exchange,以便寻求社区成员的帮助。