

Image-Based Profiling in Live Cells Using Live Cell Painting
基于图像的活细胞表型分析:Live Cell Painting 方法
发布: 2025年10月05日第15卷第19期 DOI: 10.21769/BioProtoc.5464 浏览次数: 1807
评审: Keisuke TabataAnonymous reviewer(s)
参见作者原研究论文
The authors used this protocol in:
Jul 2025


Abstract
High-content analysis (HCA) is a powerful image-based approach for phenotypic profiling and drug discovery, enabling the extraction of multiparametric data from individual cells. Traditional HCA protocols often rely on fixed-cell imaging, with assays like cell painting widely adopted as standard. While these methods provide rich morphological information, the integration of live-cell imaging expands analytical capabilities by enabling the study of dynamic biological processes and real-time cellular responses. This protocol presents a simple, cost-effective, and scalable method for live-cell HCA using acridine orange (AO), a metachromatic fluorescent dye that highlights cellular organization by staining nucleic acids and acidic compartments. The assay provides visualization of distinct subcellular structures, including nuclei and cytoplasmic organelles, using a two-channel fluorescence readout. Compatible with high-throughput microscopy and computational analysis, the method supports diverse applications such as phenotypic screening, cytotoxicity assessment, and morphological profiling. By preserving cell viability and enabling dynamic, real-time measurements, this live-cell imaging approach complements existing fixed-cell assays and offers a versatile platform for uncovering complex cellular phenotypes.
Key features
• Builds upon Garcia-Fossa et al. [1], providing an accessible workflow for image-based profiling in live cells.
• Enables phenotypic profiling and dose–response analysis of diverse perturbants, including small molecules, oligonucleotides, and nanoparticles.
• Provides a live-cell framework to detect subtle, sublethal phenotypic changes, overcoming fixation assay limitations in toxicology and drug discovery.
• Includes a streamlined analysis pipeline supporting efficient and reproducible interpretation of image-based data.
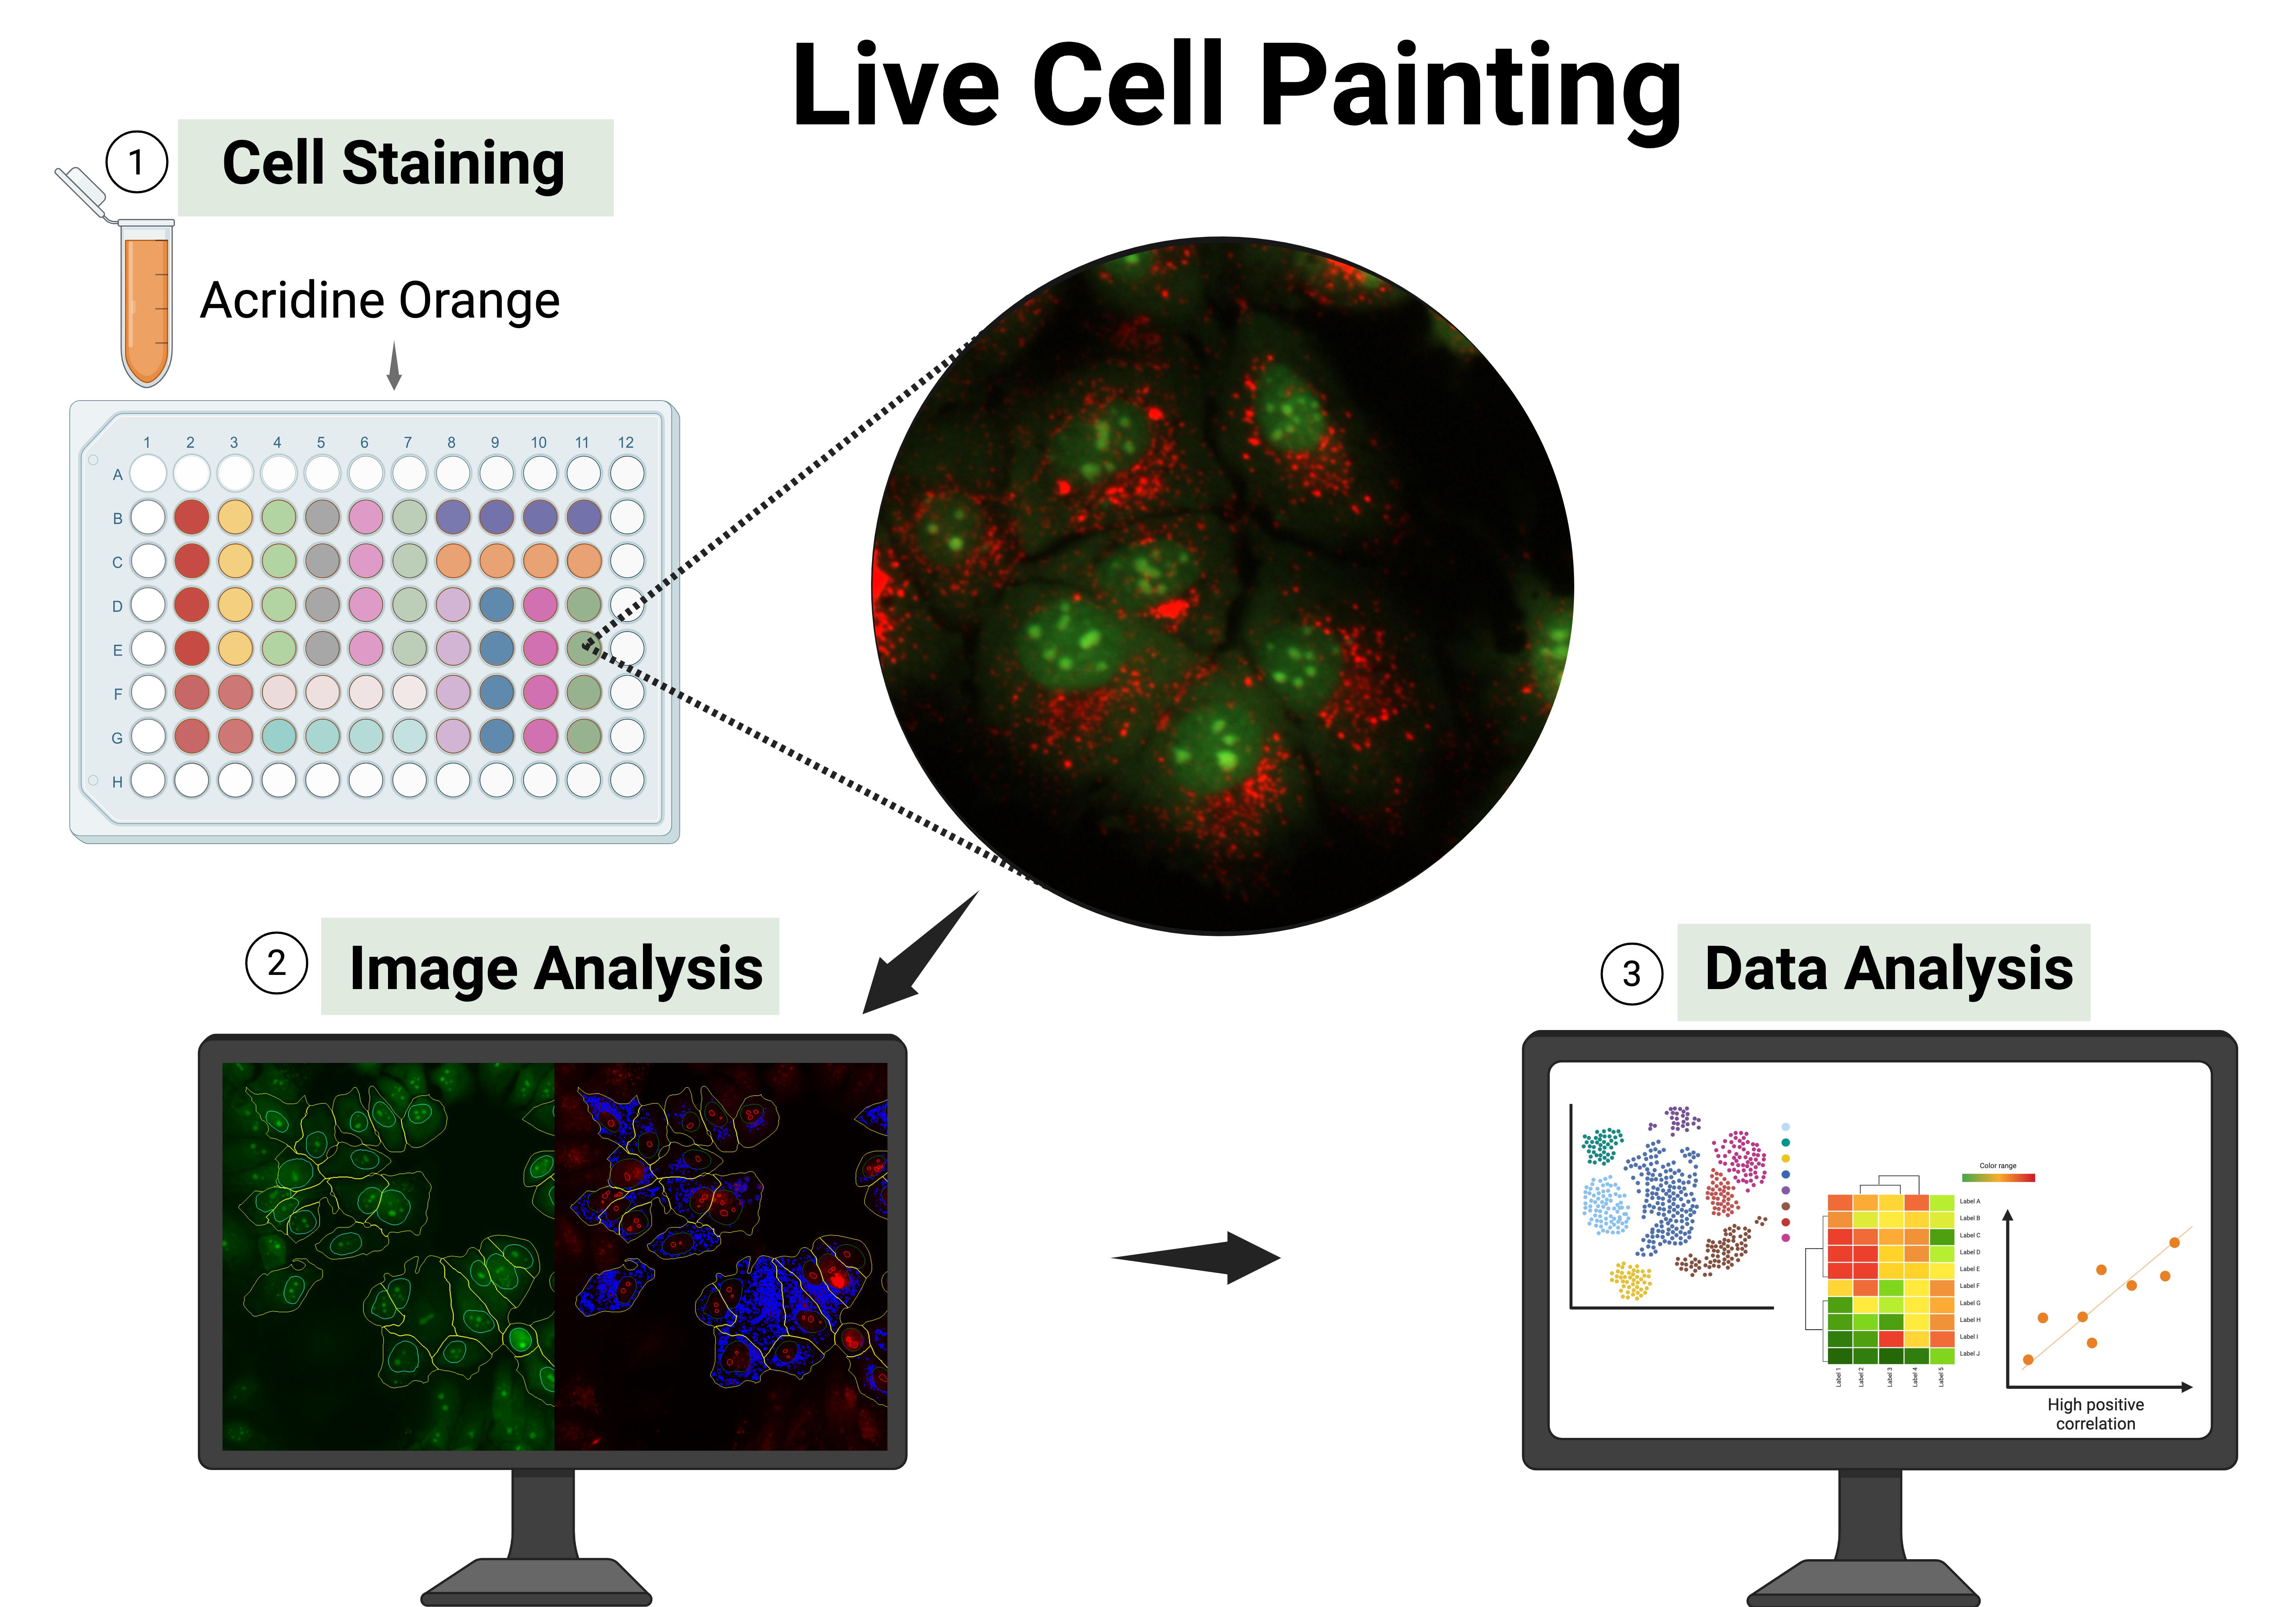
Keywords: Acridine orange staining (吖啶橙染色)Graphical overview
Background
Over the past decades, high-content analysis (HCA) has transformed multiple areas, including basic cell biology, stem cell research, toxicology, developmental biology, and drug discovery, extending even to complex three-dimensional (3D) models [2,3]. This transformation has been driven by advances in automated fluorescence microscopy, the development of versatile fluorescent probes, and rapid progress in computational methods such as image segmentation, feature extraction, and machine learning [4–6]. Together, these tools have created a powerful framework for cellular profiling, enabling the detection of subtle and multifactorial biological responses to perturbations, including small molecules, oligonucleotides, and nanoparticles, that remain inaccessible to conventional techniques [7,8].
A central strategy in HCA relies on fluorescence microscopy, using genetically encoded fluorescent proteins, immunoreagents, fluorescent dyes, or small-molecule probes. These assays typically follow one of two conceptual approaches. The first is a target-based strategy, in which a specific and anticipated biological response is monitored—for example, cellular assays focused on G protein–coupled receptors (GPCRs), ion channels, transporters, DNA damage, or reactive oxygen species (ROS) production [9]. The second approach is unbiased or agnostic to specific biological targets, instead relying on comprehensive staining of cellular architecture. The most prominent technique in this category is cell painting, which labels eight major subcellular structures and has played a key role in advancing the field over the past decade [10]. Most HCA workflows rely on fixed-cell samples, which offer several practical advantages such as ease of handling, compatibility with batch processing, and signal stability. However, fixation can introduce artifacts and eliminates the possibility of capturing live-cell dynamics [11,12]. Additionally, many existing protocols are complex and costly, limiting their accessibility and widespread adoption. Live-cell imaging, in contrast, enables the observation of dynamic biological processes in real time, including the tracking of cellular or subcellular structures, acquisition of kinetic data, analysis of reversible events, and circumvention of fixation-related limitations.
In this protocol, we present live cell painting (LCP), a versatile, cost-effective, and information-rich assay that is simple to implement. This method was established and validated in different cell lines, including Huh-7, MCF-7, PNT1A, and PC3, and can be applied to other cell lines with appropriate concentration adjustments [1]. The method leverages acridine orange (AO), a metachromatic fluorescent dye capable of labeling multiple cellular components in live cells, including nucleic acids and acidic intracellular vesicles (e.g., lysosomes, endosomes, and autophagosolysosomes, among others) (Figures 1 and 2). This dual-channel dye enables multiparametric imaging of various cellular structures, such as nuclei and nucleoli, cytoplasmic organization, cell shape, cell count, and vesicle distribution. The rich morphological and spatial information obtained from AO staining can be applied across a wide range of high-content applications, including phenotypic screening and profiling, target-based screening with morphological readouts, mechanism of action (MoA) elucidation, phenotype recovery assays, toxicity and safety profiling, functional genomics screens (e.g., RNAi or CRISPR), and assays tailored to specific cellular processes. Furthermore, this approach offers a powerful means to generate biologically grounded hypotheses from image-based data. However, like any method, LCP has certain limitations. As with most HCA approaches, it requires access to a fluorescence microscope and imaging-compatible multi-well plates, which may not be readily available in all laboratory settings. Additionally, AO is prone to photobleaching, and its concentration must be carefully optimized for each cell line to avoid cytotoxicity or nonspecific staining. While LCP offers rich morphological insights, complementary assays may still be necessary for a full understanding of cellular function and physiology. Despite these considerations, LCP remains a powerful, cost-effective, and accessible tool for live-cell imaging and high-content morphological profiling.
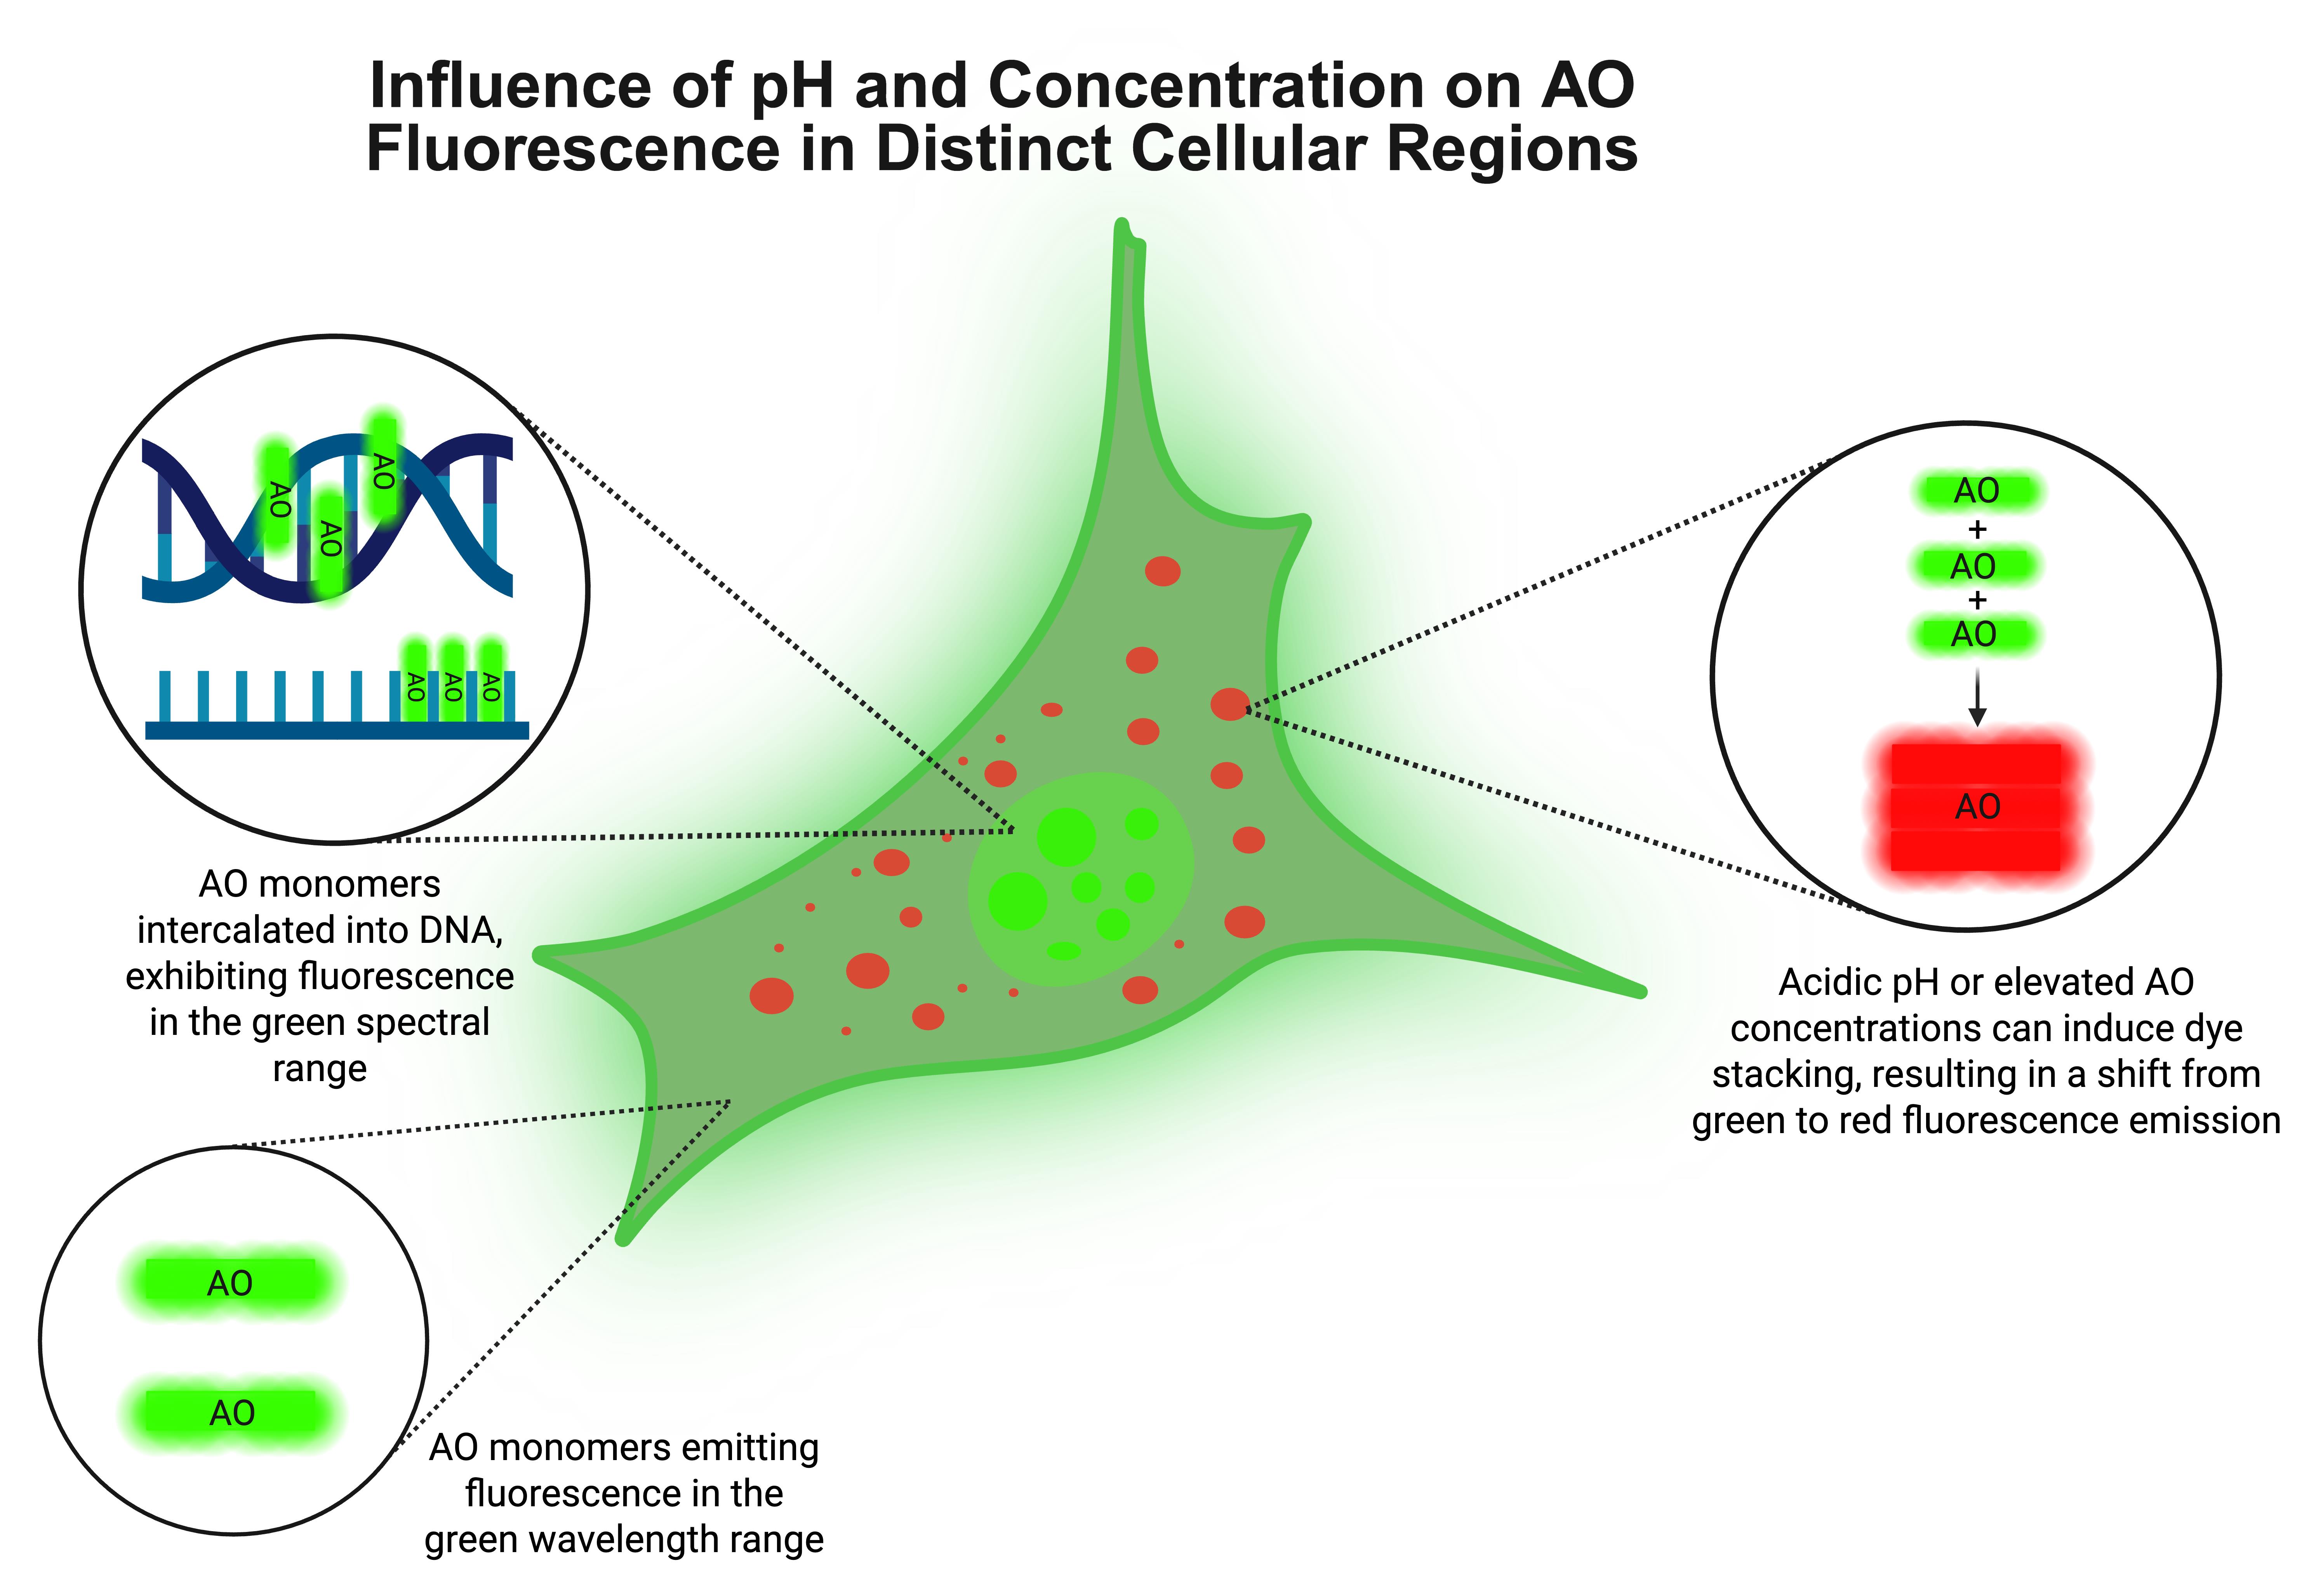
Figure 1. Influence of pH and acridine orange (AO) concentration on its fluorescence behavior in distinct cellular compartments. AO binds nucleic acids by intercalating as monomers into double-stranded DNA and associating electrostatically with single-stranded RNA, both of which result in green fluorescence emission. In acidic compartments, such as lysosomes, or under conditions of high AO concentration, the dye tends to self-aggregate into stacked complexes, shifting its emission from green to red. This dual fluorescence property enables AO to function as a sensitive probe for intracellular localization of nucleic acids, organelle pH, and dye concentration in live-cell imaging.
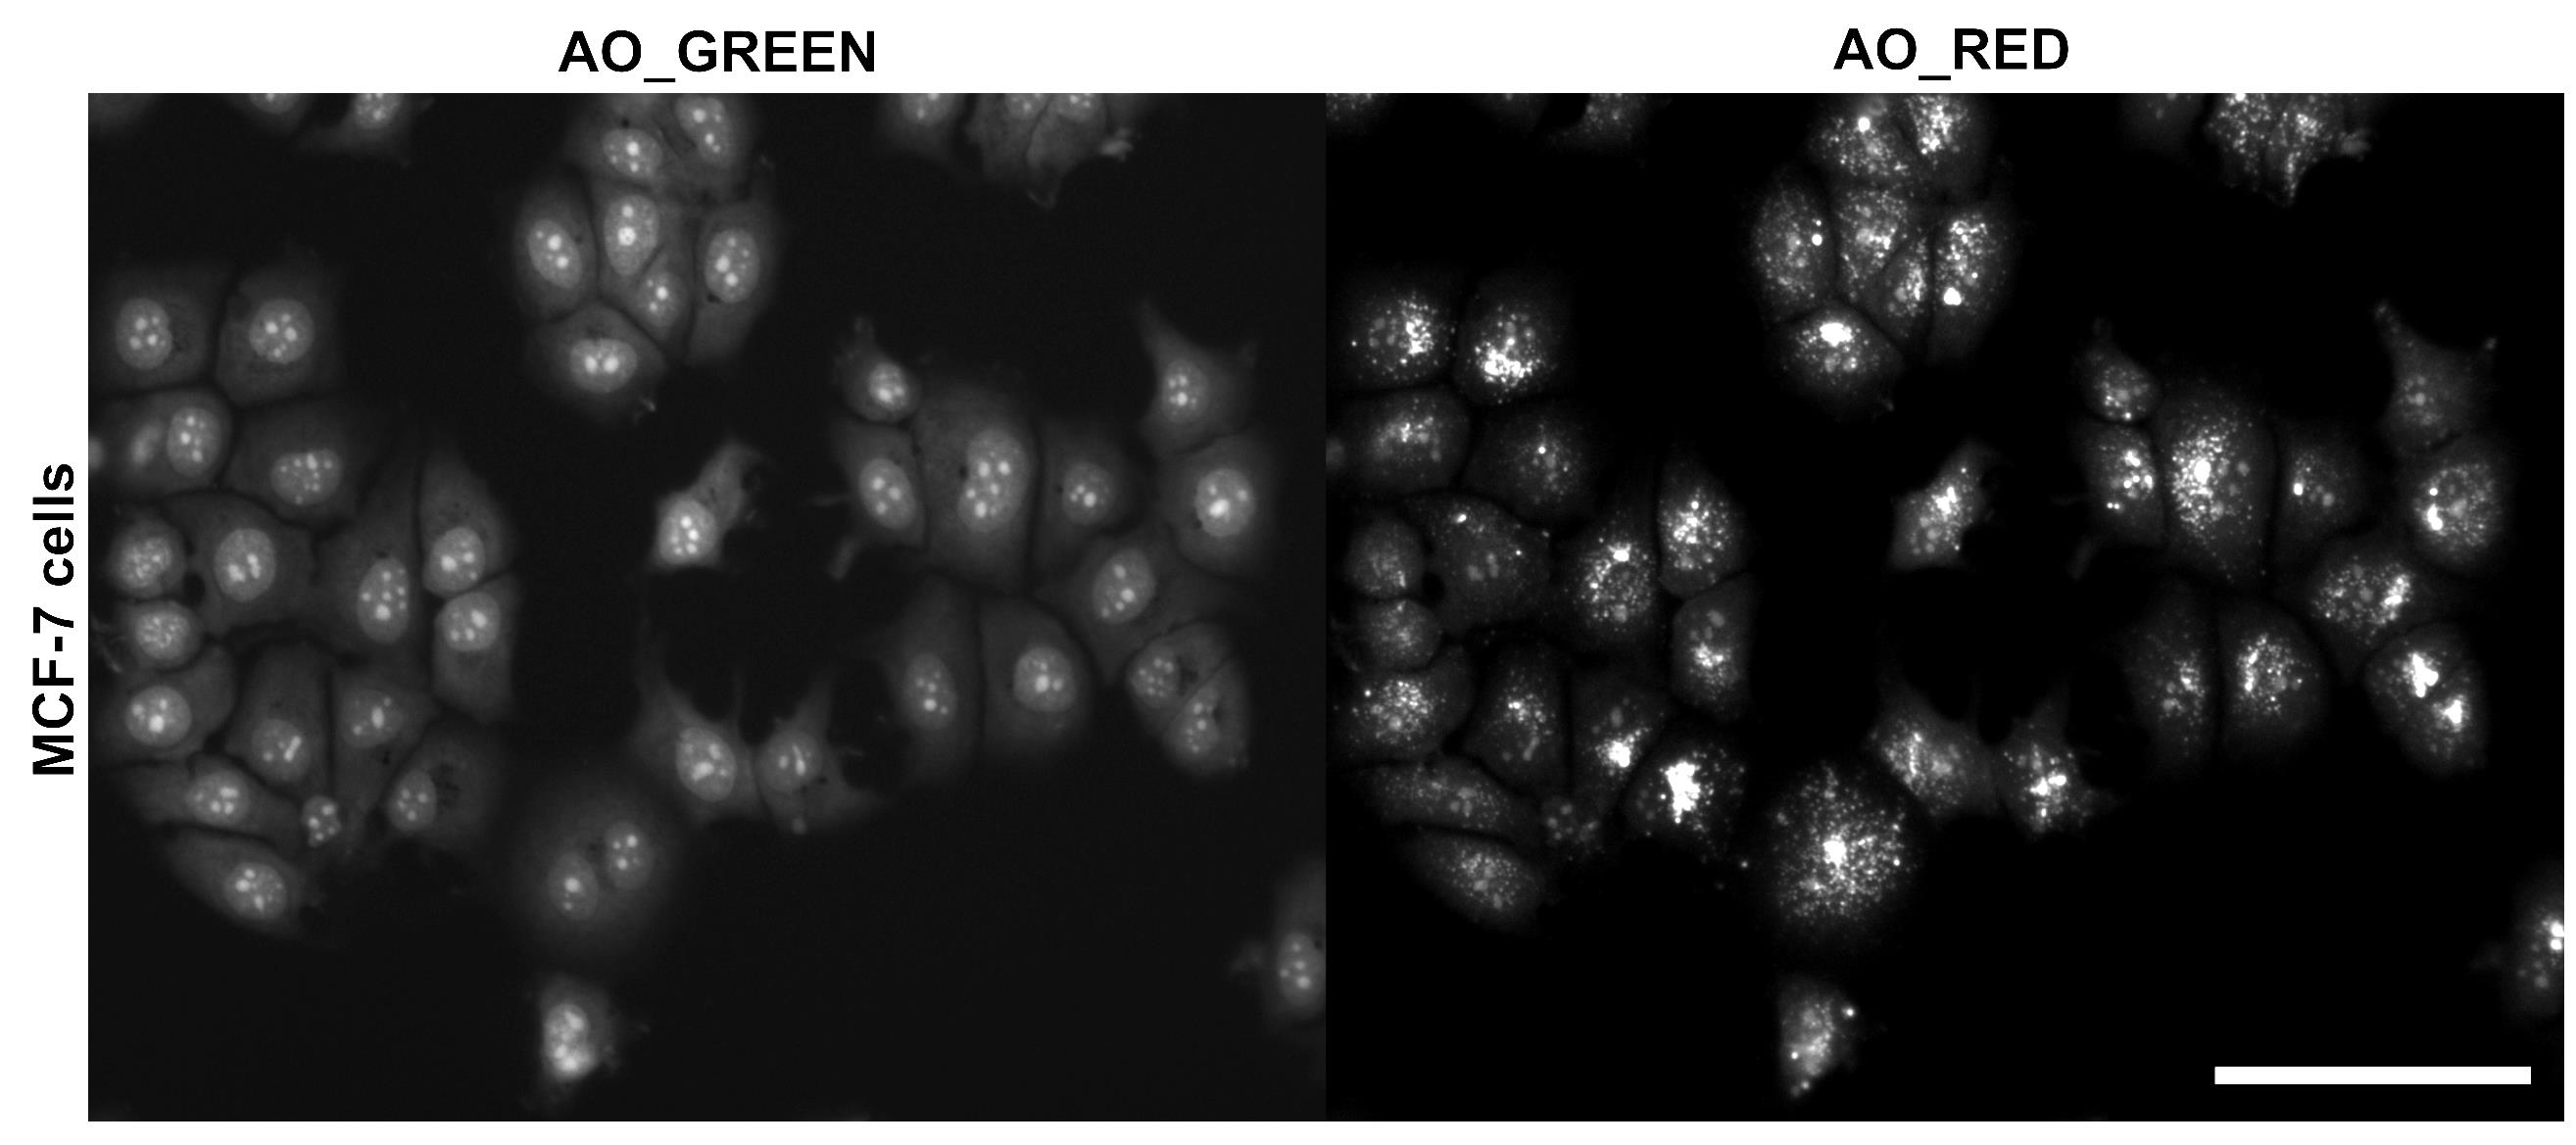
Figure 2. Fluorescence image of MCF-7 cells stained with 10 μM acridine orange (AO), acquired using a 20× objective. The green channel (GFP) highlights nuclei, nucleoli, and cytoplasm, while the red channel (PI) selectively labels acidic vesicular compartments (e.g., lysosomes, endosomes, and autophagolysosomes, among others). Brightness and contrast were adjusted to enhance visualization. The merged image displays the combined spatial distribution of both signals. Scale bar = 100 μm.
Materials and reagents
Biological materials
1. MCF-7 cells (ATCC®, HTB-22TM), stored in liquid nitrogen; under 20 passages and mycoplasma-free
Reagents
1. RPMI-1640 medium (Invitrogen, catalog number: 31800-022)
2. Fetal bovine serum (FBS) (Gibco, catalog number: 12657-029)
3. Penicillin–streptomycin solution (PenStrep or equivalent supplier, catalog number: 15140122)
4. Trypsin–EDTA solution (0.1%) (Sigma-Aldrich or equivalent supplier, catalog number: T4799)
5. Phosphate-buffered saline (PBS) (pH 7.4) (Sigma-Aldrich or equivalent supplier, catalog number: D1283)
6. Trypan blue 0.4% (Invitrogen, catalog number: T10282)
7. Acridine orange (AO) (Sigma-Aldrich or equivalent supplier; catalog number: A1301)
8. FluoroBriteTM DMEM (Gibco, Thermo Fisher Scientific, catalog number: A18967-01)
9. Optional: Hoechst 33342 nuclear stain (Invitrogen, catalog number: H1399)
Equipment
1. Pipettes
2. Flow Hood Class II Type A1 biological safety cabinet (Pachane, model PA-420)
3. Water-Jacketed CO2 incubator (Shel Lab, model: SCO5W)
4. 96-well black polystyrene microplate with μClear® flat bottom (Greiner Bio-One, catalog number: 655090)
5. Fluorescence microscope equipped for live-cell imaging: CytationTM 5 Hybrid Multi-Detection Reader (BioTek Instruments, Inc., Winooski, VT, USA), integrated with a temperature- and CO2-controlled incubation chamber. The system is configured with a 20× Olympus objective plan fluorite with a numerical aperture (NA) of 0.45 and equipped with GFP (EX 469/35 nm, EM 525/39 nm, dichroic mirror 497 nm, LED 465 nm), PI (EX 531/40 nm, EM 647/57 nm, dichroic mirror 605 nm, LED 523 nm), and DAPI (EX 377/50 nm, EM 447/60 nm, dichroic mirror 409 nm, LED 365 nm) filter sets for fluorescence acquisition.
6. Workstation used for image analysis and data processing: Intel® CoreTM i7-14700KF processor (Raptor Lake, 20 cores/28 threads, 10 nm), NVIDIA® GeForce RTXTM 4070 Ti GPU (12 GB GDDR6X), 32 MB L3 cache, and 1920 × 1080 LG Full HD monitor.
Software and datasets
1. Image processing, quality control, and feature extraction were performed using CellProfiler (version 4.2.5, Broad Institute) and CellProfiler Analyst (version 3.0.4, Broad Institute). Additionally, CellPose (version 2.2.3), an open-source deep learning-based segmentation tool, was used for refined segmentation when needed.
2. Data analysis platform: Python (version 3.12.3), using machine learning libraries (e.g., scikit-learn, pandas, pycytominer).
3. All data and code have been deposited to GitHub: https://github.com/broadinstitute/scripts_notebooks_fossa (access date 06/30/2025)
Procedure
文章信息
稿件历史记录
提交日期: Jul 22, 2025
接收日期: Aug 29, 2025
在线发布日期: Sep 15, 2025
出版日期: Oct 5, 2025
版权信息
© 2025 The Author(s); This is an open access article under the CC BY-NC license (https://creativecommons.org/licenses/by-nc/4.0/).
如何引用
Readers should cite both the Bio-protocol article and the original research article where this protocol was used:
- Moraes-Lacerda, T., Rodrigues-Da-Silva, M., Singh, S. and De Jesus, M. B. (2025). Image-Based Profiling in Live Cells Using Live Cell Painting. Bio-protocol 15(19): e5464. DOI: 10.21769/BioProtoc.5464.
- Garcia-Fossa, F., Moraes-Lacerda, T., Rodrigues-da-Silva, M., Diaz-Rohrer, B., Singh, S., Carpenter, A. E., Cimini, B. A. and de Jesus, M. B. (2025). Live-cell painting: Image-based profiling in live cells using acridine orange. Mol Biol Cell. 36(7): ee24–07–0308. https://doi.org/10.1091/mbc.e24-07-0308
分类
生物信息学与计算生物学
细胞生物学 > 细胞成像 > 荧光
您对这篇实验方法有问题吗?
在此处发布您的问题,我们将邀请本文作者来回答。同时,我们会将您的问题发布到Bio-protocol Exchange,以便寻求社区成员的帮助。