

A Protocol for Weighted Gene Co-expression Network Analysis With Module Preservation and Functional Enrichment Analysis for Tumor and Normal Transcriptomic Data
适用于肿瘤与正常转录组数据的加权基因共表达网络分析及模块保留与功能富集分析方案
发布: 2025年09月20日第15卷第18期 DOI: 10.21769/BioProtoc.5447 浏览次数: 2544
评审: Anonymous reviewer(s)
参见作者原研究论文
The authors used this protocol in:

Aug 2017
Advertisement


Abstract
Weighted gene co-expression network analysis (WGCNA) is widely used in transcriptomic studies to identify groups of highly correlated genes, aiding in the understanding of disease mechanisms. Although numerous protocols exist for constructing WGCNA networks from gene expression data, many focus on single datasets and do not address how to compare module stability across conditions. Here, we present a protocol for constructing and comparing WGCNA modules in paired tumor and normal datasets, enabling the identification of modules involved in both core biological processes and those specifically related to cancer pathogenesis. By incorporating module preservation analysis, this approach allows researchers to gain deeper insights into the molecular underpinnings of oral cancer, as well as other diseases. Overall, this protocol provides a framework for module preservation analysis in paired datasets, enabling researchers to identify which gene co-expression modules are conserved or disrupted between conditions, thereby advancing our understanding of disease-specific vs. universal biological processes.
Key features
• Presents a step-by-step WGCNA protocol with module preservation and functional enrichment analysis [1,2] using TCGA cancer data, demonstrating network differences between normal and tumor tissues.
• Preprocesses gene expression data and conducts downstream analysis for constructed networks.
• Requires 2–3 h hands-on time and 8–12 h total computational time, depending on dataset size and permutation number used for module preservation analysis.
Keywords: WGCNA (WGCNA)Graphical overview
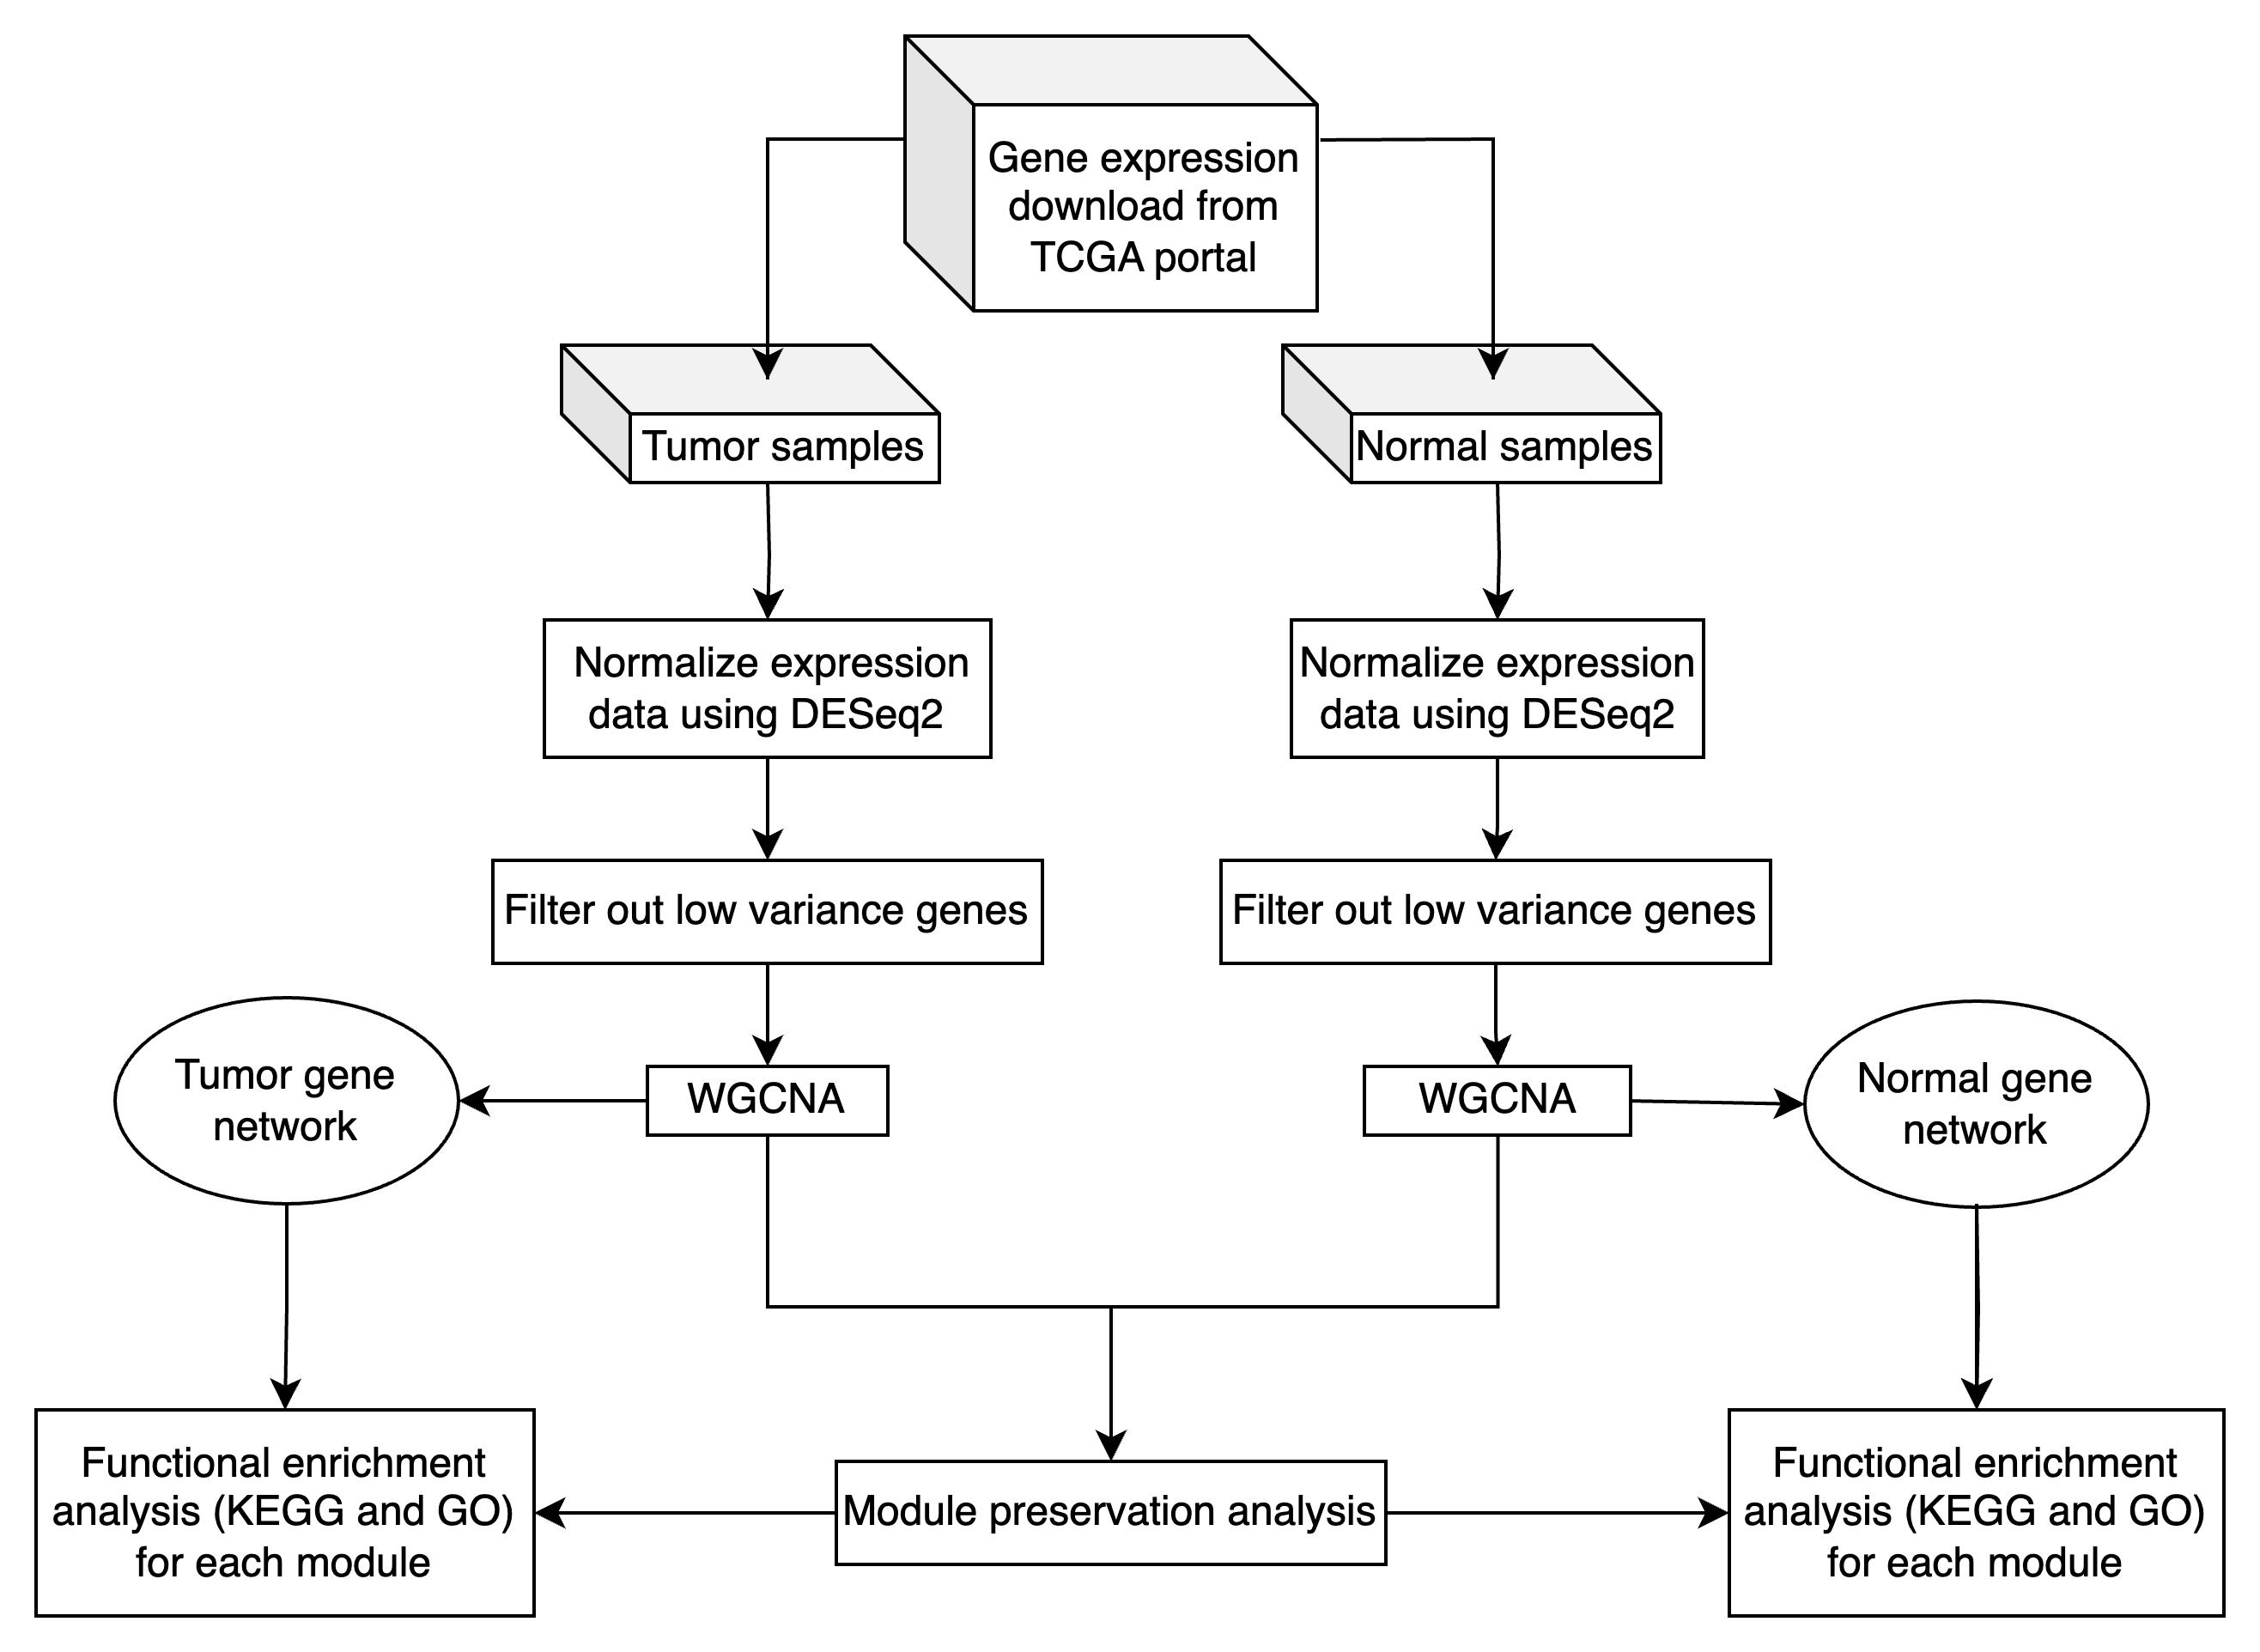
Overview of WGCNA and module preservation analysis in tumor and normal transcriptomic data
Background
Oral squamous cell cancer (OSCC) is a global public health issue, with prognosis closely linked to the stage of diagnosis. Although the five-year survival rate for early-stage OSCC is about 82.5%, it declines to 54.7% for locally advanced disease [3]. These statistics underscore the importance of identifying molecular pathways and key genes involved in OSCC pathogenesis to improve early detection and develop effective targeted therapies. Network analysis, particularly through weight gene co-expression network analysis (WGCNA) [1], has emerged as a powerful methodology for exploring complex gene expression data [1,4–11]. Unlike standard differential expression analyses that focus on individual genes, WGCNA identifies modules of highly correlated genes, providing insights into their underlying functional linkages and shared biological pathways [12]. WGCNA can construct scale-free gene co-expression networks to screen clusters (modules) of highly correlated genes, and the construction of modules is based on the inherent relationships between genes in the sample set. While WGCNA analysis can be performed entirely within the R environment, visualization of the resulting networks often benefits from specialized network visualization software. Cytoscape [13], an open-source platform for complex network analysis and visualization, has become a standard tool for representing gene co-expression networks due to its ability to handle large-scale biological networks and provide customizable visual representations of module structures and gene interactions [14]. WGCNA has been applied to several cancer types [15,16], providing insights into the molecular mechanisms underlying diseases. Manouchehri [17] used WGCNA to analyze gene expression data from prostate cancer patients and identified six significant gene expression modules correlated with cancer progression. This study highlighted the importance of population-specific studies in cancer research. Another study used WGCNA to identify 278 hub genes associated with tumorigenesis in tuberculosis-associated lung cancer [18]. For oral cancer, many studies have applied WGCNA to uncover potential prognostic makers [19], understand transcription dysregulation [20], and explore the mechanism of chemoresistance in OSCC [21]. Though WGCNA provides valuable insights into cancer gene expression, it also has some limitations, such as the need for large datasets and the complexity of interpreting co-expression networks. Module preservation analysis [2] enhances WGCNA by allowing researchers to assess the reproducibility and reliability of gene co-expression modules across different datasets, conditions, or tissue types, providing greater confidence in the biological interpretations drawn from the modules identified in a WGCNA analysis. In this protocol, we build upon previous WGCNA frameworks by constructing and comparing gene co-expression networks derived from both OSCC tumor and normal tissue samples. After identifying modules in each network, we apply module preservation analysis to determine which modules are conserved in both tumor and normal conditions. We demonstrate how to export WGCNA results for visualization in Cytoscape, enabling researchers to explore network topology and identify hub genes through interactive visual analysis. Conserved modules may represent core biological processes common to both states, while modules unique to either the tumor or normal network may highlight pathways directly relevant to OSCC pathogenesis. Previous tutorials have primarily focused on applying WGCNA to single datasets. Here, we provide a comprehensive guide for performing WGCNA and module preservation on paired tumor and normal datasets, offering a refined strategy to pinpoint functionally relevant gene clusters, improve biological interpretation, and advance our understanding of oral cancer biology.
Equipment
1. Personal computer with Windows, macOS, or a Unix-based operating system
Note: For these analyses, we recommend a computer with at least 32 GB of RAM and a modern multi-core processor.
Software and datasets
1. R software environment (> 4.4.0) (https://www.r-project.org/)
2. RStudio integrated development environment (> 1.4.0) (https://rstudio.com/)
3. WGCNA_1.73 (https://cran.r-project.org/web/packages/WGCNA/index.html)
4. DESeq2_1.46.0 (https://bioconductor.org/packages/release/bioc/html/DESeq2.html)
5. genefilter_1.88.0 [22] (https://www.bioconductor.org/packages/release/bioc/html/genefilter.html)
6. tidyverse_2.0.0 (https://cran.r-project.org/web/packages/tidyverse/index.html)
7. dendextend_1.19.0 (https://cran.r-project.org/web/packages/dendextend/index.html)
8. gplots_3.2.0 (https://cran.r-project.org/web/packages/gplots/index.html)
9. clusterProfiler_4.14.4 [23] (https://bioconductor.org/packages/release/bioc/html/clusterProfiler.html)
10. org.Hs.eg.db_3.20.0 (https://bioconductor.org/packages/release/data/annotation/html/org.Hs.eg.db.html). All gene annotations were performed using the org.Hs.eg.db package (version 3.20.0), which is consistent with the GRCh38 human genome assembly of the TCGA data
11. ggplot2_3.5.1 (https://cran.r-project.org/web/packages/ggplot2/index.html)
12. ggpubr_0.6.0 (https://cran.r-project.org/web/packages/ggpubr/index.html)
13. VennDiagram_1.7.3 ( https://cran.r-project.org/web/packages/VennDiagram/index.html)
14. dplyr_1.1.4 (https://cran.r-project.org/web/packages/dplyr/index.html)
15. GO.db_3.20.0 (https://bioconductor.org/packages/release/data/annotation/html/GO.db.html)
16. Code for WGCNA and preservation module analysis can be accessed through this GitHub link: https://github.com/biocoms/WGCNA
17. Dataset
Data can be directly downloaded through the TCGA portal. The analysis used gene expression data from the GDC Data Release v38.0, downloaded on October 18, 2023. The dataset is publicly available as a compressed file (GeneExpression.zip) in the GitHub repository: https://github.com/biocoms/WGCNA
if (!require("BiocManager", quietly = TRUE)) install.packages("BiocManager") BiocManager::install("TCGAbiolinks")TCGAbiolinks:::getProjectSummary("TCGA-HNSC")ge_query <- GDCquery( project = "TCGA-HNSC", data.category = "Transcriptome Profiling", data.type = "Gene Expression Quantification")GDCdownload(ge_query)output_m_query <- getResults(ge_query)normal_sample <- output_m_query$sample.submitter_id[output_m_query$sample_type == "Solid Tissue Normal"]tumor_sample <- output_m_query$sample.submitter_id[output_m_query$sample_type == "Primary Tumor"]ge_data <-GDCprepare(ge_query, summarizedExperiment = TRUE)# Extracts the expression valuesexpression_matrix <- assay(ge_data)expression_df <- as.data.frame(expression_matrix)expression_df <- cbind(Gene = rownames(expression_matrix), expression_df)colnames(expression_data) <- gsub("-.*$", "", colnames(expression_data))# Remove extra parts# Subset the expression data to include only normal samples/tumor samplenormal_expression_data <- expression_data[, colnames(expression_data) %in% normal_samples]tumor_expression_data <- expression_data[, colnames(expression_data) %in% tumor_samples]write.csv(normal_expression_data, “OSCC_TCGA_gene_expression_normal.csv)write.csv(tumor_expression_data, “OSCC_TCGA_gene_expression_tumor.csv)Based on the different purposes of research, we can manipulate the dataset by removing or filtering out some samples.
Caution: Troubleshooting and environment setup: this protocol was developed and tested using R version 4.4.0 or higher. However, we recognize that users may have different R versions. Here, we provide solutions for various compatibility issues:
For R versions 4.2.x–4.3.x:
Most functions should work, but some package versions may differ. If you encounter issues:
1. For WGCNA installation:
For older R versions, use the archived WGCNA version
install.packages("https://cran.r-project.org/src/contrib/Archive/WGCNA/WGCNA_1.72-1.tar.gz", repos = NULL, type = "source")2. For Bioconductor packages:
if (!requireNamespace("BiocManager", quietly = TRUE))install.packages("BiocManager")BiocManager::install(version = "3.17") # For R 4.3.xBiocManager::install(version = "3.16") # For R 4.2.xFor R 4.2.0 (Windows): Due to package compatibility issues with the older R version, users may encounter installation problems. Follow these steps:
1. Clean installation approach:
Remove any partially installed packages
remove.packages(c("WGCNA", "htmlTable", "knitr", "xfun"))Clear package cache
unlink(.libPaths()[1], recursive = TRUE)dir.create(.libPaths()[1])2. Use the compatibility script (recommended):
GitHub link: https://github.com/biocoms/WGCNA/blob/main/R_4.2.0_compatibility_script.R
3. Known issues and workarounds:
If htmlTable fails, install from source with install.packages("htmlTable", type = "source")
If the WGCNA function is not found, restart R after installation and explicitly load with library(WGCNA)
For quotation mark issues, ensure you are using straight quotes, not curly quotes.
For R versions < 4.2:
We strongly recommend upgrading to R 4.2 or higher. If an upgrade is not possible, use WGCNA version 1.70.3 or earlier. Some visualization features may not be available.
Procedure
文章信息
稿件历史记录
提交日期: Jun 18, 2025
接收日期: Aug 13, 2025
在线发布日期: Sep 2, 2025
出版日期: Sep 20, 2025
版权信息
© 2025 The Author(s); This is an open access article under the CC BY-NC license (https://creativecommons.org/licenses/by-nc/4.0/).
如何引用
Nguyen, P. and Zeng, E. (2025). A Protocol for Weighted Gene Co-expression Network Analysis With Module Preservation and Functional Enrichment Analysis for Tumor and Normal Transcriptomic Data. Bio-protocol 15(18): e5447. DOI: 10.21769/BioProtoc.5447.
分类
生物信息学与计算生物学
系统生物学 > 转录组学 > RNA测序
癌症生物学
您对这篇实验方法有问题吗?
在此处发布您的问题,我们将邀请本文作者来回答。同时,我们会将您的问题发布到Bio-protocol Exchange,以便寻求社区成员的帮助。