

Protein Turnover Dynamics Analysis With Subcellular Spatial Resolution
具有亚细胞空间分辨率的蛋白质周转动态分析
(*contributed equally to this work) 发布: 2025年08月05日第15卷第15期 DOI: 10.21769/BioProtoc.5409 浏览次数: 2695
评审: David PaulAnonymous reviewer(s)
参见作者原研究论文
The authors used this protocol in:

Mar 2024
Advertisement


Abstract
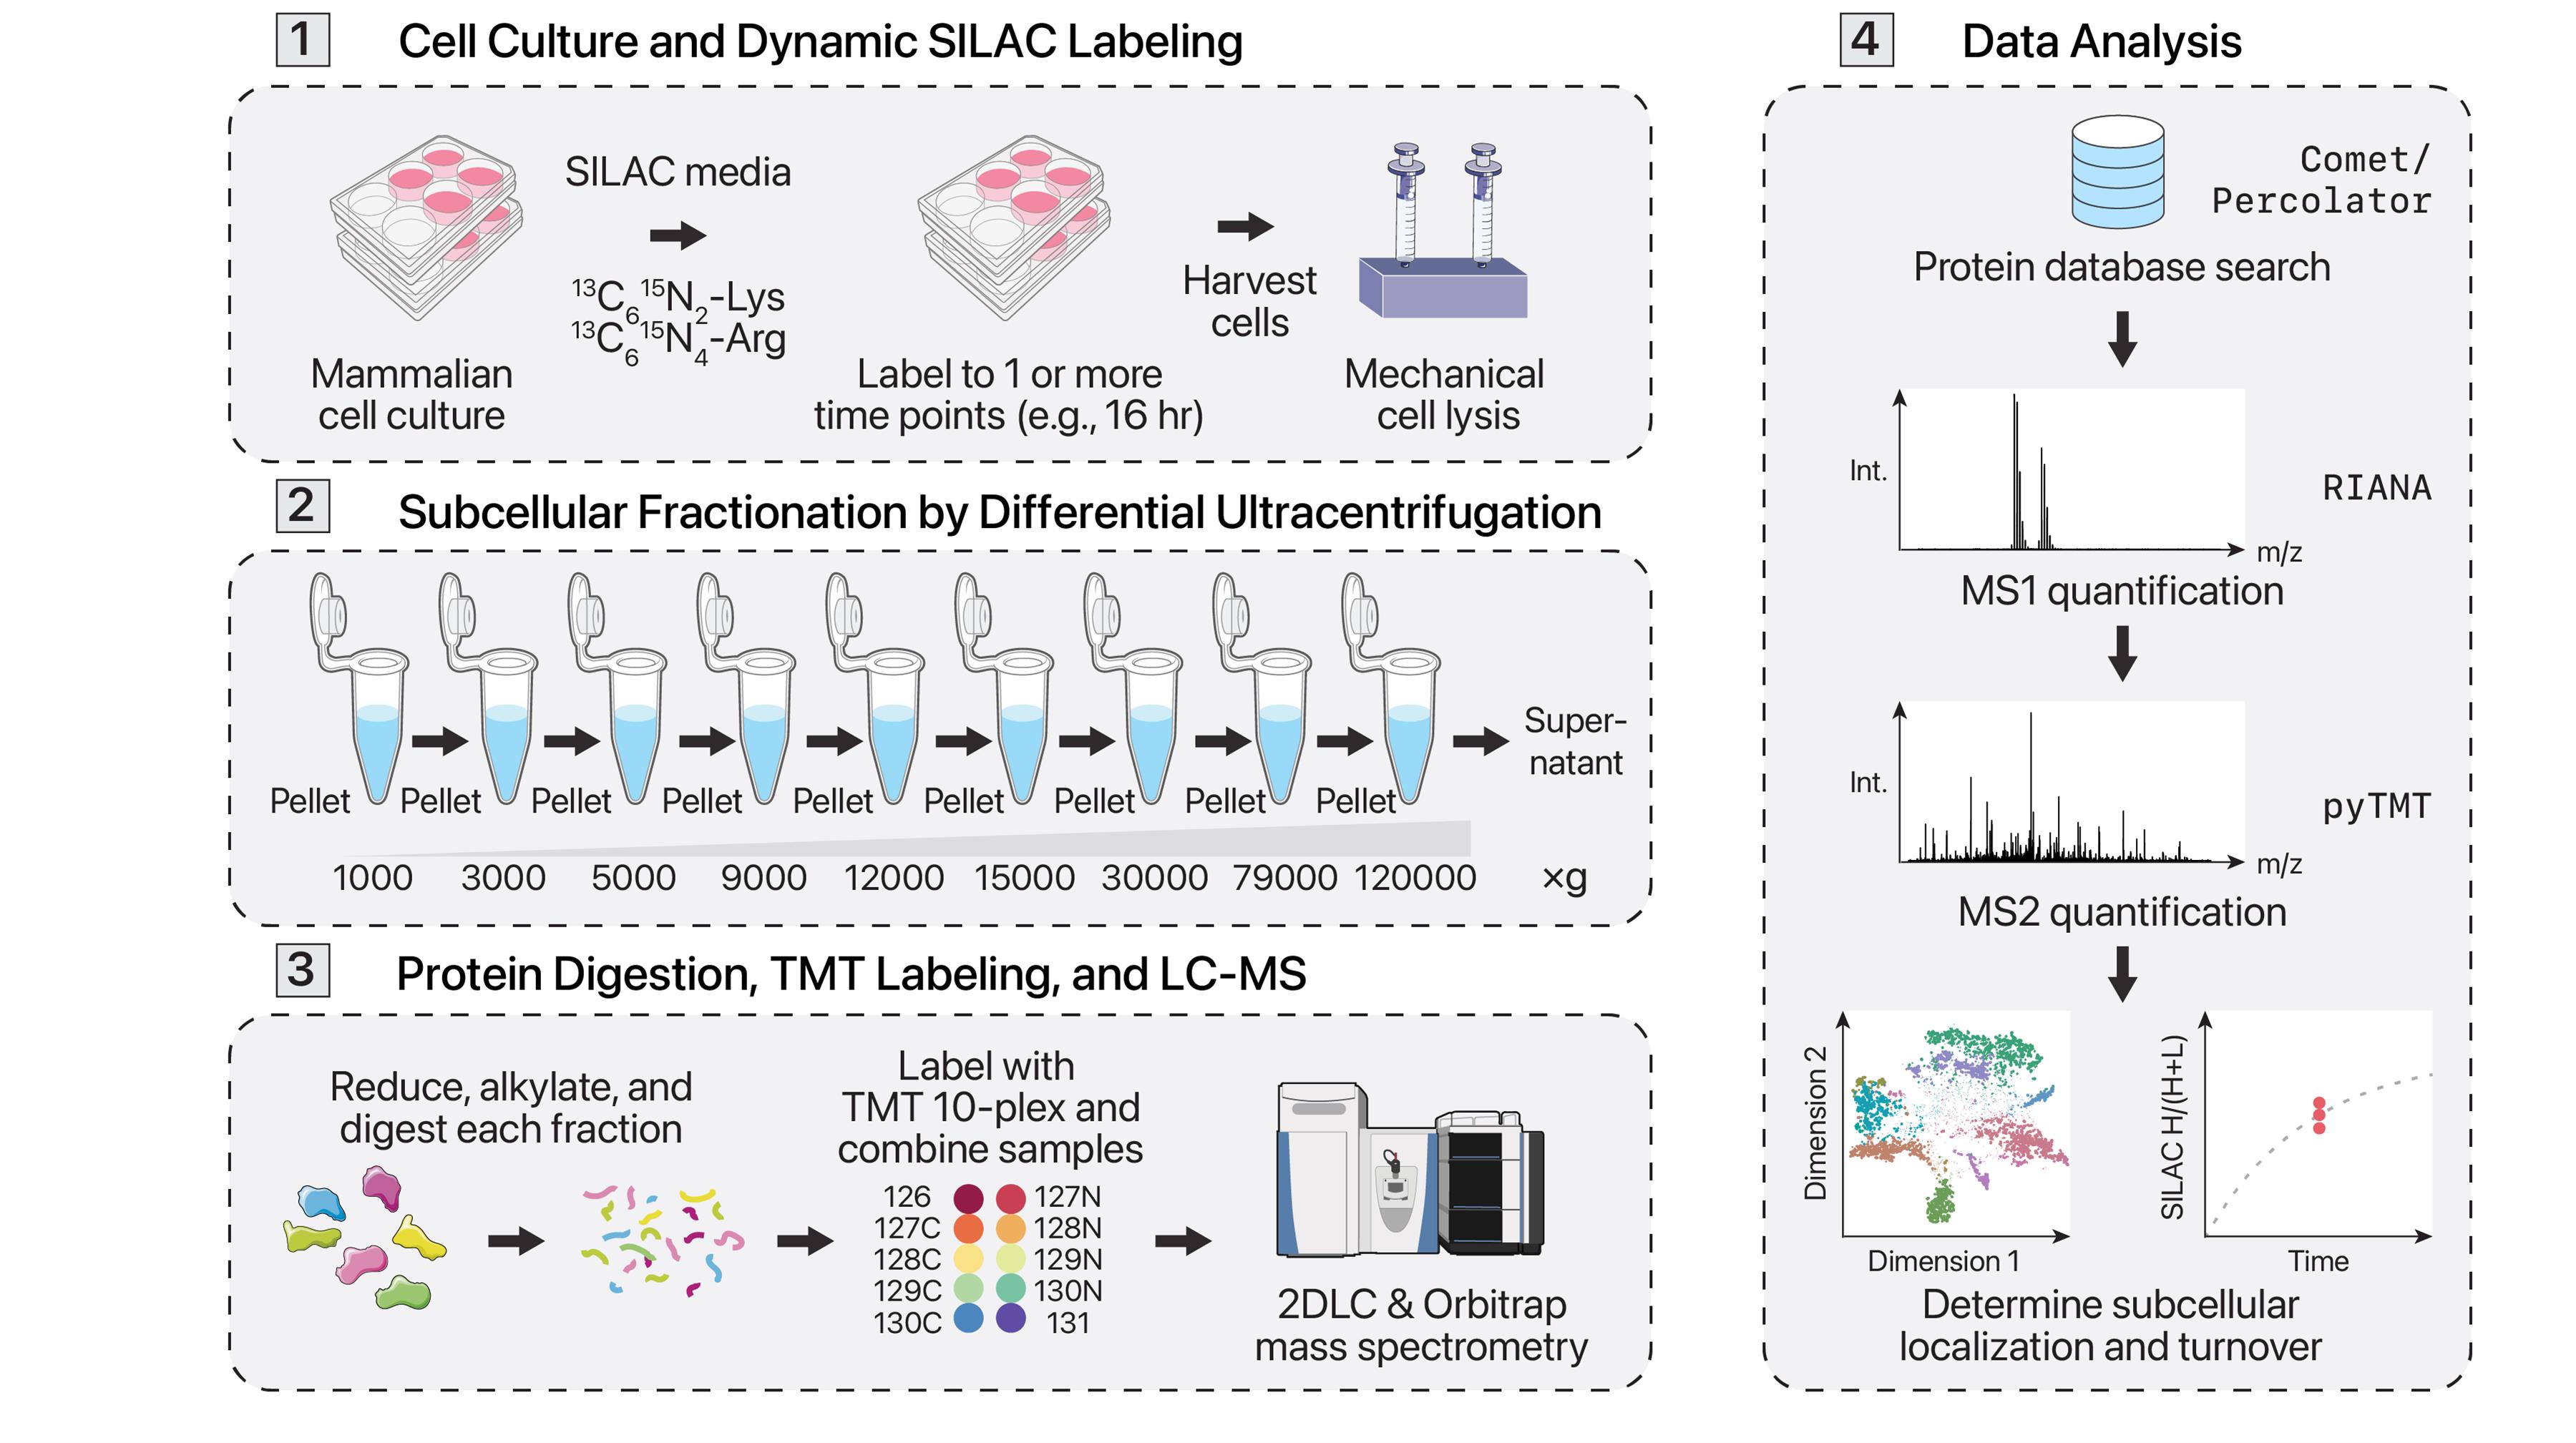
Protein synthesis and degradation (i.e., turnover) forms an important part of protein homeostasis and has been implicated in many age-associated diseases. Different cellular locations, such as organelles and membraneless compartments, often contain individual protein quality control and degradation machineries. Conventional methods to assess protein turnover across subcellular compartments require targeted genetic manipulation or isolation of specific organelles. Here we describe a protocol for simultaneous proteome localization and turnover (SPLAT) analysis, which combines protein turnover measurements with unbiased subcellular spatial proteomics to measure compartment-specific protein turnover rates on a proteome-wide scale. This protocol utilizes dynamic stable isotope labeling of amino acids in cell culture (dynamic SILAC) to resolve the temporal information of protein turnover and multi-step differential ultracentrifugation to assign proteins to multiple subcellular localizations. We further incorporate 2D liquid chromatography fractionation to greatly increase analytical depth while multiplexing with tandem mass tags (TMT) to reduce acquisition time 10-fold. This protocol resolves the spatial and temporal distributions of proteins and can also reveal temporally distinct spatial localizations within a protein pool.
Key features
• Captures protein turnover rates and subcellular localization of proteins.
• Hyperplexing of dynamic SILAC and TMT LOPIT-DC in MS1 and MS2 level data.
• Sample collection and processing can be completed within 1 week.
• Allows comparison of organellar proteome turnover rates.
Keywords: Proteomics (蛋白质组学)Graphical overview
Background
Mass spectrometry–based proteomics has traditionally focused on comparing steady-state protein abundances between various conditions to describe the biological processes occurring. However, protein abundances alone cannot provide a comprehensive description of the ongoing cellular processes. During a particular cellular process, protein abundance may stay consistent while protein utilization is altered. An alternative measure of protein utilization is protein turnover, or the replacement of existing protein with newly synthesized protein. The rate at which this occurs can be measured via dynamic stable isotope labeling of amino acids in cell culture (dynamic SILAC) [1–3]. Dynamic SILAC involves introducing heavy stable isotope–labeled essential amino acids, commonly lysine and/or arginine, into cells. The essential amino acids taken into cells are incorporated into newly synthesized proteins. The heavily labeled proteins and peptides can then be distinguished by their mass shifts and quantified via mass spectrometry. Protein turnover can then be calculated from the fractional incorporation of the heavy isotope into the total protein pool prior to full equilibration.
The turnover of proteins is influenced by their subcellular localization. For instance, proteins localized to the endomembrane system may be degraded via endoplasmic reticulum–associated protein degradation (ERAD) or autophagy, whereas mitochondrial matrix proteins may be degraded via a system of intra-mitochondrial AAA+ proteases that share homology with bacterial protease systems. Furthermore, it has become increasingly apparent that protein regulation can occur spatially rather than through changes in total abundance [4,5]. Mass spectrometry–based subcellular spatial proteomics methods have been developed that can assess the spatial distribution of proteins. These methods can largely be categorized as proximity labeling vs. ultracentrifugation-based methods. Ultracentrifugation-based protocols, including protein correlation profiling (PCP) [6], localization of organelle proteins by isotope tagging (LOPIT) and its variants [7–9], SubCellBarCode [6], and dynamic organellar maps (DOM) [10,11], have been widely used to identify protein subcellular localization and relocalization in cell models. These methods typically involve gently lysing cells while preserving organellar structures, then fractionating the cell lysate into multiple fractions with ultracentrifugation. Protein localization is then predicted by using a machine learning program from the distribution profile of a protein over the set of fractions compared to the distribution profiles for protein organelle markers.
Few methods exist that can orthogonally measure protein localization and turnover to provide a comprehensive protein spatial-temporal analysis. The conventional approach involves targeted isolation of specific organelles, such as the mitochondrion, to measure the half-life of organellar proteins [12]. Another method involves the targeted exogenous expression of a mitochondrially localized APEX protein to proximally label and pull down mitochondrial proteins, then measure their dynamic SILAC incorporation [13]. These methods, however, fall short of a global investigation of turnover across spatial locales. In a recent work, we presented an improved strategy that combines orthogonal approaches to simultaneously measure turnover and predict protein subcellular localization across many different organelles and compartments [14]. This method, termed simultaneous proteome localization and turnover (SPLAT), informs on the spatial distribution and temporal alterations in protein regulation by combining differential ultracentrifugation-based LOPIT (LOPIT-DC) and dynamic SILAC within one experiment. This is performed using a hyperplexing protocol that encodes SILAC and TMT information in MS1 and MS2 scans, as detailed below.
Materials and reagents
Biological materials
1. AC16 cell line (Milipore, catalog number: SCC109)
Reagents
1. PBS (Fisher, catalog number: BSSPBS1X6)
2. Trypsin-EDTA (Corning, catalog number: 25-053-CI)
3. HALT Protease and Phosphatase kit (Thermo, catalog number: PI78442)
4. HEPES (Thermo, catalog number: 11344041)
5. Sucrose (Thermo, catalog number: A15583.36)
6. Magnesium acetate (Fisher, catalog number: AC212552500)
7. DMEM-F12 for SILAC (Fisher, catalog number: PI88370)
8. Fetal bovine serum, dialyzed (Fisher, catalog number: A3382001)
9. 13C615N2 L-Lysine 2HCl (Fisher, catalog number: PI88209)
10. 13C615N4 L-Arginine HCl (Fisher, catalog number: PI89990)
11. DMEM-F12 (Fisher, catalog number: 10-090-CV)
12. Fetal bovine serum (Fisher, catalog number: A5209402)
13. LC-MS grade H2O (Sigma, catalog number: 7732-18-5)
14. SDS (Sigma Aldrich, catalog number: L6026-50G)
15. Urea (Fisher, catalog number: PR-V3171)
16. 1 M TEAB (Fisher, catalog number: PI90114PM)
17. 2-Chloroacetamide (Thermo, catalog number: 148415000)
18. TCEP (Thermo, catalog number: PI77720)
19. Sequencing-grade trypsin (Promega, catalog number: VA9000)
20. TMT 10-plex (Thermo, catalog number: 90309)
21. LC–MS anhydrous acetonitrile (Thermo, catalog number: A9561)
22. 50% hydroxylamine (Thermo, catalog number: B22202.AE)
23. Ammonium hydroxide (Fisher, catalog number: A669-500)
24. 0.1% formic acid (Fisher, catalog number: LS118-500)
25. Formic acid (Fisher, catalog number: A117-50)
26. Acetone (Thermo, catalog number: L10407.AU)
27. Trypan blue (Thermo, catalog number: T10282)
28. RIPA lysis buffer (Thermo, catalog number: 89901)
Solutions
1. 1 M pH 7.4 HEPES stock solution (see Recipes)
2. 1 M pH 8.5 HEPES stock solution (see Recipes)
3. Gentle lysis buffer (see Recipes)
4. SILAC media (see Recipes)
5. Neutralization media (see Recipes)
6. Resolubilization buffer (see Recipes)
7. 100 mM TEAB solution (see Recipes)
8. Urea solution (see Recipes)
9. 50 mM TEAB solution (see Recipes)
10. 2-Chloroacetamide solution (see Recipes)
11. 5% Hydroxylamine solution (see Recipes)
12. HPLC solvent A (see Recipes)
13. HPLC solvent B (see Recipes)
14. LC–MS solvent A (see Recipes)
15. LC–MS solvent B (see Recipes)
Recipes
1. 1 M pH 7.4 HEPES stock solution
| Reagent | Final concentration | Amount |
|---|---|---|
| HEPES | 1 M | 11.915 g |
| Total | -- | 50 mL |
Start with 30 mL of LC–MS H2O and adjust pH to 7.4 with NaOH. Adjust final volume to 50 mL with LC–MS-grade H2O.
2. 1 M pH 8.5 HEPES stock solution
| Reagent | Final concentration | Amount |
|---|---|---|
| 1 M pH 7.4 HEPES | 1 M | 5 mL |
| Total | -- | 5 mL |
Adjust pH to 8.5 with NaOH.
3. Gentle lysis buffer
| Reagent | Final concentration | Amount |
|---|---|---|
| Sucrose | 0.25 M | 21.294 g |
| HEPES pH 7.4 | 10 mM | 2.5 mL |
| Magnesium acetate | 2 mM | 107.225 mg |
| Total | -- | 250 mL |
Bring to final volume with milli-Q H2O and filter using a 0.22 μm filter.
4. SILAC media
| Reagent | Final concentration | Amount |
|---|---|---|
| DMEM-F12 for SILAC | -- | 315.1 mL |
| Fetal bovine serum, dialyzed | 1% | 3.2 mL |
| 220.216 mM 13C615N2 L-Lysine 2 HCl | 0.499 mM | 725.11 μL |
| 226.66 mM 13C615N4 L-Arginine HCl | 0.699 mM | 986.85 μL |
| Total | -- | 320 mL |
Resuspend each 50 mg isotope bottle in 1 mL of SILAC DMEM-F12 to reach stock concentration. Filter using a 0.22 μm filter and aliquot into 50 mL conical tubes.
5. Neutralization media
| Reagent | Final concentration | Amount |
|---|---|---|
| DMEM-F12 | -- | 450 mL |
| Fetal bovine serum | 10% (v/v) | 50 mL |
| Total | -- | 500 mL |
6. Resolubilization buffer
| Reagent | Final concentration | Amount |
|---|---|---|
| 1 M HEPES pH 8.5 | 50 mM | 100 μL |
| 10% SDS | 0.5% | 100 μL |
| Urea | 8 M | 0.961 g |
| Total | -- | 2 mL |
Bring to final volume with LC–MS-grade H2O.
7. 100 mM TEAB solution
| Reagent | Final concentration | Amount |
|---|---|---|
| 1 M TEAB | 100 mM | 4 mL |
| Total | -- | 40 mL |
Bring to final volume with LC–MS-grade H2O.
8. Urea solution
| Reagent | Final concentration | Amount |
|---|---|---|
| Urea | 8 M | 4.8 g |
| 1 M TEAB | 100 mM | 1 mL |
| Total | -- | 10 mL |
Prepare fresh. Bring to final volume with LC–MS-grade H2O.
9. 50 mM TEAB solution
| Reagent | Final concentration | Amount |
|---|---|---|
| 1 M TEAB | 50 mM | 250 μL |
| Total | -- | 5 mL |
Bring to final volume with LC–MS-grade H2O.
10. 2-Chloroacetamide solution
| Reagent | Final concentration | Amount |
|---|---|---|
| 2-Chloroacetamide | 0.4 M | 37.4 mg |
| 1M TEAB | 100 mM | 100 μL |
| Total | -- | 1 mL |
Prepare fresh. Bring to final volume with LC–MS-grade H2O. Wrap in foil to prevent reaction with light.
11. 5% Hydroxylamine solution
| Reagent | Final concentration | Amount |
|---|---|---|
| 50% Hydroxylamine | 5% | 50 μL |
| 1 M TEAB | 50 mM | 25 μL |
| Total | -- | 500 μL |
Bring to final volume with LC–MS-grade H2O.
12. HPLC solvent A
| Reagent | Final concentration | Amount |
|---|---|---|
| Ammonium hydroxide | 20 mM | 1.39 mL |
| Total | -- | 1 L |
Start with 800 mL of LC–MS water and 1.39 mL of ammonium hydroxide. Adjust pH to 10 with 0.1% formic acid. Adjust the final volume to 1 L with LC–MS-grade H2O.
13. HPLC solvent B
| Reagent | Final concentration | Amount |
|---|---|---|
| Ammonium hydroxide | 20 mM | 1.39 mL |
| Acetonitrile | -- | 998.61 mL |
| Total | -- | 1 L |
Start with 800 mL of LC–MS-grade acetonitrile and 1.39 mL of ammonium hydroxide. Adjust pH to 10 with 0.1% formic acid. Adjust the final volume to 1 L with LC–MS-grade acetonitrile.
14. LC–MS solvent A
| Reagent | Final concentration | Amount |
|---|---|---|
| Formic acid | 0.1% | 1 mL |
| Total | -- | 1 L |
Adjust the final volume to 1 L with LC–MS-grade H2O.
15. LC-MS solvent B
| Reagent | Final concentration | Amount |
|---|---|---|
| Formic acid | 0.1% | 1 mL |
| LC–MS acetonitrile | 80% | 800 mL |
| Total | -- | 1 L |
Adjust the final volume to 1 L with LC–MS-grade H2O.
Laboratory supplies
1. Pipettes (Eppendorf, model: Reference 2 series)
2. Eppendorf Protein LoBind tube 1.5 mL (Fisher, catalog number: 22431102)
3. Eppendorf Protein LoBind tube 2 mL (Fisher, catalog number: 22431081)
4. 15 mL conical tubes (Fisher, catalog number: CN5601)
5. 50 mL conical tubes (Fisher, catalog number: CW5603)
6. 18-gauge needles (Fisher, catalog number: 14-817-151)
7. 4 mL round bottom polypropylene thick wall tubes (Beckman, catalog number: 355644)
8. 13 mm diameter Delrin tube adapter (Beckman, catalog number: 303392)
9. 13.5 mL round bottom polypropylene thick wall tubes (Beckman, catalog number: 326814)
10. 16 mm diameter Delrin tube adapter (Beckman, catalog number: 303448)
11. 1.5 mL bioruptor Pico microtubes with caps (Diagenode, catalog number: C30010016)
12. Protein concentrators PES, 10K MWCO, 0.5–100 mL (Thermo, catalog number: 88513)
13. Jupiter 4-µm Proteo 90A 150 × 1 mm LC column (Phenomenex, catalog number: PRD696758)
14. Acclaim PepMap 100 75 μm × 2 cm trap column (Thermo, catalog number: 164946)
15. PepMap RSLC C18 3 μm 100Å 75 µm × 15 cm analytical column (Thermo, catalog number: ES900)
Equipment
1. -80 °C freezer (Thermo Fisher, model: TSX60086A)
2. -20 °C freezer (Frigidaire, model: FFU21M7HWN)
3. 4 °C refrigerator (Frigidaire, model: FRU17GAJW22)
4. Biosafety cabinet (Labconico, model: 302489101)
5. CO2 incubator (Eppendorf, model: C170i)
6. Automated cell counter (Invitrogen, model: Countess II FL)
7. Centrifuge compatible with 15 and 50 mL conical tubes (Eppendorf, model: 5702)
8. Ultracentrifuge (Beckman Coulter, model: Optima Max-XP Ultracentrifuge)
9. Ultracentrifuge rotor (Beckman Coulter, model: TLA-55)
10. Scale (VWR, model: VWR-64B2)
11. Centrifuge compatible with 2 mL tubes (Eppendorf, model: 5424 R)
12. Bioruptor sonicator with cooler (Diagenode, model: Picorupter)
13. UHPLC (Thermo, model: Easy-nLC 1200)
14. Mass spectrometer (Thermo, model: Q-Exactive HF)
15. Offline UHPLC (Thermo, model: Ultimate 3000)
16. 6-port switching valve for offline UHPLC sample loop (Rheodyne, model: MXT715)
17. Fraction collector (Bio-Rad, model: 2110 Fraction Collector)
18. Plate reader (Thermo, model: Multiscan GO)
19. SpeedVac (Thermo, model: Speedvac SPD120)
Software and datasets
1. Xcalibur (Thermo 4.0)
2. Chromeleon (Thermo 7.0)
3. UniProt(https://www.uniprot.org, accessed 10-27-2022)
4. Comet (https://uwpr.github.io/Comet/, accessed 10-27-2022)
5. Percolator (https://percolator.ms, accessed 10-27-2022)
6. pyTMT (https://github.com/Lau-Lab/pytmt)
7. RIANA (https://github.com/ed-lau/riana)
8. R version 4.1 or higher (https://www.r-project.org)
9. RStudio (https://posit.co)
10. pRoloc (https://www.bioconductor.org/packages/release/bioc/html/pRoloc.html)
11. bandle (https://www.bioconductor.org/packages/release/bioc/html/bandle.html)
Procedure
文章信息
稿件历史记录
提交日期: Apr 28, 2025
接收日期: Jul 6, 2025
在线发布日期: Jul 29, 2025
出版日期: Aug 5, 2025
版权信息
© 2025 The Author(s); This is an open access article under the CC BY-NC license (https://creativecommons.org/licenses/by-nc/4.0/).
如何引用
Alamillo, L., Black, A., Lam, M. P. Y. and Lau, E. (2025). Protein Turnover Dynamics Analysis With Subcellular Spatial Resolution. Bio-protocol 15(15): e5409. DOI: 10.21769/BioProtoc.5409.
分类
系统生物学 > 空间转录组学
生物化学 > 蛋白质 > 定量
细胞生物学 > 细胞结构 > 细胞器
您对这篇实验方法有问题吗?
在此处发布您的问题,我们将邀请本文作者来回答。同时,我们会将您的问题发布到Bio-protocol Exchange,以便寻求社区成员的帮助。